Categories
Commentary

Bubblicious

Good Morning! I hope you had a great weekend and enjoy today’s letter. I would be so honored if you could comment and/or share this post. Cheers!

Optimism from earnings growth among large stocks overshadows concerns about instability abroadquarterly debt sales, and the diminishing likelihood of an immediate interest rate cut.

“The U.S. is doing pretty well,” Yardeni Research founder Ed Yardeni remarks, noting a shift from speculation about interest rates allows the market to focus on fundamentals. “Right now, the fundamentals are good for the economy. And, there’s plenty of hype around about.”

Multiple rate cuts totaling nearly 125 basis points in the next year remain expected. This seems extreme unless there’s a market crash, says Harley Bassman, inventor of the MOVE Index measuring bond market volatility. Bassman believes current pricing reflects a bimodal scenario, with an 85% chance rates remain stable and a 15% chance they drop to 1%. Combining these probabilities, the market arrives at the anticipated cuts by year-end.

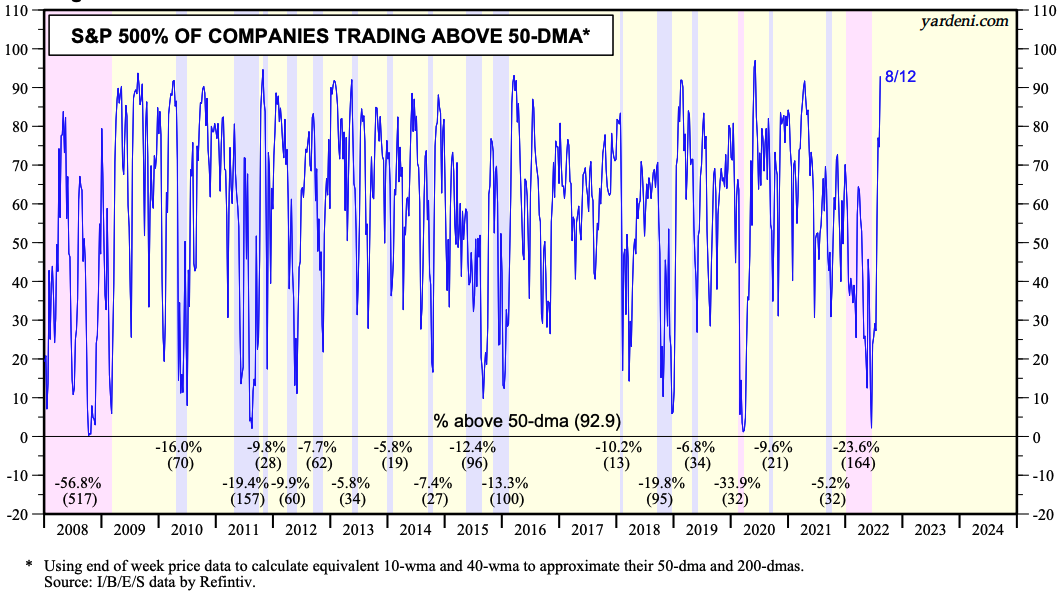
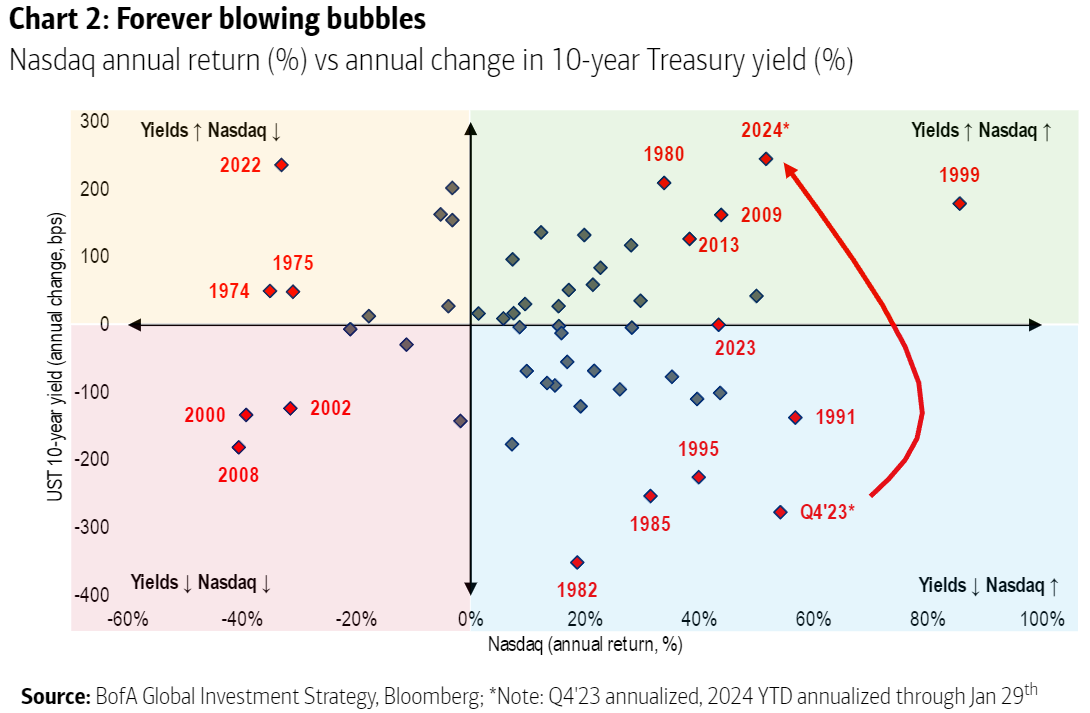
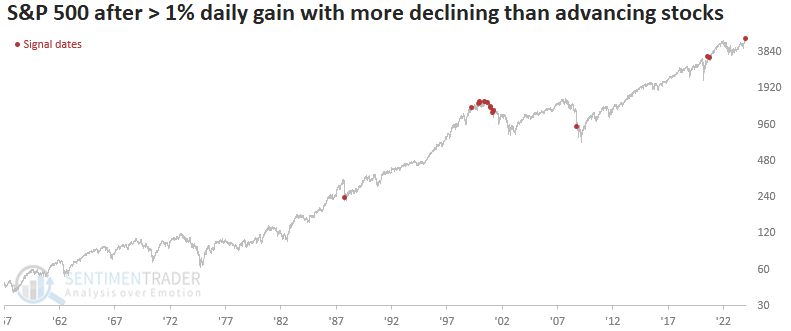
Naturally, markets are cyclical, moving from one extreme to another. Despite the fundamentals being in order, a lack of broad participation is evident in the more significant number of declining stocks than advancing ones. This situation, resembling patterns seen during the late ‘90s infotech-and-telecom boom, is frequently an indicator of less resilient future returns.

Graphic: Retrieved from Bank of America Global Research.

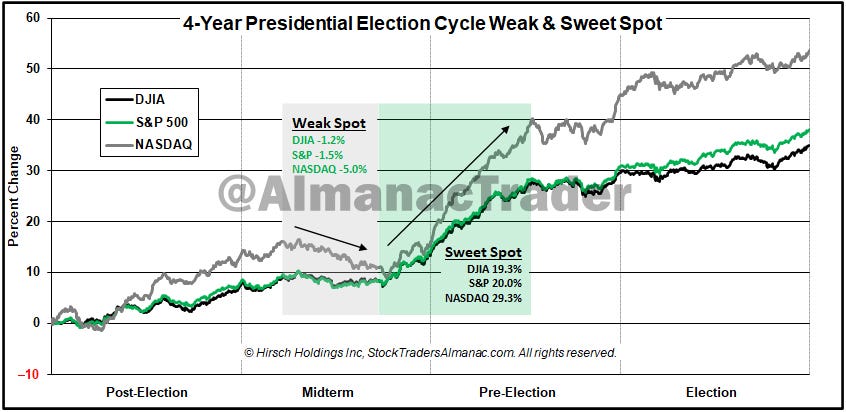
Ryan Detrick of Carson Group notes that February typically experiences less momentum than January, often due to reinvestment and bonus inflows. Data shows that when the S&P 500 recorded a 20% gain for the year, February tended to underperform, especially in the latter half of the month, which typically marked the weakest two-week period of the year.

Graphic: Retrieved from SentimenTrader via Jason Goepfert.

While the same volatility-suppressing trades detailed in last week’s letter continue to support markets where they are ceteris paribus (where customers sell volatility, and dealers hedge by buying stock/futures during declines and selling during strength), there has been “SPX/SPY downside buying (put flys) and ongoing VIX call buying,” Nomura Americas Cross-Asset Macro Strategist Charlie McElligott writes. This steepens implied volatility skew, benefitting the underappreciated hedge opportunities shared in Physik Invest’s Market Intelligence letters.

Graphic: Retrieved from SpotGamma on February 5, 2024.

The recent repricing has allowed unbalanced, out-of-the-money options spreads to retain their value better amid ongoing market gains. The focus has shifted from worries about missed opportunities to safeguarding against potential downturns. This shift may be attributed to concerns beyond poor market breadth and the possibility of localized issues in places like China impacting global markets. These include geopolitical tensionsturbulence in specific capital market segments, lingering effects of extensive government spending, and looming debt crises.

Graphic: Retrieved from SpotGamma on February 1, 2024.

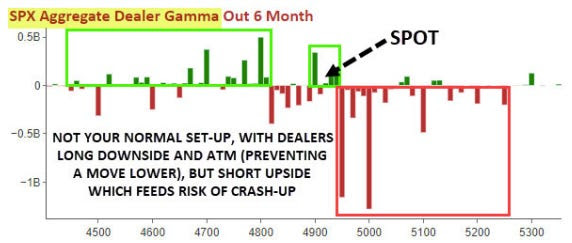
With the popularity of yield-enhancing trades like selling options, there’s concern that if significant market movements materialize, a greater share of end users will shift to buying options, indirectly exacerbating market volatility and downside.

Graphic: Retrieved from QVR Advisors.

To explain this phenomenon, we start with the options delta, which measures how much an option’s price will change for every $1 change in the underlying asset’s price. When end users sell put options, market makers buy them, assuming a negative delta stance, thus prompting them to acquire the underlying asset to hedge (which has a positive delta). Conversely, when end users buy put options, dealers sell them, taking on a positive delta. Consequently, they need to sell the underlying asset (which has a negative delta) to hedge. In sharp and volatile market declines, options sellers may opt to cover their positions by purchasing options, thereby diminishing stability as counterparties hedge in line with the market movement.

Graphic: Retrieved from Nomura.

Kris Sidial from The Ambrus Group emphasizes second-order effects are further amplified due to the large scale of options selling, adding concentration among market makers as another risk to watch. Scott Rubner, a tactical specialist at Goldman Sachs Group, concurs current market problems, and the unwind of stretched positioning may lead to a weak February.

Categories
Commentary

Daily Brief For August 15, 2022

The daily brief is a free glimpse into the prevailing fundamental and technical drivers of U.S. equity market products. Join the 800+ that read this report daily, below!

Graphic updated 7:30 AM ET. Sentiment Neutral if expected /ES open is inside of the prior day’s range. /ES levels are derived from the profile graphic at the bottom of the following section. Levels may have changed since initially quoted; click here for the latest levels. SqueezeMetrics Dark Pool Index (DIX) and Gamma (GEX) calculations are based on where the prior day’s reading falls with respect to the MAX and MIN of all occurrences available. A higher DIX is bullish. At the same time, the lower the GEX, the more (expected) volatility. Learn the implications of volatility, direction, and moneyness. Breadth reflects a reading of the prior day’s NYSE Advance/Decline indicator. VIX reflects a current reading of the CBOE Volatility Index (INDEX: VIX) from 0-100.

Fundamental

According to Goldman Sachs Group Inc (NYSE: GS) Prime Services, this is the third largest short-covering rally in three years.

Graphic: Retrieved from The Market Ear. Via Goldman Sachs Group Inc.

The rally, as discussed in past commentaries, is, in part, the result of “volatility-target funds” and “trend-following funds” getting back into the market as volatility falls, sentiment and data on jobs improve, as well as cooler-than-expected inflation figures.

Graphic: Retrieved from Stenos Signals. “Unless SMEs are lying, inflation has peaked for now … Will it change the market psychology?”

“The machines seem hell-bent on pushing the financial conditions easing trade,” said Dennis DeBusschere, the founder of 22V Research. 

“Machines are eating the words from the Fed speakers for breakfast.”

Graphic: Retrieved from Bloomberg. “The issue is the giant pool of systematic funds that moves in and out of the market based on how turbulent prices are. With peace at hand of late amid a four-week rally, so-called volatility-target funds and similar strategies such as risk parity are buying between $2 billion to $4 billion of stocks per day, according to an estimate by JPMorgan Chase & Co.’s Kate Gandolfo.”

Notwithstanding, JPMorgan Chase & Co (NYSE: JPM) estimates overall CTA exposures remain subdued. To incite ultra-impactful “buy signals” the S&P 500 would have to rise to $4,400.00.

This “would prompt CTAs to step up buying” and, potentially, turn “‘max long’ on stocks, buying probably $100 billion to $200 billion across various trend-following strategies.”

Graphic: Retrieved from Yardeni Research Inc.

Though the S&P 500 has yet to retake the $4,400.00 level, likely to remain as support until the end of the week, at least, are options hedging flows, which we talked about last week. 

“That can last perhaps another 100 days if volatility stays low,” JPM’s Kate Gandolfo suggested.

For context, at least at the index level, customers are short call, long put against their equity. In a rising market, the call side solicits increased hedging on the part of counterparties. 

If counterparties are long the call, and the market is rising (falling), they must sell (buy) underlying to re-hedge. This can further contain realized volatility and support the market.

To act on this information, you are best off shrinking your timeframe and using if/then statements to put on trades. For instance, if the market rises past the downtrend line in the S&P 500, then the 2022 equity bear market is over. We should bias ourselves long, at that point.

Graphic: Retrieved from Bloomberg. Drawn on by Physik Invest.

Accordingly, over a larger horizon, its growth impulses, as well as the availability of credit and liquidity determine whether a market’s movements have legs.

Accordingly, “in the 1970s, the peak in inflation proved THE timing to load up on risk assets, but the missing link is a bottoming growth cycle,” Andreas Steno Larsen explained.

“The swiftly weakening growth cycle may rather be the EXACT reason why inflation has started to fade.”

The likes of Campbell Harvey, PhD, Kai Volatility’s Cem Karsan, among others, share a similar belief. 

In fact, Credit Suisse Group AG’s (NYSE: CS) Zoltan Pozsar sees inflation as a longer-lasting structural issue as “the pillars of the low inflation world – [de-globalization and populism] – are changing.”

As Crossmark Global Investments’ Victoria Fernandez puts it well, “We have probably reached peak inflation, but the stickiness of the inflation that remains (i.e., rents) keeps pressure on the Fed and therefore the markets.”

Graphic: Retrieved from The Macro Compass.

“We expected a summer rally due to better-than-expected earnings, but we aren’t satisfied that this is sustainable. A soft landing is still achievable, but we still anticipate volatility with so many unknowns out there.”

Graphic: Retrieved from Callum Thomas’ Weekly S&P 500 ChartStorm. The “seasonal/cycle outlook is for a lower low or retest of the lows over the next three months as we are in the worst two months of the year and are smack dab in the *Weak Spot* of the 4-Year Cycle”

Positioning

Please refer to our detailed Daily Brief for August 12, 2022. We shall add to this narrative in the coming sessions.

Technical

As of 7:30 AM ET, Monday’s regular session (9:30 AM – 4:00 PM ET), in the S&P 500, is likely to open in the lower part of a negatively skewed overnight inventory, inside of prior-range and -value, suggesting a limited potential for immediate directional opportunity.

In the best case, the S&P 500 trades higher.

Any activity above the $4,253.25 HVNode puts into play the $4,275.75 LVNode. Initiative trade beyond the LVNode could reach as high as the $4,303.00 Weak High and $4,337.00 VPOC, or higher.

In the worst case, the S&P 500 trades lower.

Any activity below the $4,253.25 HVNode puts into play the $4,231.00 VPOC. Initiative trade beyond the VPOC could reach as low as the $4,202.75 RTH Low and $4,189.25 LVNode, or lower.

Click here to load today’s key levels into the web-based TradingView charting platform. Note that all levels are derived using the 65-minute timeframe. New links are produced, daily.
Graphic: 65-minute profile chart of the Micro E-mini S&P 500 Futures.

Definitions

Volume Areas: A structurally sound market will build on areas of high volume (HVNodes). Should the market trend for long periods of time, it will lack sound structure, identified as low volume areas (LVNodes). LVNodes denote directional conviction and ought to offer support on any test. 

If participants were to auction and find acceptance into areas of prior low volume (LVNodes), then future discovery ought to be volatile and quick as participants look to HVNodes for favorable entry or exit.

POCs: POCs are valuable as they denote areas where two-sided trade was most prevalent in a prior day session. Participants will respond to future tests of value as they offer favorable entry and exit.

MCPOCs: POCs are valuable as they denote areas where two-sided trade was most prevalent over numerous day sessions. Participants will respond to future tests of value as they offer favorable entry and exit.

Volume-Weighted Average Prices (VWAPs): A metric highly regarded by chief investment officers, among other participants, for quality of trade. Additionally, liquidity algorithms are benchmarked and programmed to buy and sell around VWAPs.

About

After years of self-education, strategy development, mentorship, and trial-and-error, Renato Leonard Capelj began trading full-time and founded Physik Invest to detail his methods, research, and performance in the markets.

Capelj also develops insights around impactful options market dynamics at SpotGamma and is a Benzinga reporter.

Some of his works include conversations with ARK Invest’s Catherine Wood, investors Kevin O’Leary and John Chambers, FTX’s Sam Bankman-Fried, ex-Bridgewater Associate Andy Constan, Kai Volatility’s Cem Karsan, The Ambrus Group’s Kris Sidial, among many others.

Disclaimer

In no way should the materials herein be construed as advice. Derivatives carry a substantial risk of loss. All content is for informational purposes only.