What Happened: On June 23, 2021, shares of Tesla Inc (NASDAQ: TSLA) surged on news the company opened a Chinese-based solar-powered charging station with on-site power storage.
Prior to the development, the stock endured months of corrective activity during which negative narratives were out in full force. From calls against Tesla’s biggest bull – ARK Invest – to famed Michael Burry’s synthetic short position on the stock, it seemed as though the end was near.
However, as evidenced by Tesla’s June 23 breakout from consolidation and subsequent upside continuation in light of a 300,000 vehicle recall in China, it is obvious the fear was unwarranted.
Those who understand that markets are most influenced by credit and positioning knew this all along.
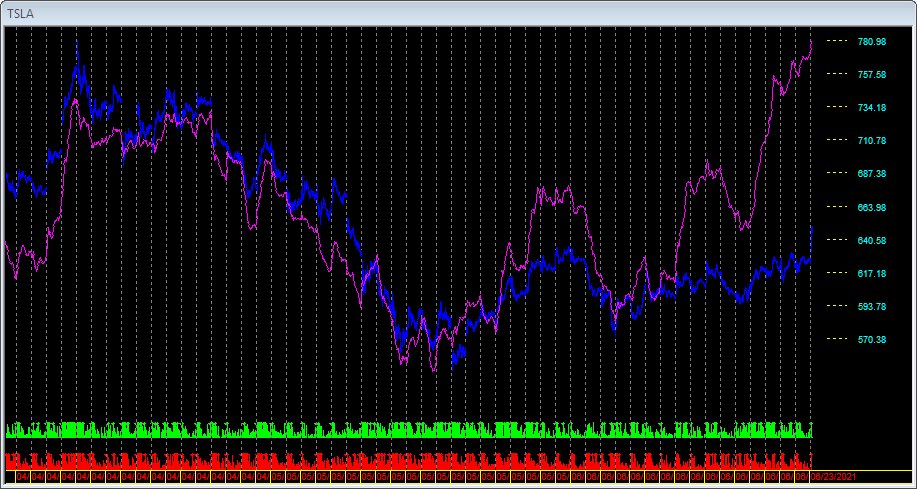
Taking a look at market liquidity metrics – such as those offered by services like HFT Alert – market participants had been aggressively accumulating shares of the company from its mid-May low.
Graphic 1: Buying accelerates (as evidenced by the purple line), in Tesla, after its mid-May bottom, via HFT Alert.
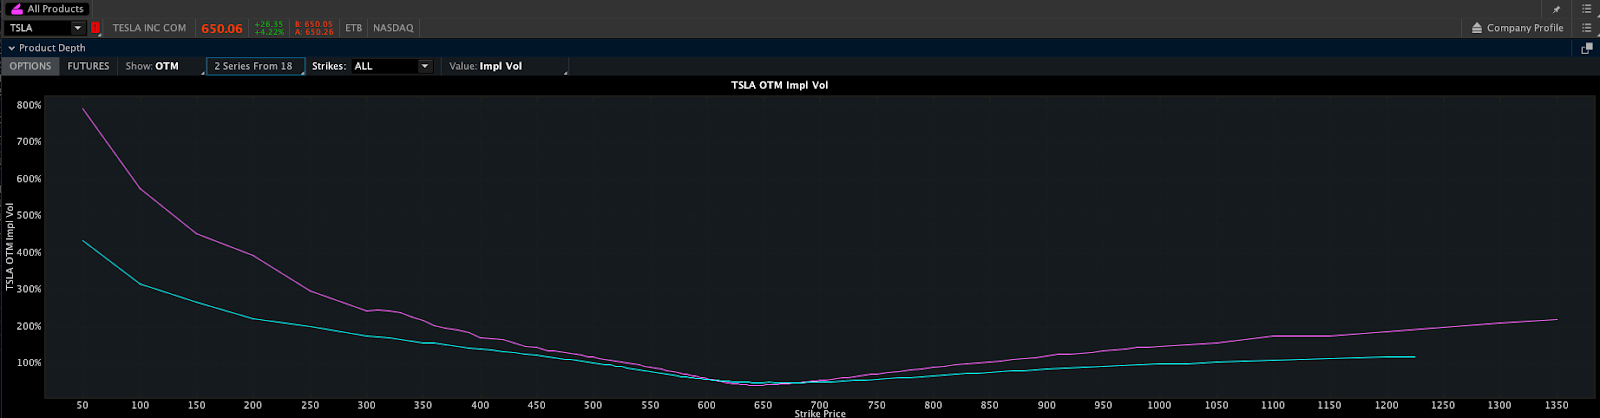
Still, with skepticism out in full force, there was a heightened demand for protection, as evidenced by metrics like volatility skew, in options at and below the current stock price.
Skew: The difference in implied volatility (IV) – an estimate of potential price changes given the fear of movement – between option strikes that are close and far from the underlying stock price.
To put it simply, the fear of corrective activity in Tesla fueled demand for protection via put option strikes farther below the stock. This, in turn, bid volatility in downside strikes, more than upside strikes. Because volatility is input in option pricing models, put options, further down the chain, were valued more relative to their call-side counterparts.
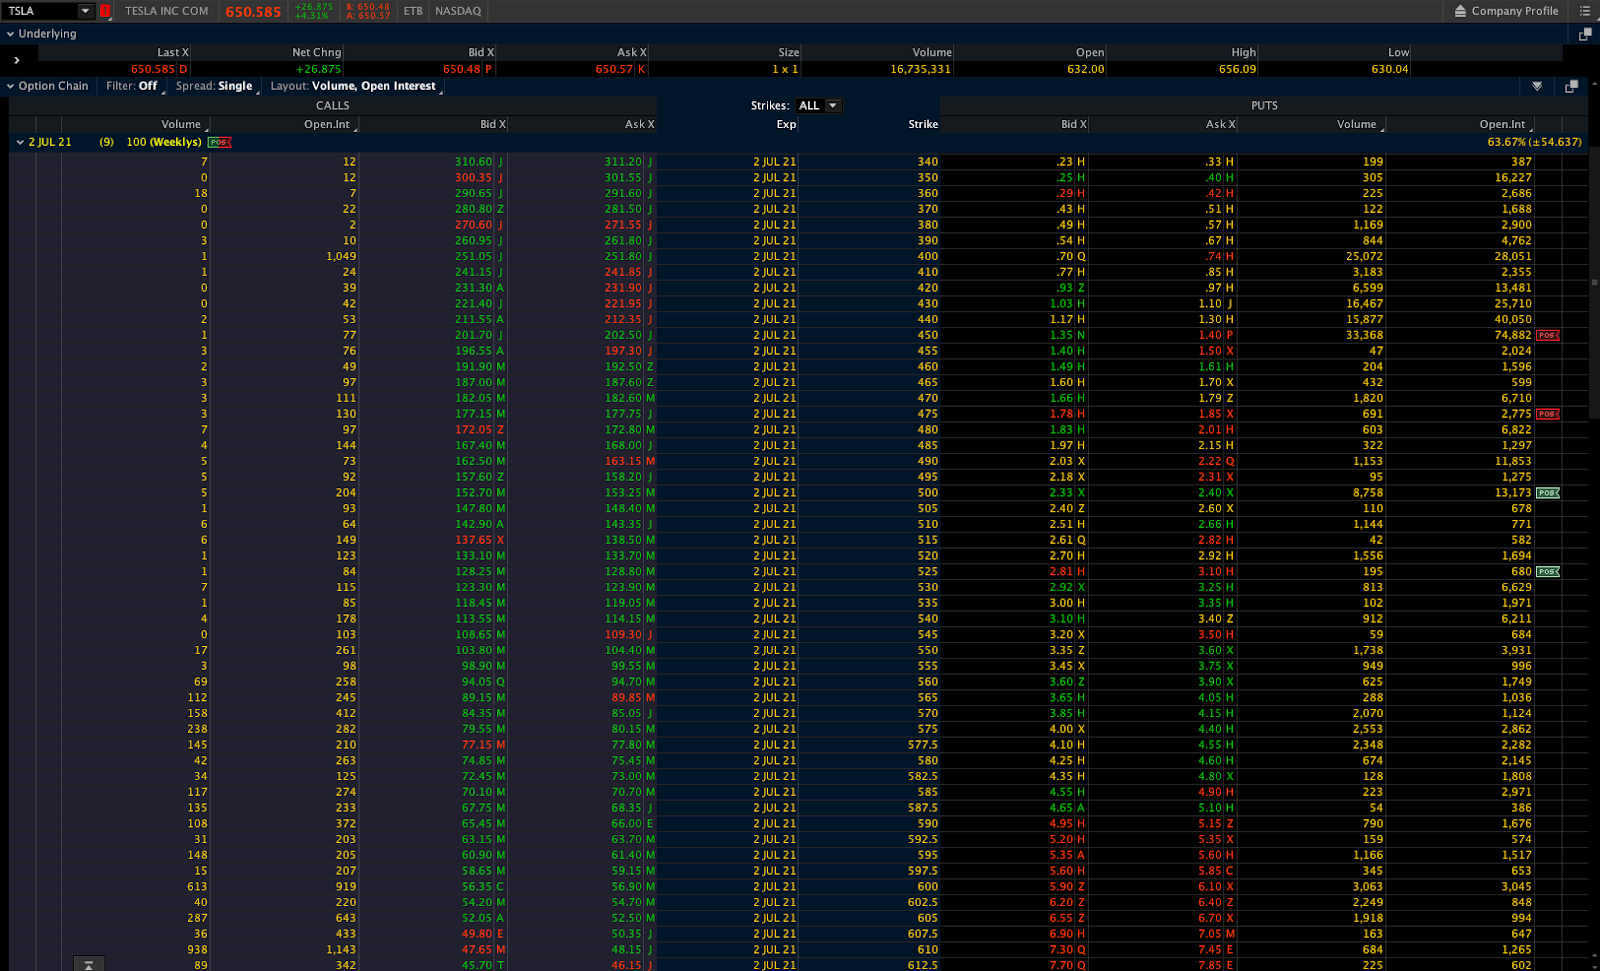
Graphic 2: June 23, 2021 screenshot implies increased demand for put options, further below (left of) the stock price, relative to calls (right) for the expiries traded. Graphic 3: Notice the increased volume and open interest in put option strike prices at and below $500. This dynamic results in skew, as observed in Graphic 2.
Given this dynamic, the following sequence analysis unpacks how Physik Invest traded options tied to the carmaker leading up to, and through, the June 23, 2021 upside consolidation break.
Note: Click here to view all transactions. Adding, positions were structured in a way that would potentially net higher credits had the stock moved markedly lower or higher.
Sequence 1: After skew was observed, through 6/18/2021, the following positions were initiated against the $500 support level for a $1,011.00 credit.
June 11 Expiry 500P+1, 450P-2
June 25 Expiry 490P+9, 440P-18
June 25 Expiry 550P+2, 500P-4
June 25 Expiry 300P+2
By 6/21/2021, all aforementioned positions were closed for a $271.00 debit, netting a $691.58 credit after commissions and fees.
Sequence 2: Through 6/29/2021, skew improved and the following positions were initiated for a $5,651.38 credit.
July 2 Expiry 500P+3, 450P-6
July 2 Expiry 525P+7, 475P-14
July 2 Expiry 545P+1, 495P-2
July 9 Expiry 850C+2, 900C-4
July 9 Expiry 580P+11, 530P-22
July 9 Expiry 350P+3
July 16 Expiry 850C+4, 900C-8
Through 7/12/2021, the above structures were removed for a $90.00 debit, netting a $5,443.93 credit after commissions and fees.
Sequence 3: Through 7/6/2021, skew remained and the following positions were initiated for a $3,566.00 credit.
July 16 Expiry 575P+11, 525P-22
July 16 Expiry 600P+1, 550P-2
July 16 Expiry 350P+3
Through 7/14/2021, the above structures were removed for a $473.00 debit, netting a $3,043.29 credit after commissions and fees.
Summary: In total, the sequence of trades net a $9,178.80 credit after commissions and fees.
The above strategies were employed per Physik Invest’s core edge: the trade of ratioed, multi-leg strategies that combine short and long positions to reduce risk and increase returns.
By leveraging the dynamics of time and volatility, through complex spreads, Physik Invest was paid to express a neutral stance on underlying Tesla stock with the potential to further capitalize on an expansion of range in either direction.
Disclaimer: There is a $0.77 discrepancy between the transaction sheet and the numbers provided in this case study. This is attributable to differences in rounding.
What Happened: On April 29, 2021, market participants attempted to move the Nasdaq 100 stock index from balance, an area of recent price acceptance, above a developing ledge, or flattened area on the composite volume profile.
Further, participants failed to find acceptance beyond the balance area, given the Nasdaq 100’s move back into the prior range. As a result, odds favored (1) sideways or (2) lower trade, as low as the balance area low (BAL) near $13,700.00.
Adding, a weak reaction by heavily-weighted index constituents to blowout earnings, as well as poor structure left behind prior price discovery, among other factors, such as the will to raise the Capital Gains Tax, suggested an increased potential to trade below the $13,700.00 BAL, into prior poor structures, or low volume areas (LVNodes), that ought to offer little-to-no support.
In response, the following sequence analysis unpacks how Physik Invest traded options tied to both the cash-settled Nasdaq 100 (INDEX: NDX) and Nasdaq 100 (CME: /NQ) future, leading up to the May 12, 2021 swing low.
Sequence 1: On April 29, 2021, Physik Invest applied the balance-break and gap scenarios, monitoring for acceptance (i.e., more than 1-hour of trade) outside the balance area.
To preface, gaps ought to fill quickly.

Should they not, that’s a signal of weakness; leaving value behind on a gap-fill or failing to fill a gap (i.e., remaining outside of the prior session’s range) is a go-with indicator.

Auctioning and spending at least 1-hour of trade back in the prior range suggests a lack of conviction.
After a confirmed balance-breakout failure, Physik Invest bought the following structures for a $203.00 debit. At this point, if all legs were to remain out of the money (i.e., expire worthless) by May 21, 2021, the maximum loss would have been $203.00, approximately 1/5 of a standard risk unit, or the debit risked in a typical position.
13500+1/13300-2/13100+1 NDX long put ratio spread
14100+3/14110-6/14140+3 NDX short call ratio spread
14400-1 /NQ short call
By 5/10/2021, the aforementioned position was closed for a $1,855.00 credit, an 813.80% return on the initial debit outlay.
The above put-side structure was initiated against the $13,300 high volume area, also a prior balance area boundary. The reason being, a structurally sound market will build on past areas of high volume. Should the market trend for long periods of time, it will lack sound structure (identified as a low volume area which denotes directional conviction and ought to offer support on any test). If participants were to auction and find acceptance into areas of prior low volume, then future discovery ought to be volatile and quick as participants look to areas of high volume for favorable entry or exit.
Summary: After a failed balance-breakout setup presented itself, Physik Invest financed long put-side structures targeting a test of $13,300, with short-call exposure, risking ⅕ of a standard risk unit in debit, over a timeframe of one month.
In total, the sequence of trades net a $1,621.71 profit after commissions and fees.
The above strategies were employed in accordance with Physik Invest’s core edge: the trade of ratioed, multi-leg strategies that combine short and long positions to reduce risk and increase returns.
Yes, in hindsight, one could have opted for static short exposure (e.g., selling stock to open a position). However, the risks tied to such strategies are immense in a regime characterized by increased volatility and uncertainty.
By leveraging the dynamics of time and volatility, through complex spreads, unwanted directional risks were reduced.
Reflection: Hindsight is 20/20.
Though the entry was perfectly timed, the exit was not; 1-day prior to expiry, the 13500/13300/13100 ratio spread – which was removed for a $21.11 credit – priced at nearly $90.00.
The correct move would have been to initiate the position with up to four 13500/13300/13100 ratio spreads. Thereafter, as prices moved lower, the position would have been pared down enough to at least cover the cost of any remaining spreads.
Those remaining spreads would have been kept on as so-called “lottery tickets.”
Quote Of The Week: “Excessive determinism is almost always the biggest enemy of stability. This seeming contradiction is behind the concept of metastability which captures the mode of market functioning in the last years. Metastability is what seems stable, but is not — a stable waiting for something to happen. [An] avalanche is a good example of metastability to keep in mind — a totally innocuous event can trigger a cataclysmic event (e.g., a skier’s scream, or simply continued snowfall until the snow cover is so massive that its own weight triggers an avalanche).”
What Happened: In light of a v-pattern recovery, after a quick de-risking event, U.S. stock indexes are positioned for further upside, as high as the 100% price projection, which happens to be above $4,000.00, a primary target in the S&P 500.
More On The V-Pattern: A pattern that forms after a market establishes a high, retests some support, and then breaks above said high. In most cases, this pattern portends continuation.
What Does It Mean: This positive price action is happening in the context of bearish undercurrents, as evidenced by non-participatory speculative flows and delta, as well as a divergence in the DIX.
More On Volume Delta: Buying and selling power as calculated by the difference in volume traded at the bid and offer.
More On DIX: For every buyer is a seller (usually a market maker). Using DIX — which is derived from short sales (i.e., liquidity provision on the market making side) — we can measure buying pressure.
More On Speculative Flows: Participants looking to capitalize on either upside or downside through the purchase and sale of options, the right to buy or sell an asset at a later date and agreed upon price.
Adding, according to The Market Ear, similar risk rallies have happened after hedge fund de-grossing events; now, “Equities are rising along higher yields, dollar and [volatility], and the magic word here is discounting inflation.”
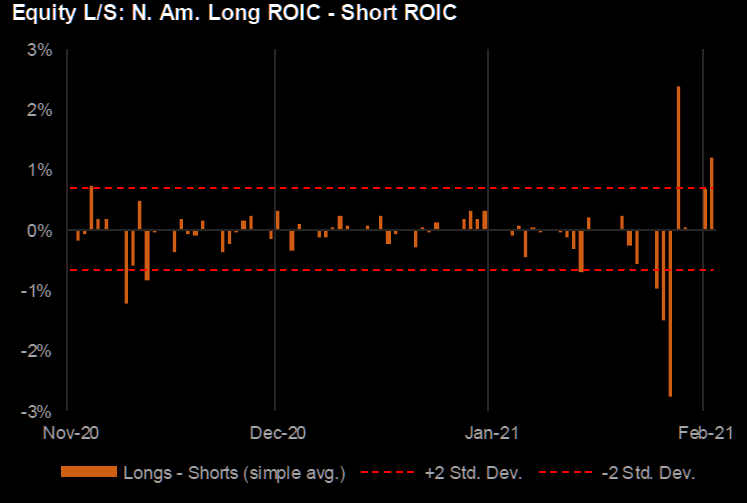
Further, since price pays, participants ought to discount the bearish undercurrents, and position themselves for upside. Hedge funds are doing so, as evidenced by an increase in gross exposures (Graphic 1), alongside other speculative participants that look to capitalize on their opinions through the options market (Graphic 2).
Graphic 1: JPMorgan Chase & Co. (NYSE: JPM) data suggests normalization as “HFs add back to gross exposures.”Graphic 2: Physik Invest maps out the purchase of call and put options in the SPDR S&P 500 ETF Trust, for the week ending February 6, 2021.
Last week, per Graphic 2, the SPDR S&P 500 ETF Trust, the largest ETF that tracks the S&P 500, saw a rise in purchases of short-dated call and put options. Given the tenor (i.e., the length of time remaining before contract expiration), there’s a lack of long-term commitment to direction.
Adding, early and late in the week, the purchase of put options dominated. This suggests participants were either looking to protect against or capitalize on downside. In the middle of the week, participants were looking to protect against or capitalize on upside.
More On Options: If an option buyer was short (long) stock, he or she would buy a call (put) to hedge upside (downside) exposure. Option buyers can also use options as an efficient way to gain directional exposure.
The above, alongside the market’s re-entry into long-gamma (Graphic 3) and a normalization of the VIX futures term structure (see Graphic 4) in which longer-dated VIX expiries are more expensive, suggests the potential for less risk and volatility in equity markets.
More On Gamma: Gamma is the sensitivity of an option to changes in underlying price. Dealers that take the other side of option trades hedge their exposure to risk by buying and selling the underlying.
When dealers are short-gamma, they hedge by buying into strength and selling into weakness. When dealers are long-gamma, they hedge by selling into strength and buying into weakness. The former exacerbates volatility. The latter calms volatility.
Graphic 3: SpotGamma suggests S&P 500 at or above “Long-Gamma” juncture. Graphic 4: VIX Futures Term Structure per vixcentral.com.
What To Expect: U.S. stock indexes are best positioned for further balance or upside discovery.
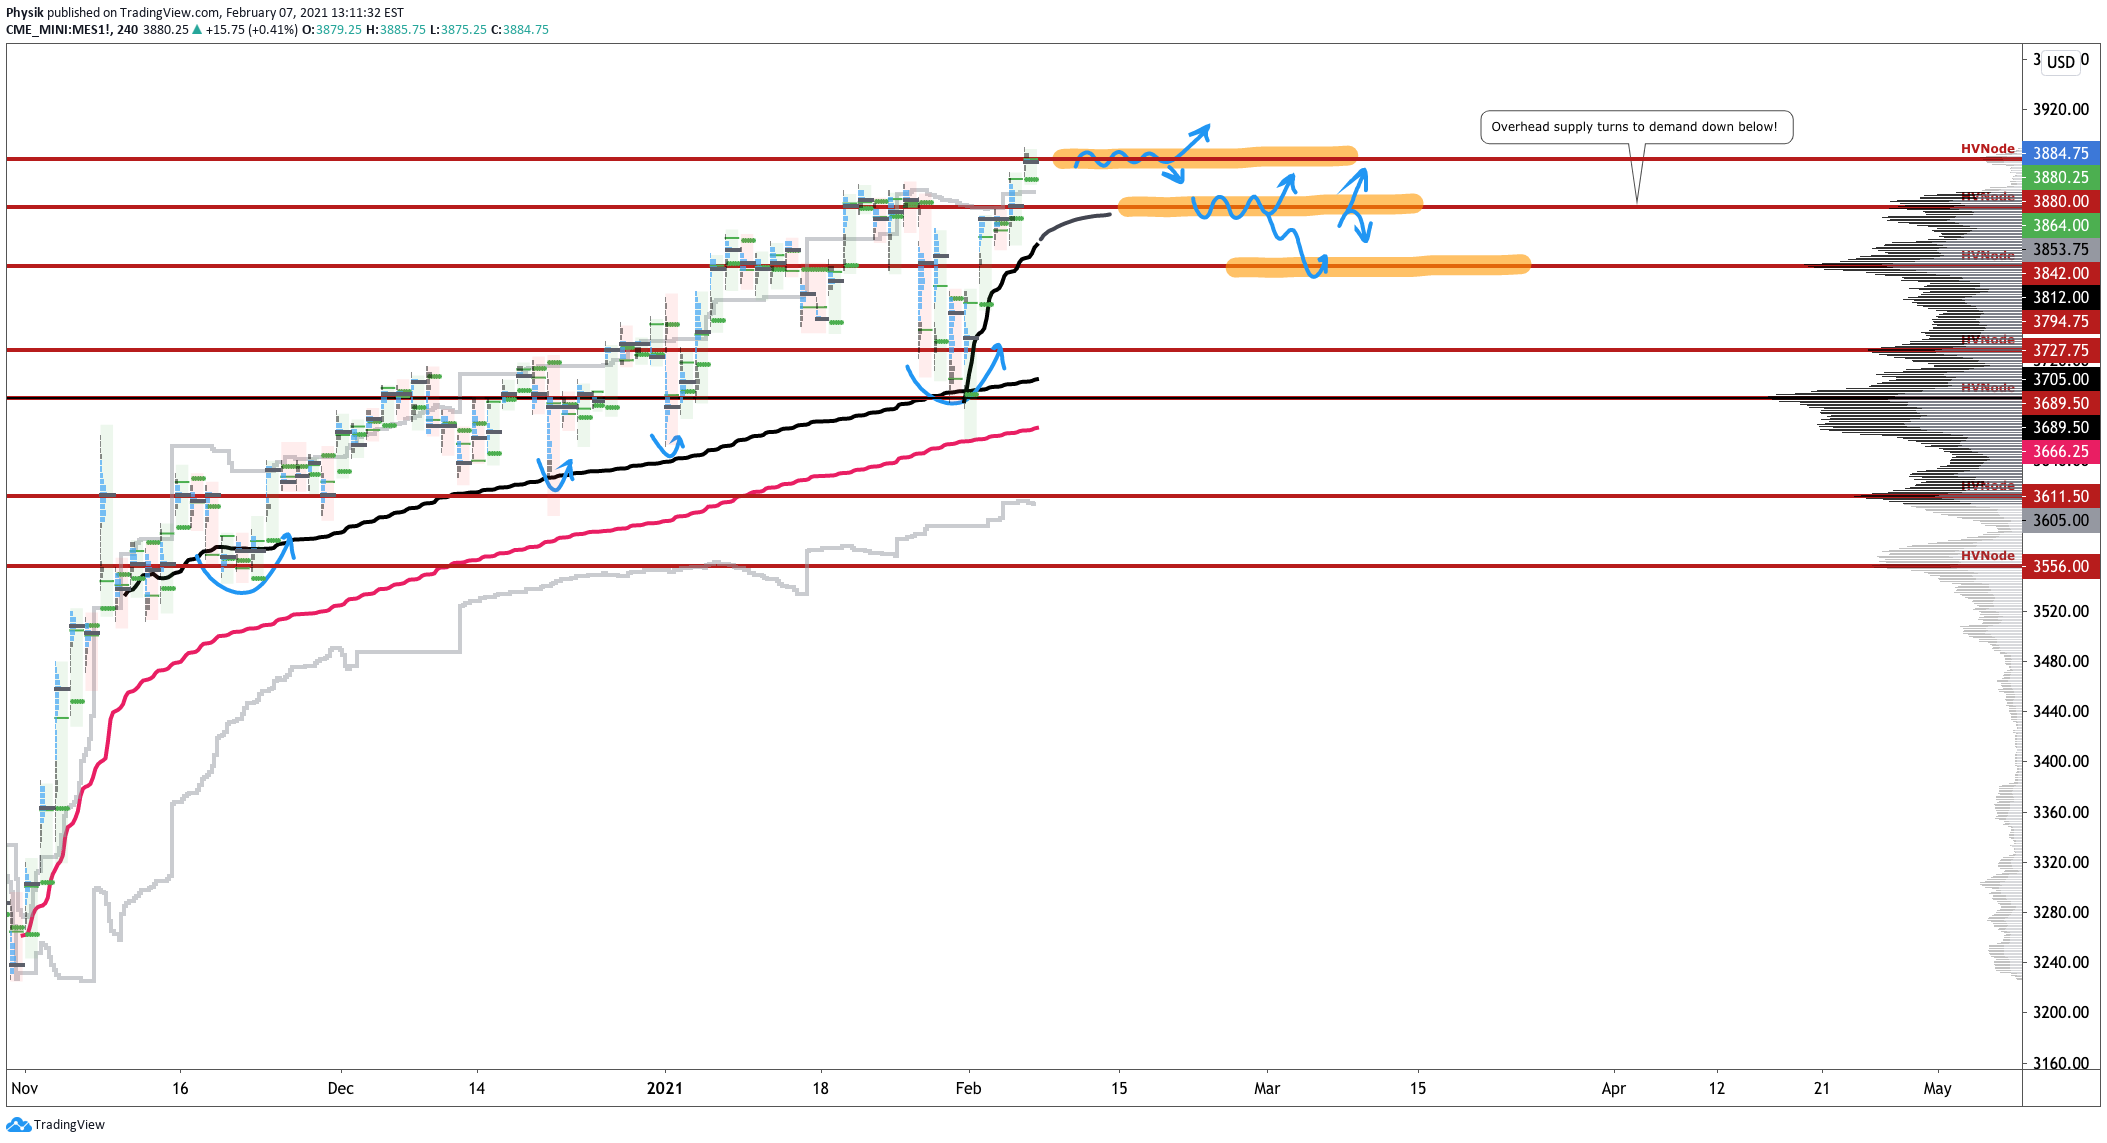
Graphic 5: 4-hour profile chart of the Micro E-mini S&P 500 Futures.
In Graphic 5, the highlighted zones denote high-volume areas (HVNodes), or valuable areas to transact.
More On Volume Areas: A structurally sound market will build on past areas of high-volume. Should the market trend for long periods of time, it will lack sound structure (identified as a low-volume area which denotes directional conviction and ought to offer support on any test).
If participants were to auction and find acceptance into areas of prior low-volume, then future discovery ought to be volatile and quick as participants look to areas of high-volume for favorable entry or exit.
Last Monday, participants found acceptance in prior low-volume. Thereafter, discovery was volatile and quick as participants looked to areas of high-volume for favorable entry and exit (e.g., where the market spent the majority of its time Tuesday through Thursday).
On Friday, the S&P 500 left the HVNode near $3,840.00. As stated, HVNodes can be thought of as building blocks — they also denote areas of supply and demand. In this case, $3,840.00 can now be thought of as an area of demand. The primary strategy is to respond to probes into these supply (i.e., selling responsively) and demand (i.e., buying responsively) areas as they offer favorable entry and exit.
What To Do: Participants will want to pay attention to last Thursday’s $3,855.00 Virgin Point Of Control, or VPOC (i.e., the fairest price to do business in a prior session), and end-of-day spike, as well as the $3,840.00 HVNode.
More On POCs: POCs (like HVNodes described above) are valuable as they denote areas where two-sided trade was most prevalent. Participants will respond to future tests of value as they offer favorable entry and exit.
More On Spikes: Spike’s mark the beginning of a break from value. Spikes higher (lower) are validated by trade at or above (below) the spike base (i.e., the origin of the spike).
Given the above references, the following frameworks ought to be applied.
In the best case, the S&P 500 does some backfilling to repair aforementioned poor structures. In such a case, participants would look for responsive buying to surface at or above the $3,840.00 HVNode.
In the worst case, any break that finds increased involvement (i.e., supportive flows and delta) below the $3,840.00 HVNode, would favor continuation as low as the $3,794.75 and $3,727.75 HVNodes.
Note that the $3,727.75 HVNode corresponds with the $372 SPY put concentration, which may serve as a near-term target, or bottom, for a sell-off.
Graphic 6: Profile overlays on a 15-minute candlestick chart of the Micro E-mini S&P 500 Futures.
Conclusions: Simplicity is key here.
Participants ought to look for favorable areas to transact, such as those high-volume areas in the S&P 500 featured in Graphic 5.
What Happened: On November 17, 2020, shares of Tesla Inc (NASDAQ: TSLA) surged on news that S&P Dow Jones Indices would include the stock in the S&P 500, the most liquid index in the world.
Since markets are most influenced by credit and positioning, news of the inclusion was impactful. Funds tied to the S&P 500 would purchase Tesla shares from a dealer by the addition date. This means that dealers would look to purchase shares of the stock heading into the event, to later supply funds at the close of Friday, December 18, the last session before the inclusion.
In the simplest of terms, the event was a positive since it meant that (1) speculative derivatives activity and associated hedging, (2) short-term traders, as well as (3) dealers and index funds would now support the stock.
The following sequence analysis unpacks how Physik Invest traded equity and derivatives tied to the carmaker’s stock leading up to the December 21, 2020 index inclusion.
Sequence 1: On news of the inclusion, market participants initiated shares of Tesla out of balance, beyond trend resistance. Thereafter, in accordance with a typical give and go scenario, the stock faded, filling 50% of the low-volume area left after the initial move higher, before aggressive buying resurfaced to continue the new trend.
Through November 19, the following positions were added for a $61.00 debit, in total. At this point if all legs were to remain out of the money (i.e., expire worthless) by November 20, the maximum loss would be $61.00, approximately 1/10 of a standard risk unit, or the capital risked in a typical position.
500+1/530-2 call ratio spread
490+2/505-3 call ratio spread
525+1/550-2 call ratio spread
510+1/525-2 call ratio spread
445-1 put
460-1 put
By November 20, all aforementioned positions were closed for an $827.00 credit, a 1,255.74% return on initial investment.
All the above call-side structures were initiated against the $500 high open interest strike. Reason being, option expiries mark an end to pinning (i.e, the theory that market makers and institutions short options move stocks to the point where the greatest dollar value of contracts will expire worthless) and the reduction dealer gamma exposure.
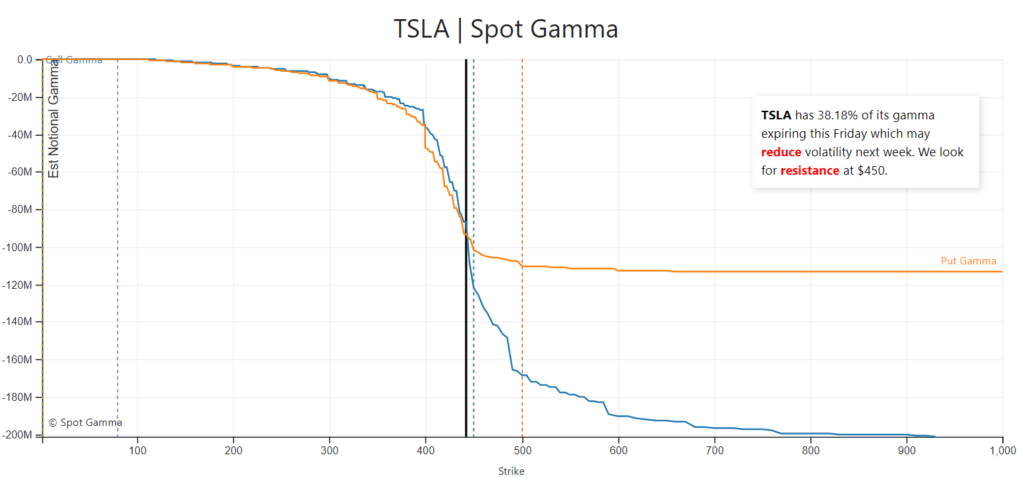
On November 20, nearly 40% of Tesla’s gamma was to roll off.
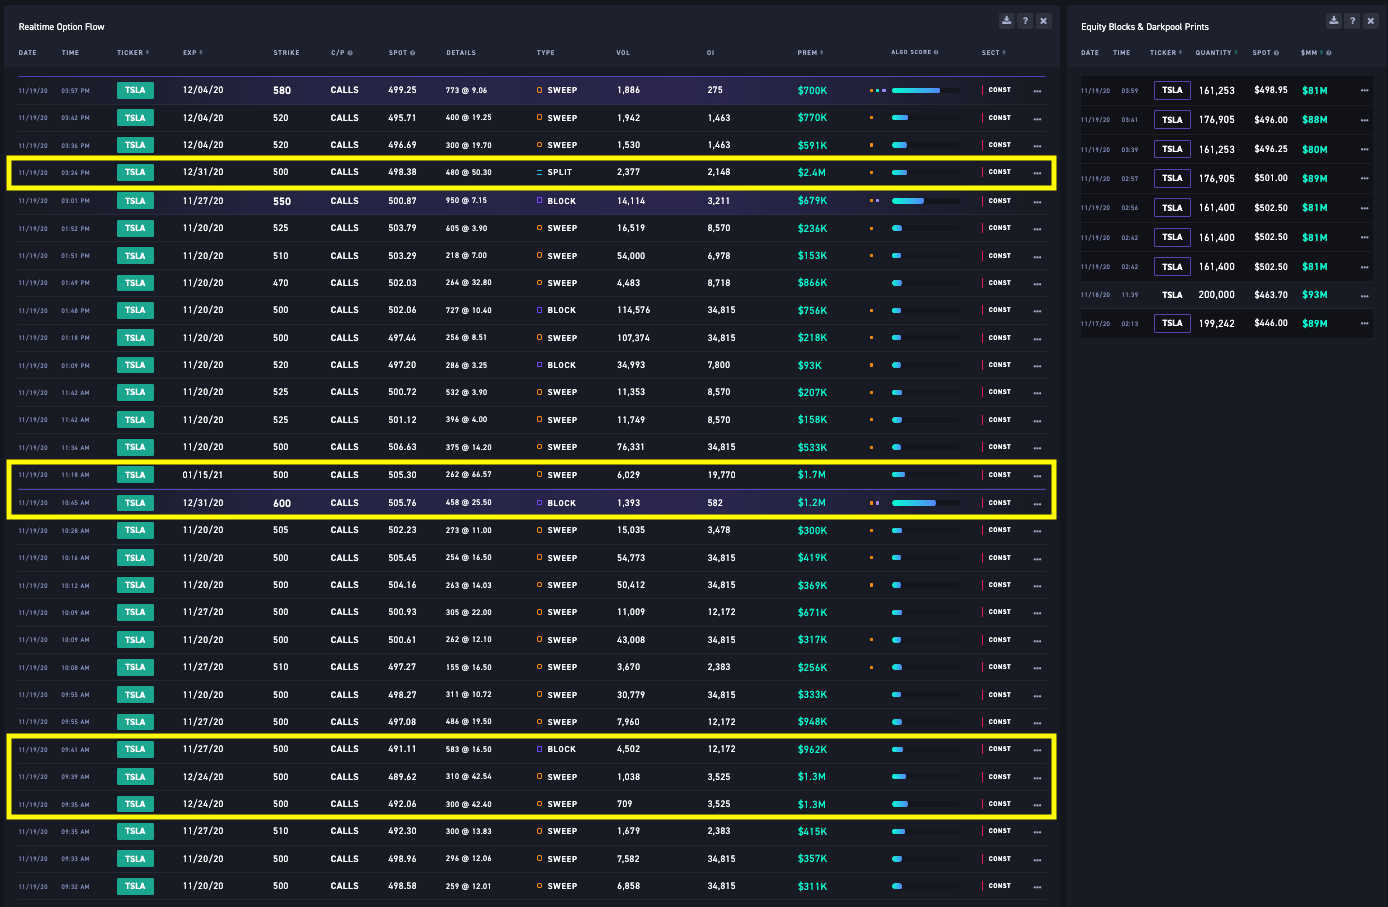
Pictured: November options gamma by Spot GammaPictured: Speculative call-side options activity after the index inclusion announcement
Moreover, since derivatives exposure was rolled into farther dated expiries, the stock would now be supported by dealers buying to hedge their derivatives exposure and facilitate the index inclusion.
Noting, at a simplistic level, prices often encounter resistance at prior highs due to the supply of old business. These areas take time to resolve. Breaking and establishing value (i.e., trading more than 15-minutes above this level) portends continuation.
Sequence 2: On November 20, the following structures expiring on December 4 were initiated for a $644.00 credit.
450-1 put
520+1/550-1 call ratio spread
570+1/600-2 call ratio spread
490-1/475+1 put ratio spread
Through November 24, the above structures were removed for a $876.00 credit.
Sequence 3: On November 24, the cost basis from November 19 ($61.00 debit) was reduced via an intraday long stock delta hedge that bought 10 shares at an average of $539.50.
The initial cost basis, after this particular trade, was brought down to a $0.20 debit.
Sequence 4: On November 25 the following positions were opened and closed the same day for a $179.30 credit.
Bought stock at $550.14 average
480+1/500-2 call ratio spread
Sequence 5: On November 27, the following positions were initiated and closed by December 3 for a $117.10 debit.
Bought stock at $595.55 average
475+1/437.5-2 put ratio spread
Sequence 6: On December 1 through December 3, the following positions were initiated, and then exited from by December 7 for a $1.77 debit.
Bought stock at $589.20 average
Bought stock at $563.77 average
740+1/780C-2 call ratio spread
Sequence 7: Through December 17, the following positions were initiated and closed for a total $452.30 credit.
720+1/820-2 call ratio spread
740+1/830-2 call ratio spread
Bought stock at $632.17 average
720+1/820-2 call ratio spread
Bought stock at $606.88 average
800+1/860-2 call ratio spread
500+1/480-2 put ratio spread
Sequence 8: From December 17 through December 23 the following positions were entered and exited from for a $322.00 credit.
500+2/450-4 put ratio spread
800+2/850-4 call ratio spread
670+1/685-2 call ratio spread
Summary: In total, the above sequence of trades net a $3,098.29 credit after commissions and fees.
The strategies employed were in accordance with Physik Invest’s methodology: the trade of ratioed, multi-leg strategies that combine short and long positions to reduce risk and increase returns.
Yes, in hindsight, one could have opted for something as simple as risk-reversals (e.g., buying calls and selling puts). However, the risks tied to such strategies are immense. By leveraging the dynamics of time and volatility, through complex spreads, risk was reduced.
Note: There were many times, during these sequences, that positions were structured in a way that would net no loss had the security moved sideways or lower into expiry.
Adding, per Fibonacci principles, one core aspect of Physik Invest’s market structure analysis, an upside target of $675.10 was established early on in the process. Tesla spent the majority of its December 18 session at this level.
Disclaimer: There is a $0.11 discrepancy between the transaction sheet and numbers provided in this case study. This is attributable to differences in rounding.
Insurance is a means of protecting against the risk of financial loss.
Regarding financial markets, products exist to reduce risk or express opinions more efficiently. One such product is an option, a derivative that acts like an insurance contract.
Options are the right to buy or sell an asset at a later date and agreed upon price.
Option buyers purchase put and call options to speculate on the direction or insure against loss.
If the option buyer were short stock, he or she would buy a call to hedge upside exposure.
If the option buyer were long stock, he or she would buy a put to hedge downside exposure.
The counterparty in this transaction writes options in exchange for a premium derived from factors such as the spot and strike price, time to maturity, volatility, and interest rate.
In some sense, option buyers pay sellers to cover their losses past a certain level and time.
Nothing is free. When selling options, similar to insurance, returns are obtained through the calculation of expected probabilities and attempts at writing overpriced contracts. Volatility, the magnitude of potential change, is a key input in pricing formulas.
Volatility, a derivative of fear, compels option demand.
When the demand for an option rises, volatility and option premia rise with it. Demand for an option does not necessarily mean an underlying security will move. It just means that fear has compelled a market to increase its demand for protection.
As is true for most other aspects of life, fear is blown out of proportion, and hence, this is what happens in the derivatives market: fear often overstates the magnitude of potential change.
So, when purchasing protection, one must be correct in their direction, time, and volatility assumption to make money on an option. When selling, one must hedge against the risks associated with direction and volatility, among other things.
An option seller must not necessarily be directional to make money. Instead, they can leverage the dynamics of time and volatility to gain more efficient (i.e., lower risk and/or cost) exposure.
In light of these market dynamics, Physik Invest harnesses the trade of ratioed, multi-leg structures, which combine short and long options positions to better express its edge, often reducing risk and improving returns. Though direction is frequently a factor in positions netting a positive return, it is not a requisite.
About Physik Invest
Physik Invest provides actionable insights into credit and positioning, the economy and geopolitics, as well as trade theory and structuring. Founded by Renato Leonard Capelj in 2020, the business began as a personal portfolio for him to share his methods, research, and market performance. After establishing the appropriate business structures, Physik Invest may expand its services to include paid research, consulting, and trading solutions.
As a disclaimer, Physik Invest and Capelj are not in the business of providing advice. They won’t solicit the public for capital or collect fees. Accordingly, their comments should not be construed as recommendations.