
The daily brief is a free glimpse into the prevailing fundamental and technical drivers of U.S. equity market products. Join the 990+ that read this report daily, below!
Fundamental
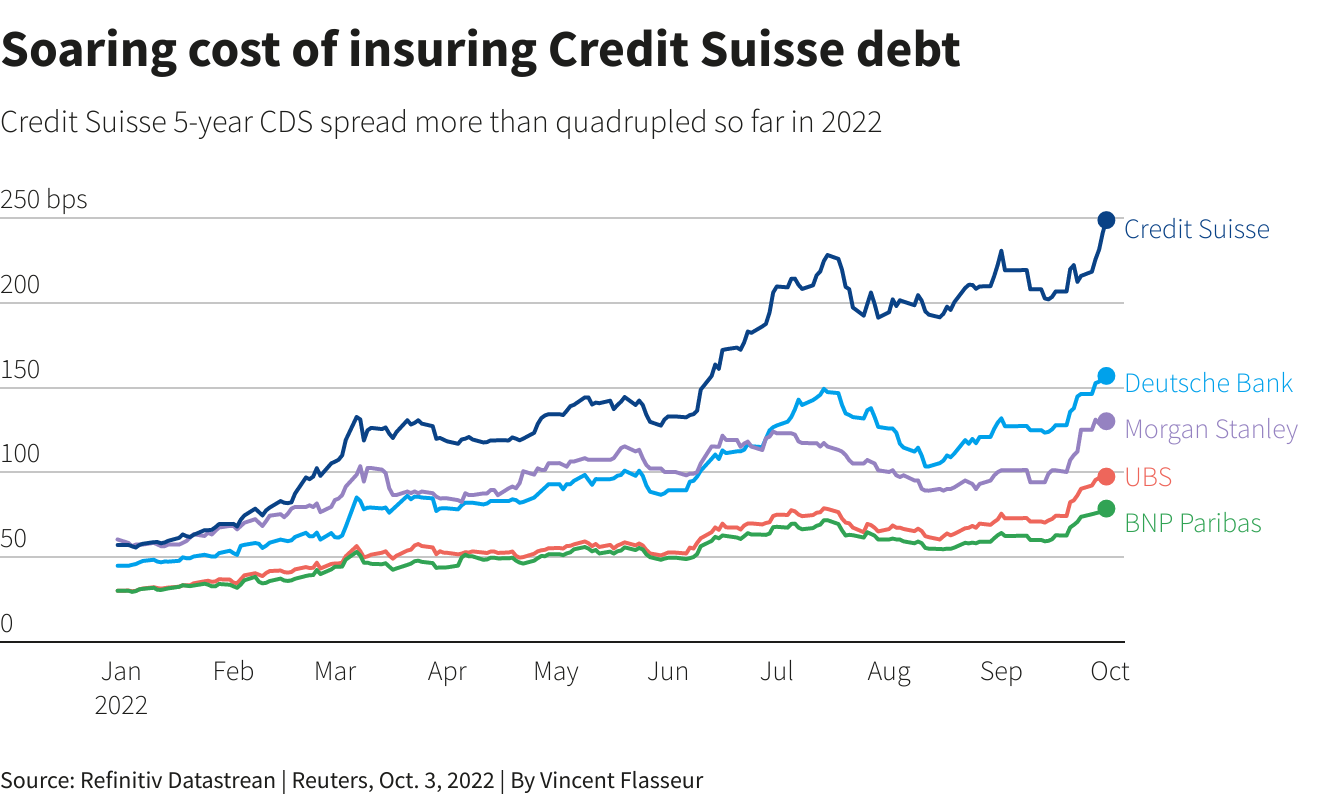
Fresh and top of mind, still, is the Credit Suisse Group AG (NYSE: CS) debacle. However, despite the bank’s “critical moment,” as discussed in yesterday’s letter, credit default swap (CDS) levels, though still rising, are “far from distressed.”
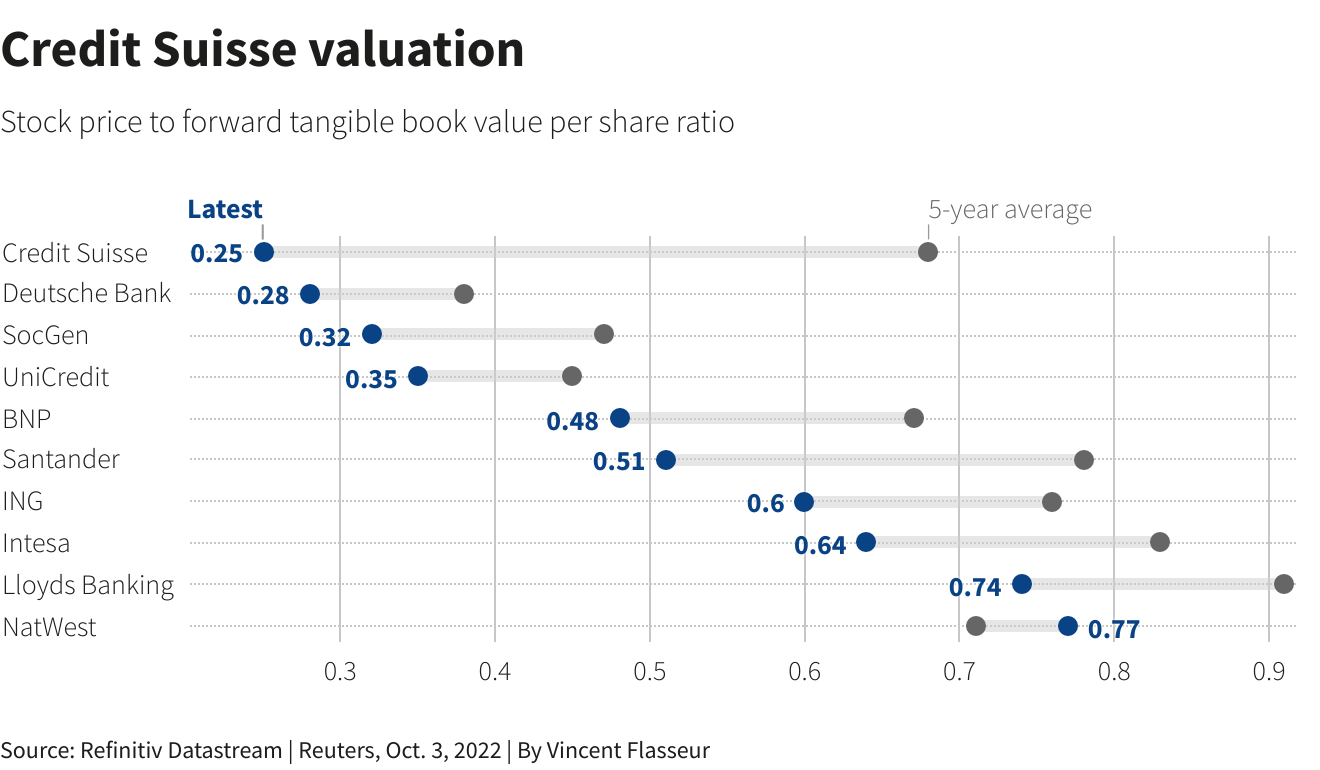
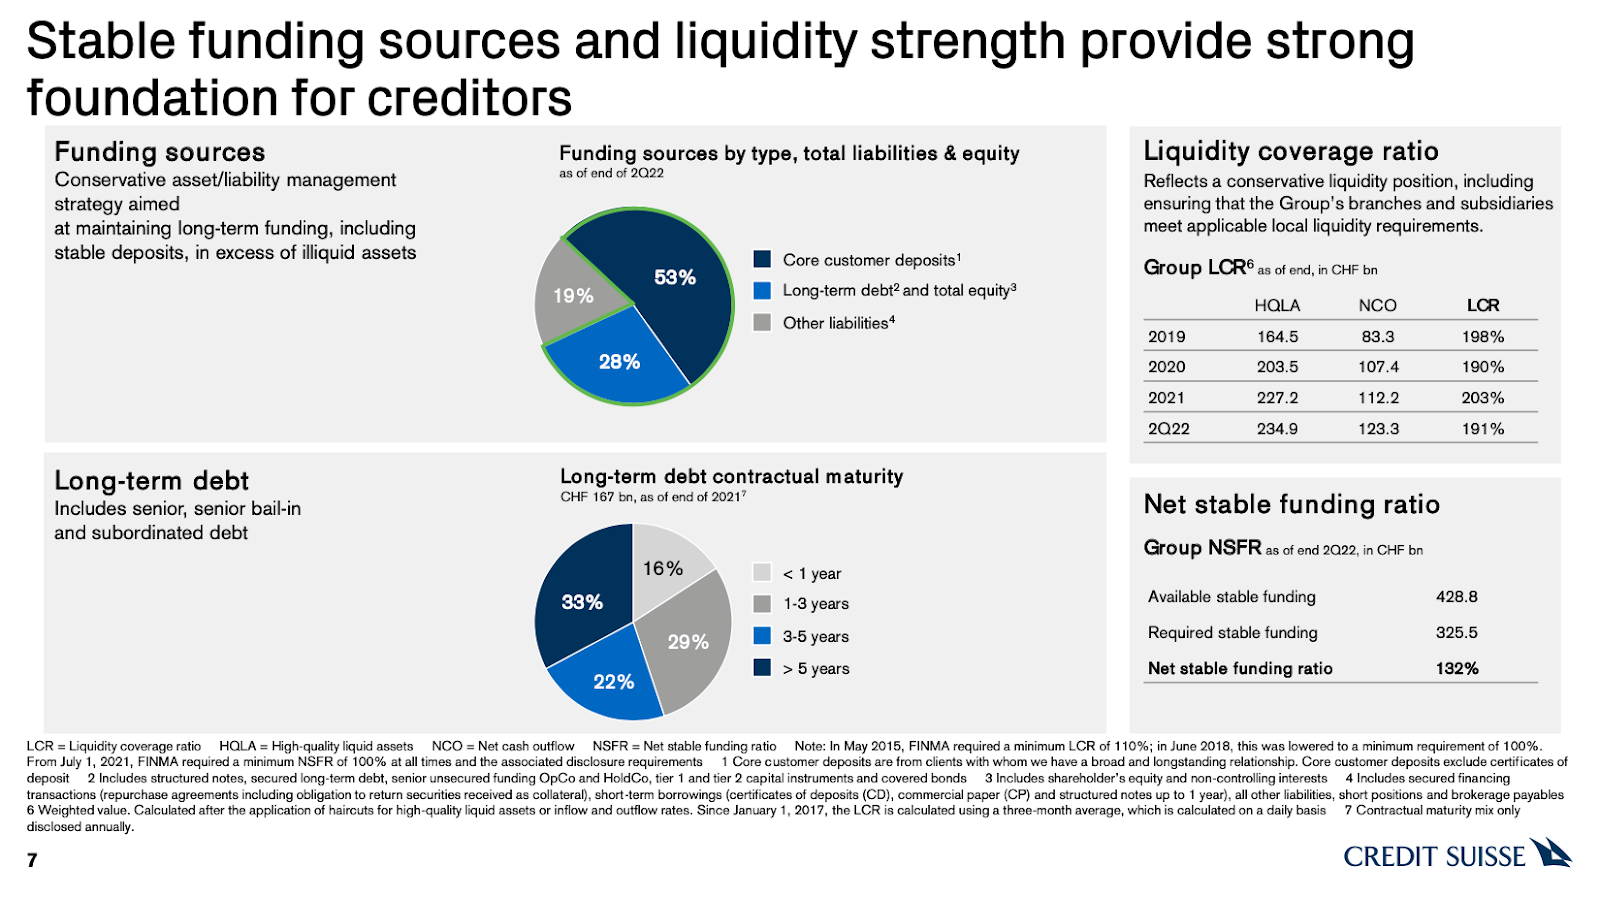
Adding, not reflected by the stock is a “strong capital base and liquidity position,” per CS.
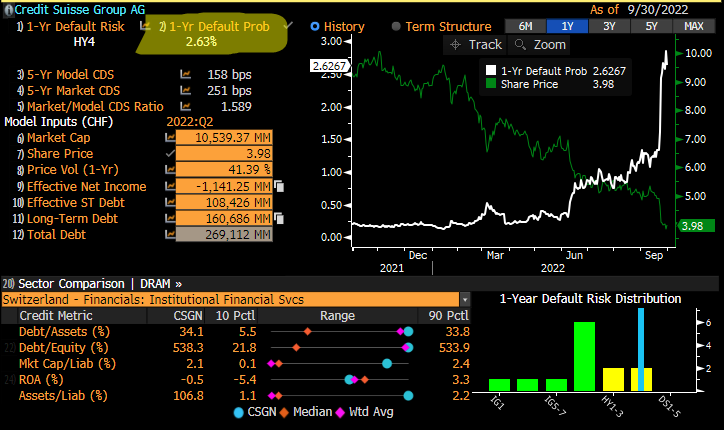
A big topic speculated on was CS’ probability of default. At its core, CDS spreads relate to the probability of default in the following way, per Deutsche Bank AG (NYSE: DB) research:
(CDS Spread) / (1 – Recovery Rate) = Implied Probability Of Default.
The recovery rate is basically the (estimated) amount of a loan that will be repaid in the case of a bankruptcy or default. Per European Central Bank research, “the standard recovery rate used by the industry in price calculations is 40%.”
Roughly speaking, below is a quick calculation:
250 basis points / (1 – 0.40) = 416.67 basis points = 4.17% Implied Probability Of Default
In CS’ case, if the spread is 250 basis points, assuming a 40% recovery, that’s a 4.17% default probability implied. If the spread was at 150 basis points, then, assuming a 40% recovery, that’s a 2.5% chance of default.
Taken together, in short, similar to as we put forth, yesterday, “[t]his is not 2008,” per Citigroup Inc’s (NYSE: C) Andrew Coombs. Bloomberg adds that Morgan Stanley (NYSE: MS) faced its own credit spread debacle during 2011 European debt exposure rumors; “it took months for the price of the default swaps to fall as the feared losses never materialized.”
Ahead of an October 27 CS review covering topics including “a large-scale investment banking retreat, … [i]nvestors are worried about how much the bank will [have to] cover” a restructuring.
Bloomberg adds: “A sale of Credit Suisse’s structured-products group, which trades securitized debt, has attracted interest from potential buyers, … [amid] rising interest rates.”
Per UBS Group AG (NYSE: UBS) research, a sale of such businesses, which may be worth more than the market is currently implying, “could help to avoid a dilutive capital increase.”
Positioning
“Month-end portfolio rebalances and [the] expiration of quarterly option strategies [acted] in support of the market,” JPMorgan Chase & Co’s (NYSE: JPM) Marko Kolanovic stated in a September 30, 2022 commentary titled “Throwing rocks in glass houses.”
In that same commentary, Kolanovic eased support for his 2022 price targets on economic volatility led by central banks, the war in Europe, and beyond.
As stated last week, per Kai Volatility’s Cem Karsan, it’s the case that the removal of options strategies and potential supply of protection (as investors further come to the realization that options protection has done little to protect against downside) may provide markets a boost.
Ultimately, though, a final resolution would be “tied to the incremental effects on liquidity,” (e.g., QT manifesting itself as “$4.5 billion less in demand for assets per day,” and buyback blackout) while options repositioning may make the case for increased fragility, as traders’ falling demand for put protection opens the door to less supportive hedging flows with respect to time (Charm) and volatility (Vanna) changes.
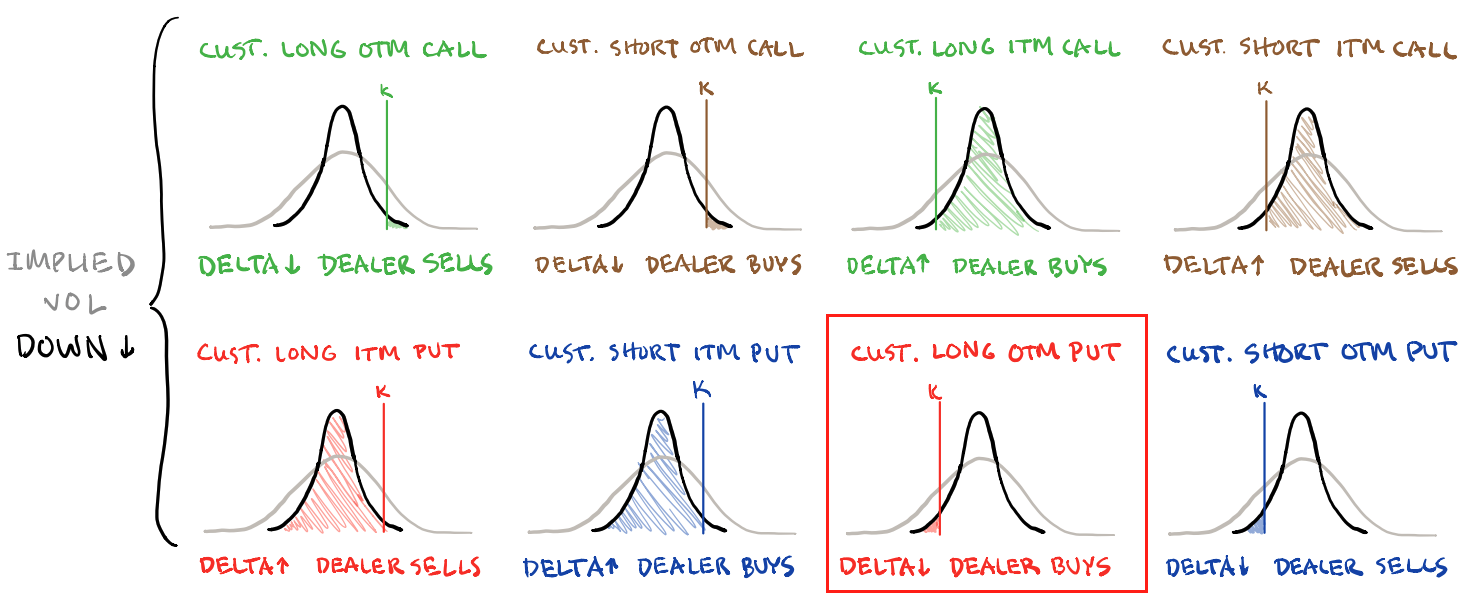
Therefore, trades such as the Short Ratio Put Spread, particularly if narrower, may be far riskier to employ into the end of this year and the middle half of next year. For context, this was a trade to have on this year.
As participants continue to make the aforementioned realizations and supply to the market put (downside protection), tails may “continue to be cheap,” and discount “crash risk,” according to The Ambrus Group’s Kris Sidial.
A lot more to resolve this jumbled mess of a newsletter in the coming days.
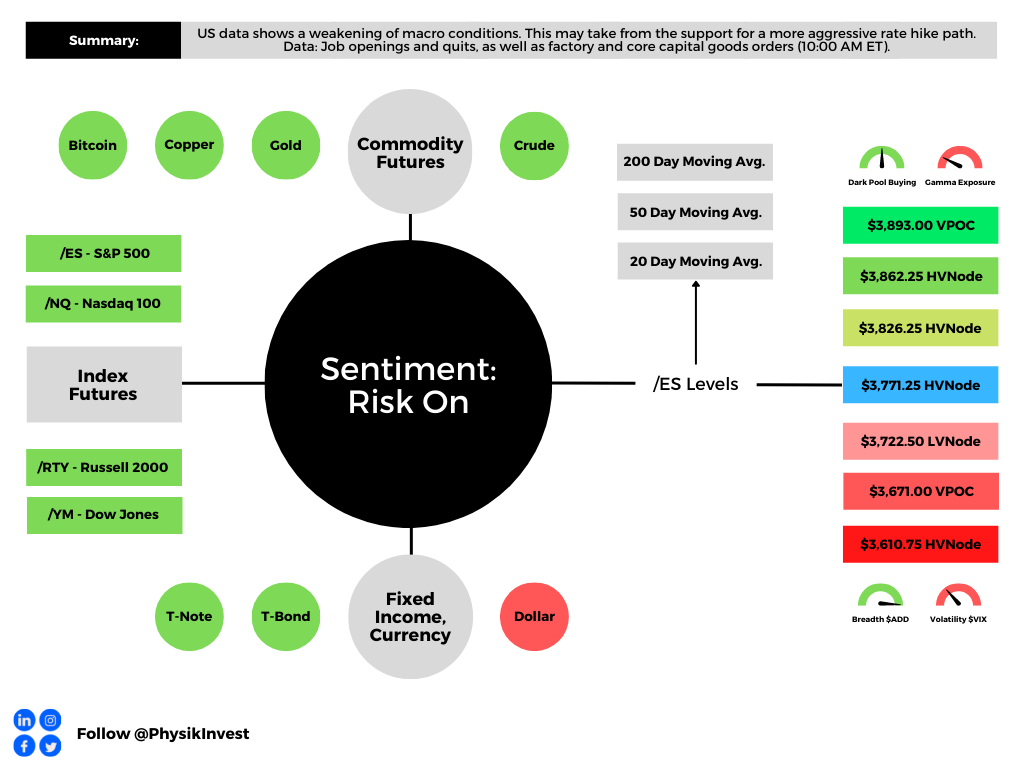
Technical
As of 9:10 AM ET, Tuesday’s regular session (9:30 AM – 4:00 PM ET), in the S&P 500, is likely to open in the upper part of a positively skewed overnight inventory, outside of prior-range and -value, suggesting a potential for immediate directional opportunity.
In the best case, the S&P 500 trades higher.
Any activity above the $3,771.25 HVNode puts into play the $3,826.25 HVNode. Initiative trade beyond the last-mentioned could reach as high as the $3,862.25 HVNode and $3,893.00 VPOC, or higher.
In the worst case, the S&P 500 trades lower.
Any activity below the $3,771.25 HVNode puts into play the $3,722.50 LVNode. Initiative trade beyond the LVNode could reach as low as the $3,671.00 VPOC and $3,610.75 HVNode, or lower.
Click here to load today’s key levels into the web-based TradingView charting platform. Note that all levels are derived using the 65-minute timeframe. New links are produced, daily.

Definitions
Volume Areas: A structurally sound market will build on areas of high volume (HVNodes). Should the market trend for long periods of time, it will lack sound structure, identified as low volume areas (LVNodes). LVNodes denote directional conviction and ought to offer support on any test.
If participants were to auction and find acceptance into areas of prior low volume (LVNodes), then future discovery ought to be volatile and quick as participants look to HVNodes for favorable entry or exit.
POCs: POCs are valuable as they denote areas where two-sided trade was most prevalent in a prior day session. Participants will respond to future tests of value as they offer favorable entry and exit.
Vanna: The rate at which the delta of an option changes with respect to volatility.
Charm: The rate at which the delta of an option changes with respect to time.
About
After years of self-education, strategy development, mentorship, and trial-and-error, Renato Leonard Capelj began trading full-time and founded Physik Invest to detail his methods, research, and performance in the markets.
Capelj also develops insights around impactful options market dynamics at SpotGamma and is a Benzinga reporter.
Some of his works include conversations with ARK Invest’s Catherine Wood, investors Kevin O’Leary and John Chambers, FTX’s Sam Bankman-Fried, ex-Bridgewater Associate Andy Constan, Kai Volatility’s Cem Karsan, The Ambrus Group’s Kris Sidial, among many others.
Disclaimer
In no way should the materials herein be construed as advice. Derivatives carry a substantial risk of loss. All content is for informational purposes only.


One reply on “Daily Brief For October 4, 2022”
[…] some of the cracks that have appeared including the Credit Suisse Group AG (NYSE: CS) debacle covered in October, the UK liability-driven investment funds covered in September, interest rate […]