Photo: By Alan Stoddard. Taken on January 11,2018.
Hey, all! I hope you had a great weekend. Today, we dive into what’s driving markets and what the near future may look like. On Monday, we will do deeper dives like this. Friday, we’ll try for recaps. Trade ideas are coming soon via monthly research, which will look similar to this linked document.
Market momentum slowed with bumps in economic and inflation data last week, yet the trend of economic resilience and declining inflation persists. Anticipation looms over a potential shift in the Federal Reserve’s approach, with traders awaiting Tuesday for insights from Governor Christopher Waller regarding the possibility of a decrease in interest rates.
CrossBorder Capital remarks the economy may avoid recession, attributing this to economic measures adjusted for distortion—an increase in adjusted yields points to a mild recovery in business activity later in the year.
Graphic: Retrieved from CrossBorder Capital. Based on the mortgage curve, they calculate a 10-year Treasury yield 110 basis points higher. A steeper curve implies easier monetary conditions.
Former open markets trader Joseph Wang maintains cautious optimism, foreseeing cuts, albeit less aggressive than the market prices. However, Cem Karsan from Kai Volatility suggests that if anticipated stock struggles and declines reach 10% or more, more decisive, politically motivated actions may be taken ahead of the election.
Graphic: Retrieved from Bloomberg via Joseph Wang. The SOFR term structure provides insights into the market’s expectations for short-term interest rates over various time horizons.
In any case, injecting money into a healthy economy is bullish. That being so, Goldman Sachs foresees the S&P 500 reaching 4,950 to 5,050 by 2025. Wang, emphasizing the potential benefits of both monetary and fiscal stimulus, notes deficit spending ultimately triggers an increase in both yields and risk assets like stocks.
Cryptocurrencies may also benefit, with some anticipating the approval of a bitcoin exchange-traded fund to invigorate a bullish trend akin to the impact of State Street’s Gold Trust on the gold market. However, not all share this optimism, including Tom McClellan, who parallels a situation in 1974 when investors bid up gold prices in anticipation of Americans regaining the right to own gold, only to witness a decline of 41% in prices by August 1976.
Whether higher rates persist or not, specific forces are at play that are unlikely to destabilize the market markedly. Elevated rates give rise to an increased demand for what is termed “one-sided and risky positioning,” elongating the market cycle and reducing short-term volatility through mechanical interventions. This artificial stability sends misleading signals, fostering even more interest in this type of trading. Karsan aptly dubs it the “sumomarket,” echoing Amy Wu Silverman of RBC Capital Markets’ insight that such strategies aren’t indefinite and may sour.
We hedge when we can, not when we must! Traditional reliance on bonds falls short in a landscape where correlations have transformed. During the subdued realized and implied volatility, traders protect against pullbacks, particularly during or after the earnings season, by buying Cboe VIX call options.
In the realm of alternatives, the choice depends on your timeframe and view on price trajectories. We gave explanations last year, revealing options like allocating principal to less risky assets such as box spreads utilized as collateral for margin-intensive trades. For those eyeing the short-term downside, ultra-wide butterflies—equidistant or slightly broken—emerge as a consideration. Contrastingly, if it were 2022, cheaper ratio spreads would be preferred due to the subdued tendencies of implied volatility. However, with “over-positioning into short volatility,” that may no longer be the case.
The daily brief is a free glimpse into the prevailing fundamental and technical drivers of U.S. equity market products. Join the 900+ that read this report daily, below!
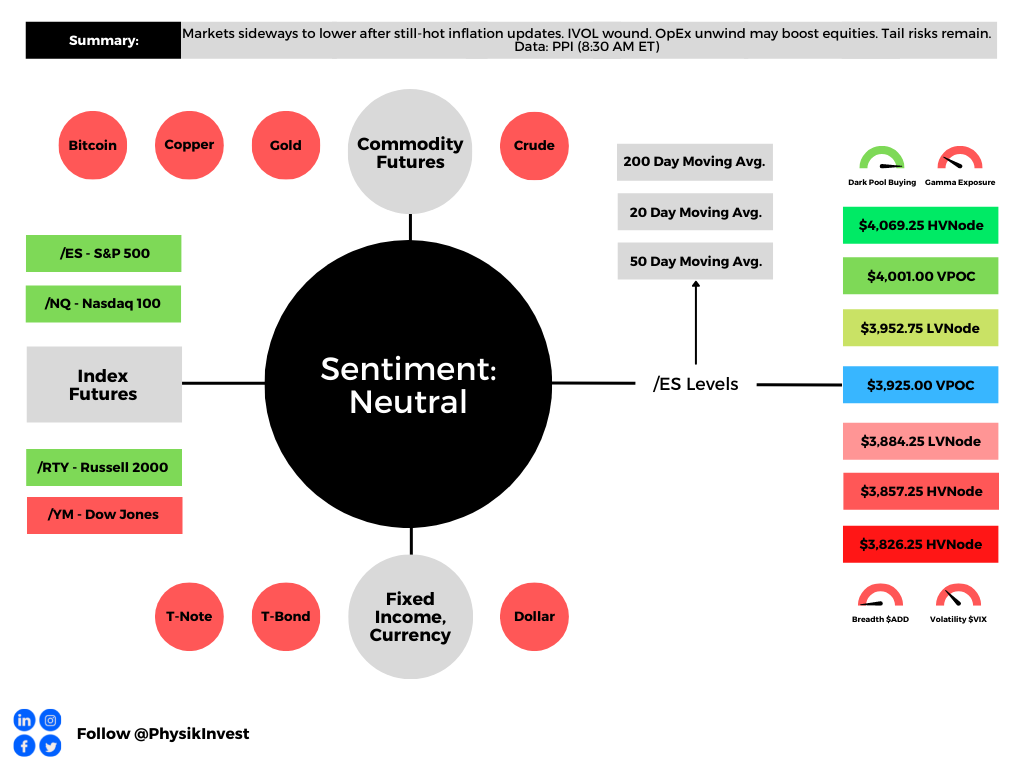
Graphic updated 8:00 AM ET. Sentiment Neutral if expected /ES open is inside the prior day’s range. /ES levels are derived from the profile graphic at the bottom of the following section. Levels may have changed since initially quoted; click here for the latest levels. SqueezeMetrics Dark Pool Index (DIX) and Gamma (GEX) calculations are based on where the prior day’s reading falls with respect to the MAX and MIN of all occurrences available. A higher DIX is bullish. At the same time, the lower the GEX, the more (expected) volatility. Learn the implications of volatility, direction, and moneyness. Breadth reflects a reading of the prior day’s NYSE Advance/Decline indicator. VIX reflects a current reading of the CBOE Volatility Index (INDEX: VIX) from 0-100.
Fundamental
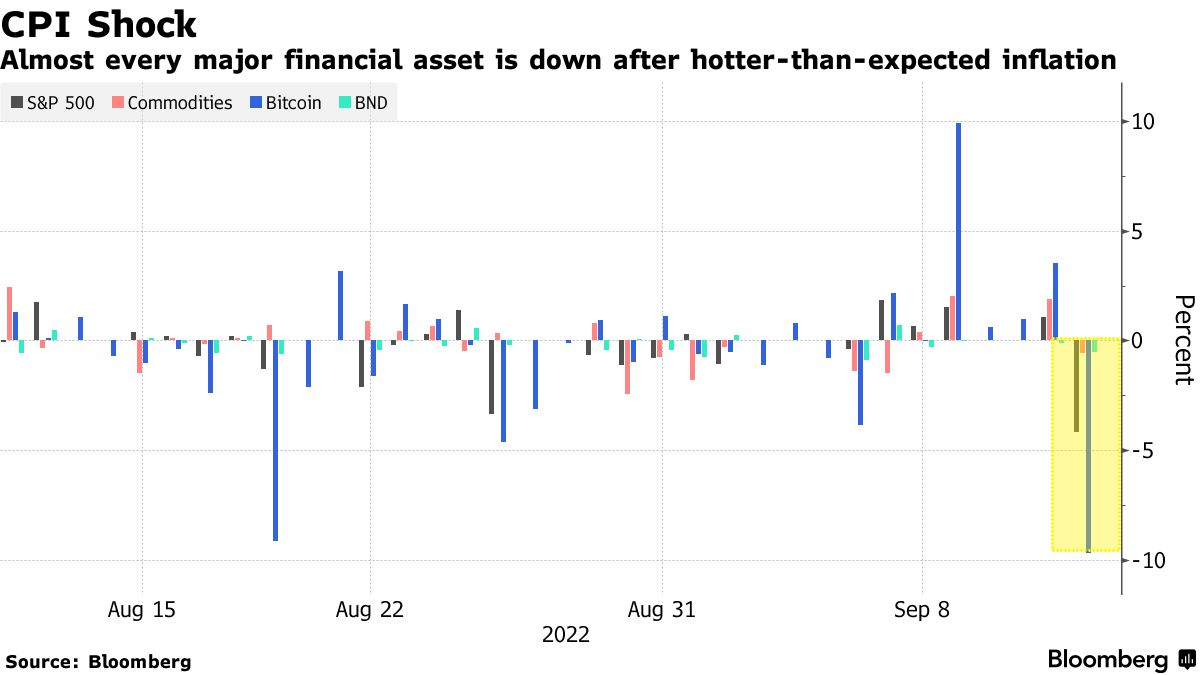
A sell-off spurred by a higher-than-expected Consumer Price Index (CPI) hit nearly all assets.
Expected was an 8.1% rise year-over-year (YoY) and a 0.1% fall month-over-month (MoM). Core CPI (excludes food and energy) was to rise by 6.1% YoY and 0.3% MoM, respectively.
Officially, the headline number rose to 8.3%. The core CPI rose 6.3% YoY and 0.6% MoM, meaning the March peak remains (6.5% YoY, then).
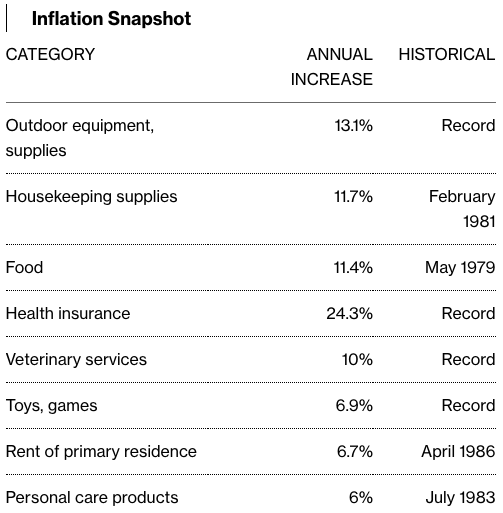
It’s the case, essentially, that “[a]ll measures came in above forecasts. Shelter, food and medical care were among the largest contributors to price growth,” per Bloomberg.
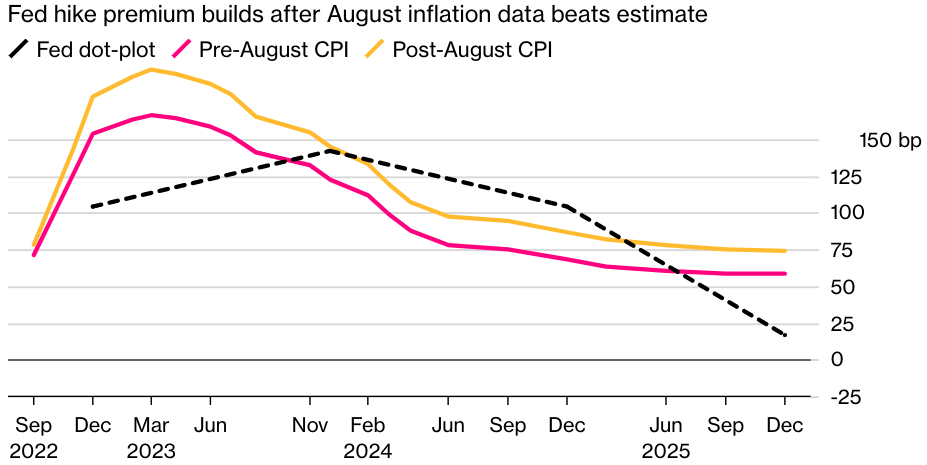
The data, which “illustrates a strong labor market and weakening consumer spending,” in total, bolsters the case for interest rates to rise by “three-quarters of a percentage point.”
Bloomberg’s Anna Wong and Andrew Husby add: “[W]ages have now become the top driver of inflation. With Fed officials already highly concerned about a potential wage-price spiral, the central bank is likely to keep hiking in the first half of 2023.”
The selling hit growth and technology, hard. These areas are far more responsive to changes in rates as there is promise embedded in their stock prices, too. When rates rise, prices are hit as the value of future earnings looks far less attractive versus higher-yielding or less-risky assets.
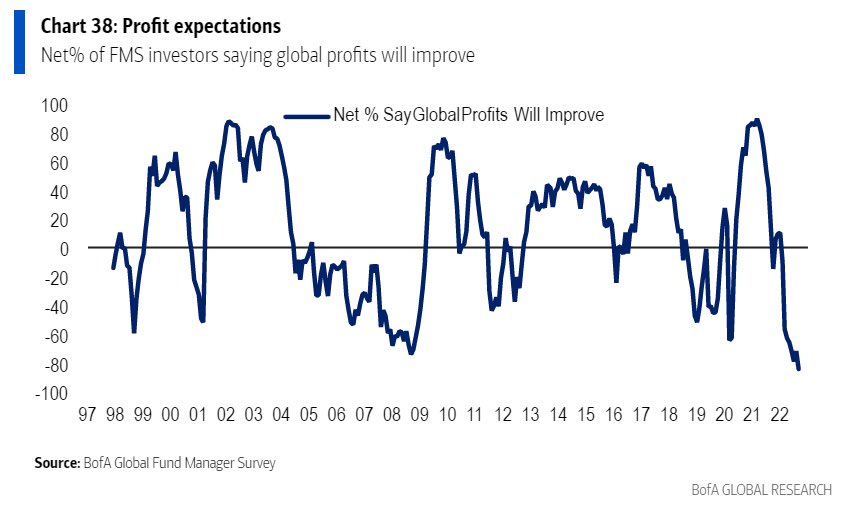
“Multiple compression will continue as long as we have sticky inflation,” said Marija Veitmane of State Street Corp (NYSE: STT). “Profits will crater. We still see a lot of downside on equities.”
Beyond risk assets, rising interest rates increase the cost of financing leaving households with less money to spend (or more hesitant to spend money), and this leads a decline in demand. Accordingly, business profits and economic growth may decline, too.
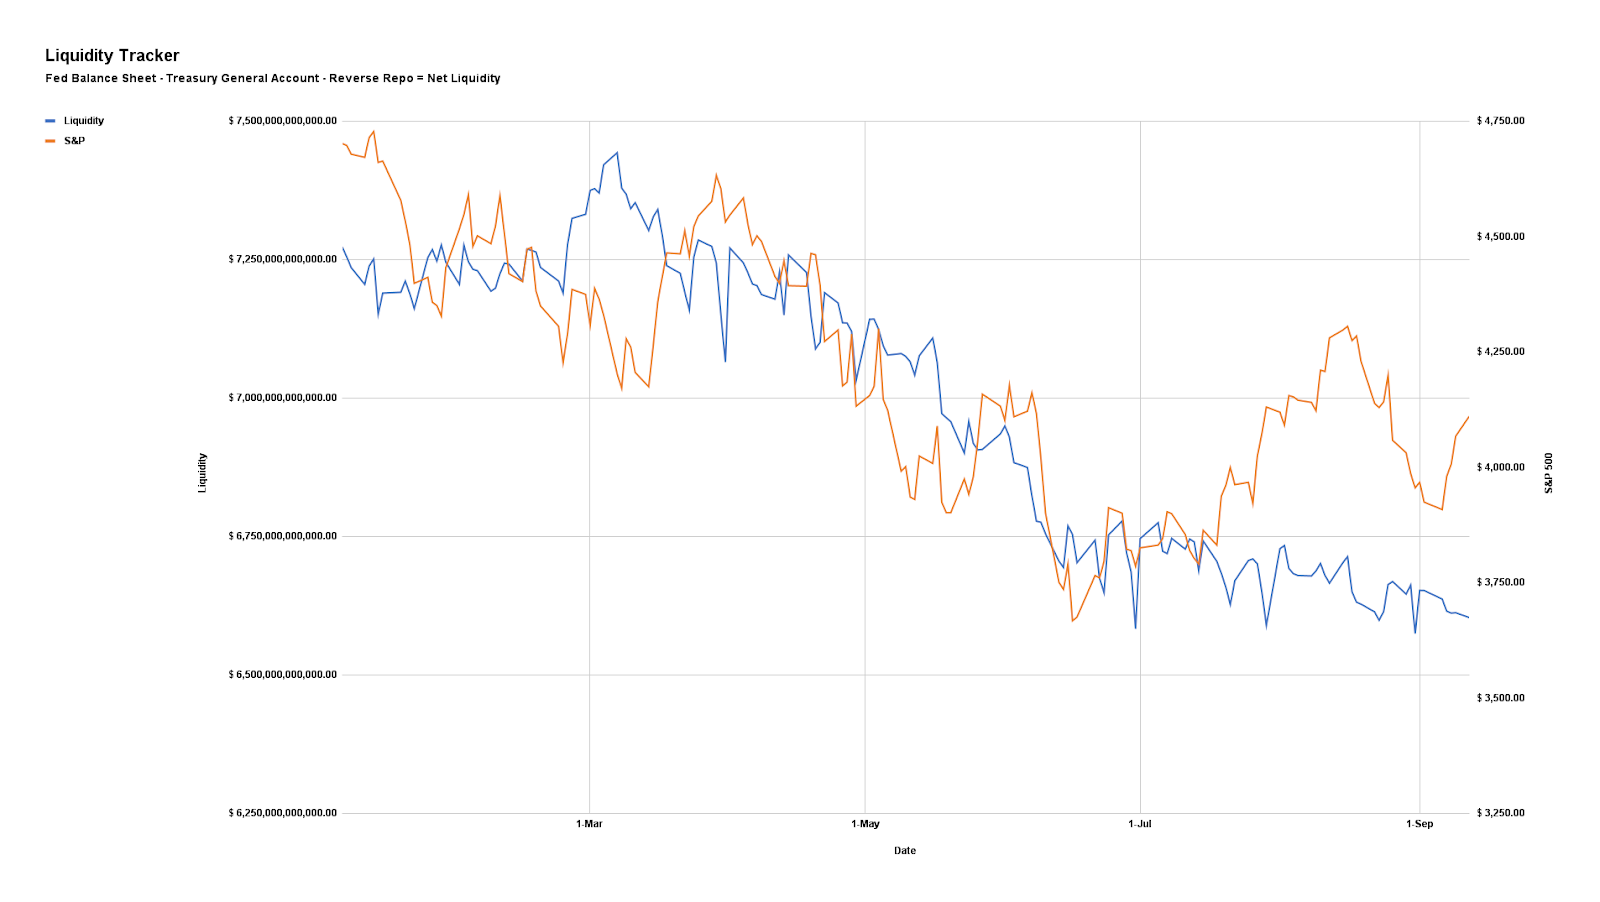
A conversation between Joseph Wang and Andy Constan, which we shall unpack in coming letters, deserves a listen. At its core, financial markets sold, primarily, on the “flow” of liquidity this year. Read the coming letters for more.
Graphic: Via Physik Invest. Data compiled by @jkonopas623. Fed Balance Sheet data, here. Treasury General Account Data, here. Reverse Repo data, here. NL = BS – TGA – RRP.
Positioning
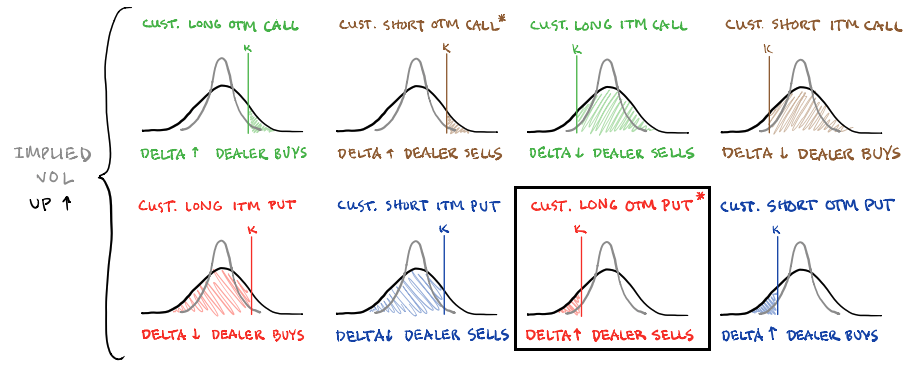
Traders sought shorter-dated equity put (downside) protection, in size, heading into Tuesday’s decline. Prior to the market open, Tuesday, we said that some “‘massive hedging activity’ feels ‘unsettling’” given what the “reaction to that protection entails should markets drop lower and [implied volatility] increase, accordingly.”
Graphic: Retrieved from SqueezeMetrics. Learn the implications of volatility, direction, and moneyness.
From thereon, options were repriced as markets sold and IVOL increased.
As I well put in a SpotGamma note last night, “it’s the case that [out-of-the-money] options went from having very little Delta (exposure to direction) to a lot more Delta. If we maintain the assumption that liquidity providers are short those puts, a positive delta trade, then those liquidity providers sold futures and stock, a negative Delta trade.”
In short, options out of the money are highly sensitive to changes in direction and IVOL, which there was a lot of, yesterday. Those options quickly went from having little value to a lot of value. If you’re short that exposure, and don’t want to lose money, you have to sell something, and the latter is what compounded the selling.
From hereon, as we said, a lot of the exposure demanded is short-dated. Should that exposure not be rolled forward in time, and allowed to expire, “SPX/ES dealers [who] are well hedged,” will unwind their hedges which may drive bullishness “through OpEx (options expiration),” says Kai Volatility Cem Karsan.
Notwithstanding, this “has [the] potential to drive a tail post” OpEx. In [the] tech/meme market melt-up of 2020-2021, positioning was [the] exact opposite.”
Technical
As of 8:10 AM ET, Wednesday’s regular session (9:30 AM – 4:00 PM ET), in the S&P 500, is likely to open in the lower part of a balanced overnight inventory, inside of prior-range and -value, suggesting a limited potential for immediate directional opportunity.
In the best case, the S&P 500 trades higher.
Any activity above the $3,952.00 VPOC puts into play the $3,952.75 LVNode. Initiative trade beyond the LVNode could reach as high as the $4,001.00 VPOC and $4,069.25 HVNode, or higher.
In the worst case, the S&P 500 trades lower.
Any activity below the $3,952.00 VPOC puts into play the $3,884.25 LVNode. Initiative trade beyond the LVNode could reach as low as the $3,857.25 and $3,826.25 HVNode, or lower.
Click here to load today’s key levels into the web-based TradingView charting platform. Note that all levels are derived using the 65-minute timeframe. New links are produced, daily.
Graphic: 65-minute profile chart of the Micro E-mini S&P 500 Futures.
Definitions
Volume Areas: A structurally sound market will build on areas of high volume (HVNodes). Should the market trend for long periods of time, it will lack sound structure, identified as low volume areas (LVNodes). LVNodes denote directional conviction and ought to offer support on any test.
If participants were to auction and find acceptance into areas of prior low volume (LVNodes), then future discovery ought to be volatile and quick as participants look to HVNodes for favorable entry or exit.
POCs: POCs are valuable as they denote areas where two-sided trade was most prevalent in a prior day session. Participants will respond to future tests of value as they offer favorable entry and exit.
MCPOCs: POCs are valuable as they denote areas where two-sided trade was most prevalent over numerous day sessions. Participants will respond to future tests of value as they offer favorable entry and exit.
About
After years of self-education, strategy development, mentorship, and trial-and-error, Renato Leonard Capelj began trading full-time and founded Physik Invest to detail his methods, research, and performance in the markets.
Capelj also develops insights around impactful options market dynamics at SpotGamma and is a Benzinga reporter.
In no way should the materials herein be construed as advice. Derivatives carry a substantial risk of loss. All content is for informational purposes only.