
What Happened
Overnight, equity index futures auctioned sideways to higher, recovering much of yesterday’s fast-paced liquidation.
To note, overnight price changes aside, the Nasdaq 100 is trading weak, in comparison to the S&P 500, a dynamic most noticeable in underlying breadth metrics, and the like.
Ahead, there are no material economic releases.
What To Expect
Coming into Tuesday’s session, participants knew that the S&P 500 had already undergone somewhat of a lackluster liquidation, Tuesday.
Those behind some of the downside velocity we saw were most likely short-term, momentum-driven participants who had poor location (i.e., those that respond to probes at visual references and lack the wherewithal to withstand major changes in tone).
To note, given the context – weak intraday breadth and market liquidity metrics bolstering an expansion of range below the volume-weighted average price (VWAP) anchored from the Federal Open Market Committee (FOMC) announcement, last week – the poor structure intact from the advance in past weeks remains a concern.
Context: Yesterday, I talked in-depth on the implications of high leverage and risk by short-term speculators’ record call buying and put selling.
To recap, so long as implied volatility remained bid (and stock prices continued rising) – the result of inadequate liquidity – counterparties to highly speculative trades exacerbated upside volatility in their efforts to hedge.
As implied volatility backed off, counterparties supplied an increasing amount of their underlying hedges, calming the pace of upside price discovery.
When the high-flying stocks (like Tesla, which is a large S&P 500 index constituent) finally made the turn, the bulk of customers’ short puts (long calls) quickly rose (declined) in value, trading in-the-money (out-of-the-money).
Due in part to short-term speculators lacking the wherewithal to stay in their margin-intensive positions, as the price fell, put buying (covering of shorts, too) took liquidity and destabilized the market.

According to SpotGamma, the exuberance of the past weeks fed into the S&P complex, itself, evidenced by a lack of interest in put options at lower strikes. In other words, the S&P 500 options strike with the largest negative gamma – delta sensitivity to underlying price – failed to roll higher, while the strike of the option with the largest positive gamma did.
With implied volatility declining into the S&P’s price rise, last week (a dynamic that, at least in recent history, leads into increased call selling, more dealer hedging, and liquidity, as well as further realized volatility suppression), associated hedging at those strikes pressured prices.
The upside was resisted and we pinned.
Coming into this week, however, CBOE Volatility Index (INDEX: VIX) was higher, with demand coming in across the front area of the VIX futures term structure. This suggested a demand for hedges and a reduction in the flows (e.g., vanna) that support sideways to higher trade.
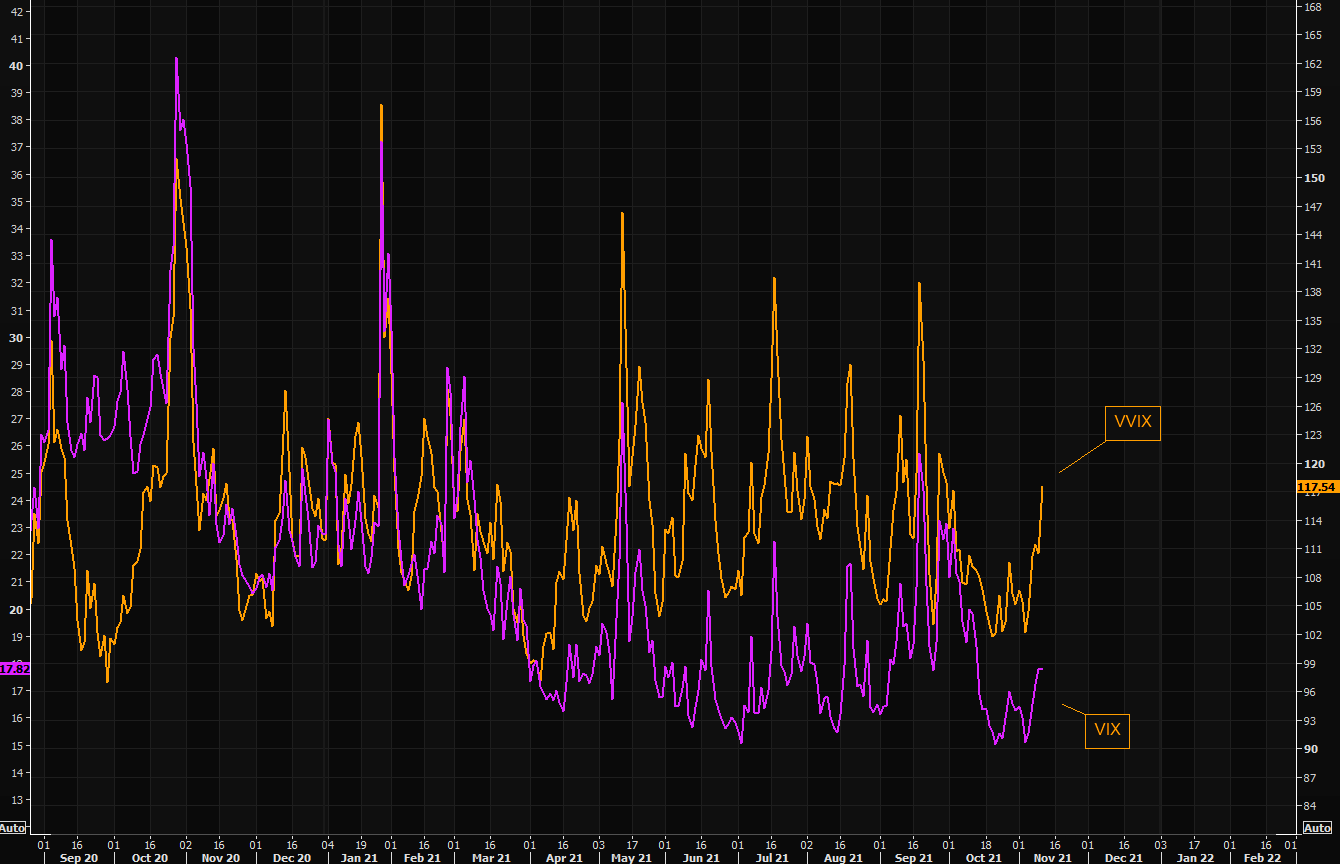
The implications of customers now covering their levered, long-delta exposure and demanding out-of-the-money hedges has the effect of forcing counterparties to hedge in a manner that exacerbates underlying price movement to the downside.
This was the concern. This is what we’re starting to see.
Typically, the period leading up to the monthly options expiration (OPEX) is weak (at least in recent times) and so this trend of lower price and higher intraday volatility may persist up until that event clears counterparties’ gamma exposure and frees the market to move, more.
That’s when fundamental context likely plays a more important role.
According to a Barclays (NYSE: BCS) note featured by The Market Ear, earnings are a tailwind.
“Amid a potentially higher macro volatility regime, we expect earnings to remain a tailwind for equities in ’22. Given our economists’ forecast of above-trend GDP growth of 4.5%, our base case gives 14% EPS growth for Europe, vs. the IBES estimate of 7%. Sticky supply bottlenecks are a threat, but margins typically expanded when global growth was above 3%, while ULCs should remain low. With comps less easy now, sector contributions to EPS growth should be more balanced between Cyclicals and Defensives, but still higher for the former.”
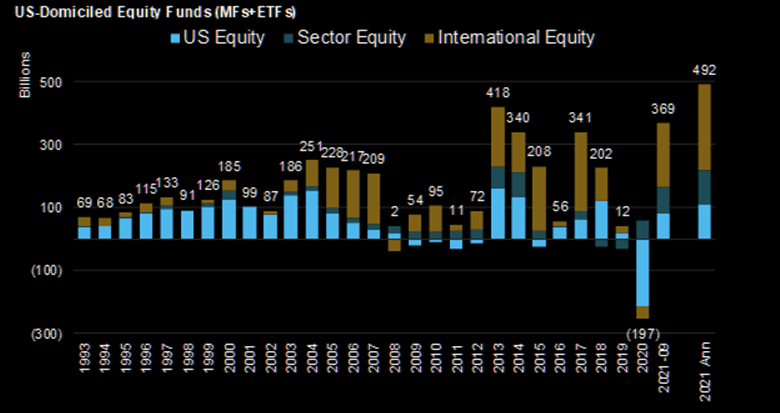
At the same time, in the face of inflation rising at the fastest rate since 1990, we have strong retail participation, seasonality, and buybacks to support the valuations we’re at, now.
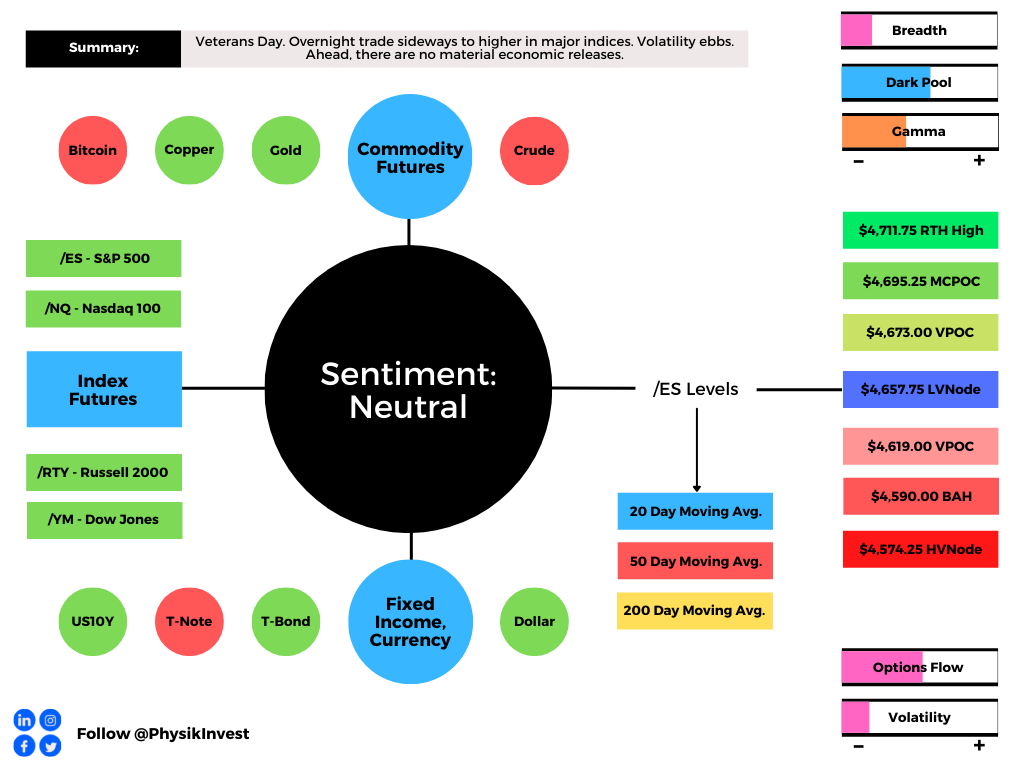
Expectations: As of 6:30 AM ET, Wednesday’s regular session (9:30 AM – 4:00 PM ET), in the S&P 500, will likely open in the upper part of a positively skewed overnight inventory, inside of prior-range and -value, suggesting a limited potential for immediate directional opportunity.
In the best case, the S&P 500 trades sideways or higher; activity above the $4,657.75 low volume area (LVNode) puts in play the $4,673.00 untested point of control (VPOC). Initiative trade beyond the VPOC could reach as high as the $4,695.25 micro composite point of control (MCPOC) and $4,711.75 regular trade high (RTH High), or higher.
In the worst case, the S&P 500 trades lower; activity below the $4,657.75 LVNode puts in play the $4,619.00 VPOC. Initiative trade beyond the VPOC could reach as low as $4,590.00, a prior balance area high (BAH), and $4,574.25 high volume area (HVNode), or lower.
To note, a breach of the prior day’s low likely puts the S&P 500 in a short-gamma environment. When dealers are short-gamma, they buy into strength and sell into weakness, exacerbating volatility. When dealers are long-gamma, they buy into weakness and sell into strength, calming volatility.
Click here to load today’s updated key levels into the web-based TradingView charting platform. Note that all levels are derived using the 65-minute timeframe. New links are produced, daily.

What People Are Saying
Definitions
Volume Areas: A structurally sound market will build on areas of high volume (HVNodes). Should the market trend for long periods of time, it will lack sound structure, identified as low volume areas (LVNodes). LVNodes denote directional conviction and ought to offer support on any test.
If participants were to auction and find acceptance into areas of prior low volume (LVNodes), then future discovery ought to be volatile and quick as participants look to HVNodes for favorable entry or exit.
POCs: POCs are valuable as they denote areas where two-sided trade was most prevalent in a prior day session. Participants will respond to future tests of value as they offer favorable entry and exit.
MCPOCs: POCs are valuable as they denote areas where two-sided trade was most prevalent over numerous day sessions. Participants will respond to future tests of value as they offer favorable entry and exit.
Volume-Weighted Average Prices (VWAPs): A metric highly regarded by chief investment officers, among other participants, for quality of trade. Additionally, liquidity algorithms are benchmarked and programmed to buy and sell around VWAPs.
About
After years of self-education, strategy development, and trial-and-error, Renato Leonard Capelj began trading full-time and founded Physik Invest to detail his methods, research, and performance in the markets.
Additionally, Capelj is a Benzinga finance and technology reporter interviewing the likes of Shark Tank’s Kevin O’Leary, JC2 Ventures’ John Chambers, and ARK Invest’s Catherine Wood, as well as a SpotGamma contributor, developing insights around impactful options market dynamics.
Disclaimer
At this time, Physik Invest does not manage outside capital and is not licensed. In no way should the materials herein be construed as advice. Derivatives carry a substantial risk of loss. All content is for informational purposes only.