
Editor’s Note: If this commentary was valuable to you, consider forwarding it to your peers. Alternatively, share on social media and tag either @renatolcapelj or @physikinvest.
Wishing you good health and success!
Market Commentary
Equity index, bond, and commodity futures traded higher Friday. The VIX, US10Y, and dollar were sideways to lower.
- What happened and things to expect.
- Ahead is important employment data.
- Trade Idea: Complex spread in GME.
- Expecting less volatility to the upside.
What Happened: U.S. stock index futures auctioned sideways to higher last week alongside impactful events like the Federal Reserve’s Jackson Hole Economic Symposium.
Ahead this coming week is important data on employment, consumer confidence, vehicle sales, manufacturing, and more. See here for updated calendar data.
What To Expect: During the prior week’s trade, on mostly strong intraday breadth and market liquidity metrics, the best case outcome occurred, evidenced by new all-time highs in the S&P 500 and Nasdaq 100. This is significant because it suggests continued bullishness after a v-pattern recovery.
V-Pattern: A pattern that forms after a market establishes a high, retests some support, and then breaks above said high. In most cases, this pattern portends continuation.

Further, the aforementioned trade is happening in the context of the Jackson Hole Economic Symposium. This event’s implications on price are supportive.
To elaborate, given a slow down in the pace of the post-pandemic recovery, the Federal Reserve (i.e., Fed) decided not to manipulate policy to offset temporary factors. The reason being, policy effects are often delayed; doing something now could curb the recovery.
At the same time, with measures like the Marshallian K – the difference between year-over-year growth in M2 money supply and GDP – turning negative, there are concerns around liquidity and its impact on the equity market.
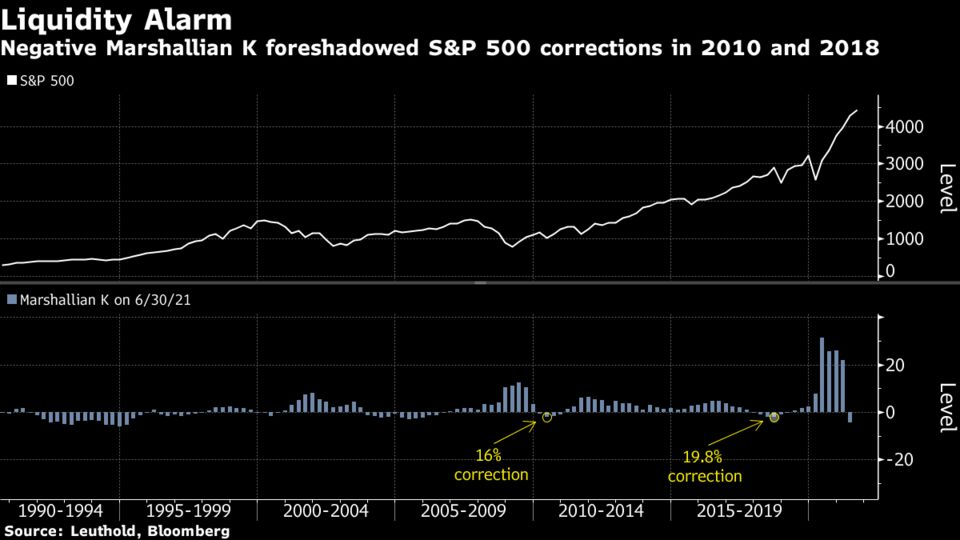
According to Moody’s, however, “it will take a while before liquidity concerns are justified even with the Fed likely to begin tapering its $120 billion in monthly asset purchases either late this year or early next.”
Why? Well, for starters, if liquidity was an issue, financial institutions wouldn’t be parking that much money at the Fed. Low volatility in the bond and stock market also implies ample liquidity, Moody’s adds.
So, by not rapidly reducing its asset purchases, the Fed isn’t worried about the economy overheating due to non-temporary inflation; instead, Chairman Jerome Powell maintains that “[o]verall global deflationary trends remain in force.”
Eventually, though, after progress is made on full employment, the Fed will taper, likely keeping inflation expectations in line.
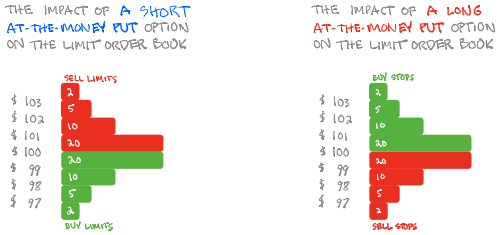
To note, last week’s straight-up trade came alongside the so-called sale of any volatility spike which can – through the process of hedging – support the market. Here’s just one example that received a lot of attention.
“In theory, if a stock was dropping and the retail masses all started to sell puts, they could push market makers to start buying large blocks of shares,” SpotGamma, an important voice in the space, says. “This could stabilize a dropping stock.”
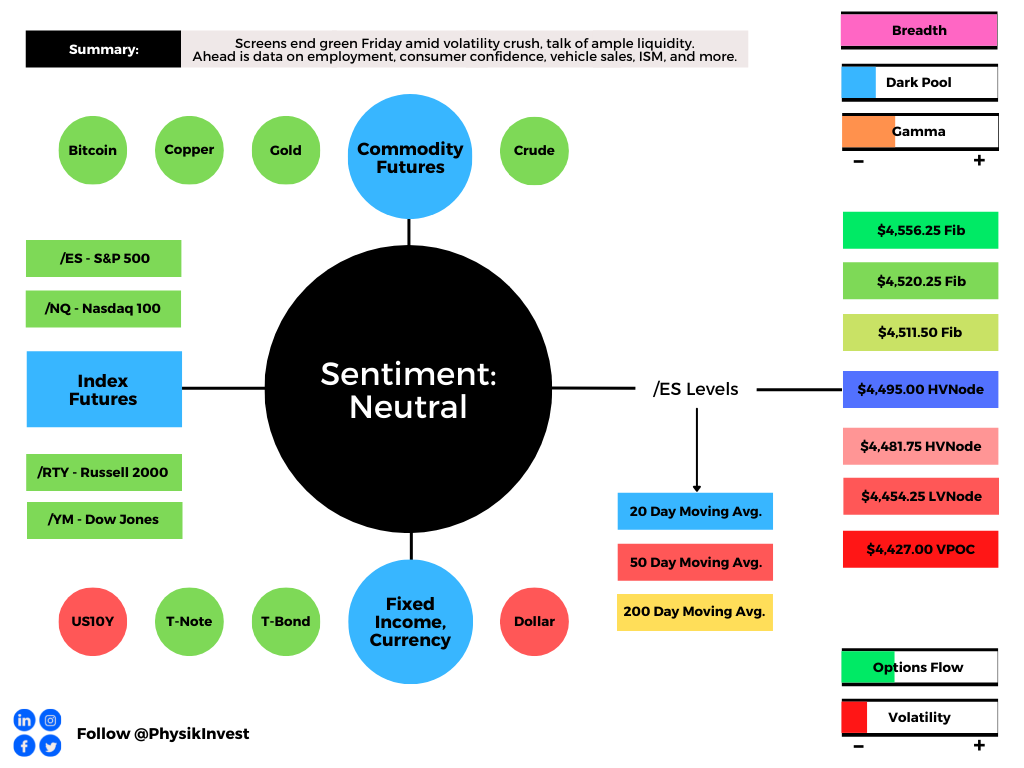
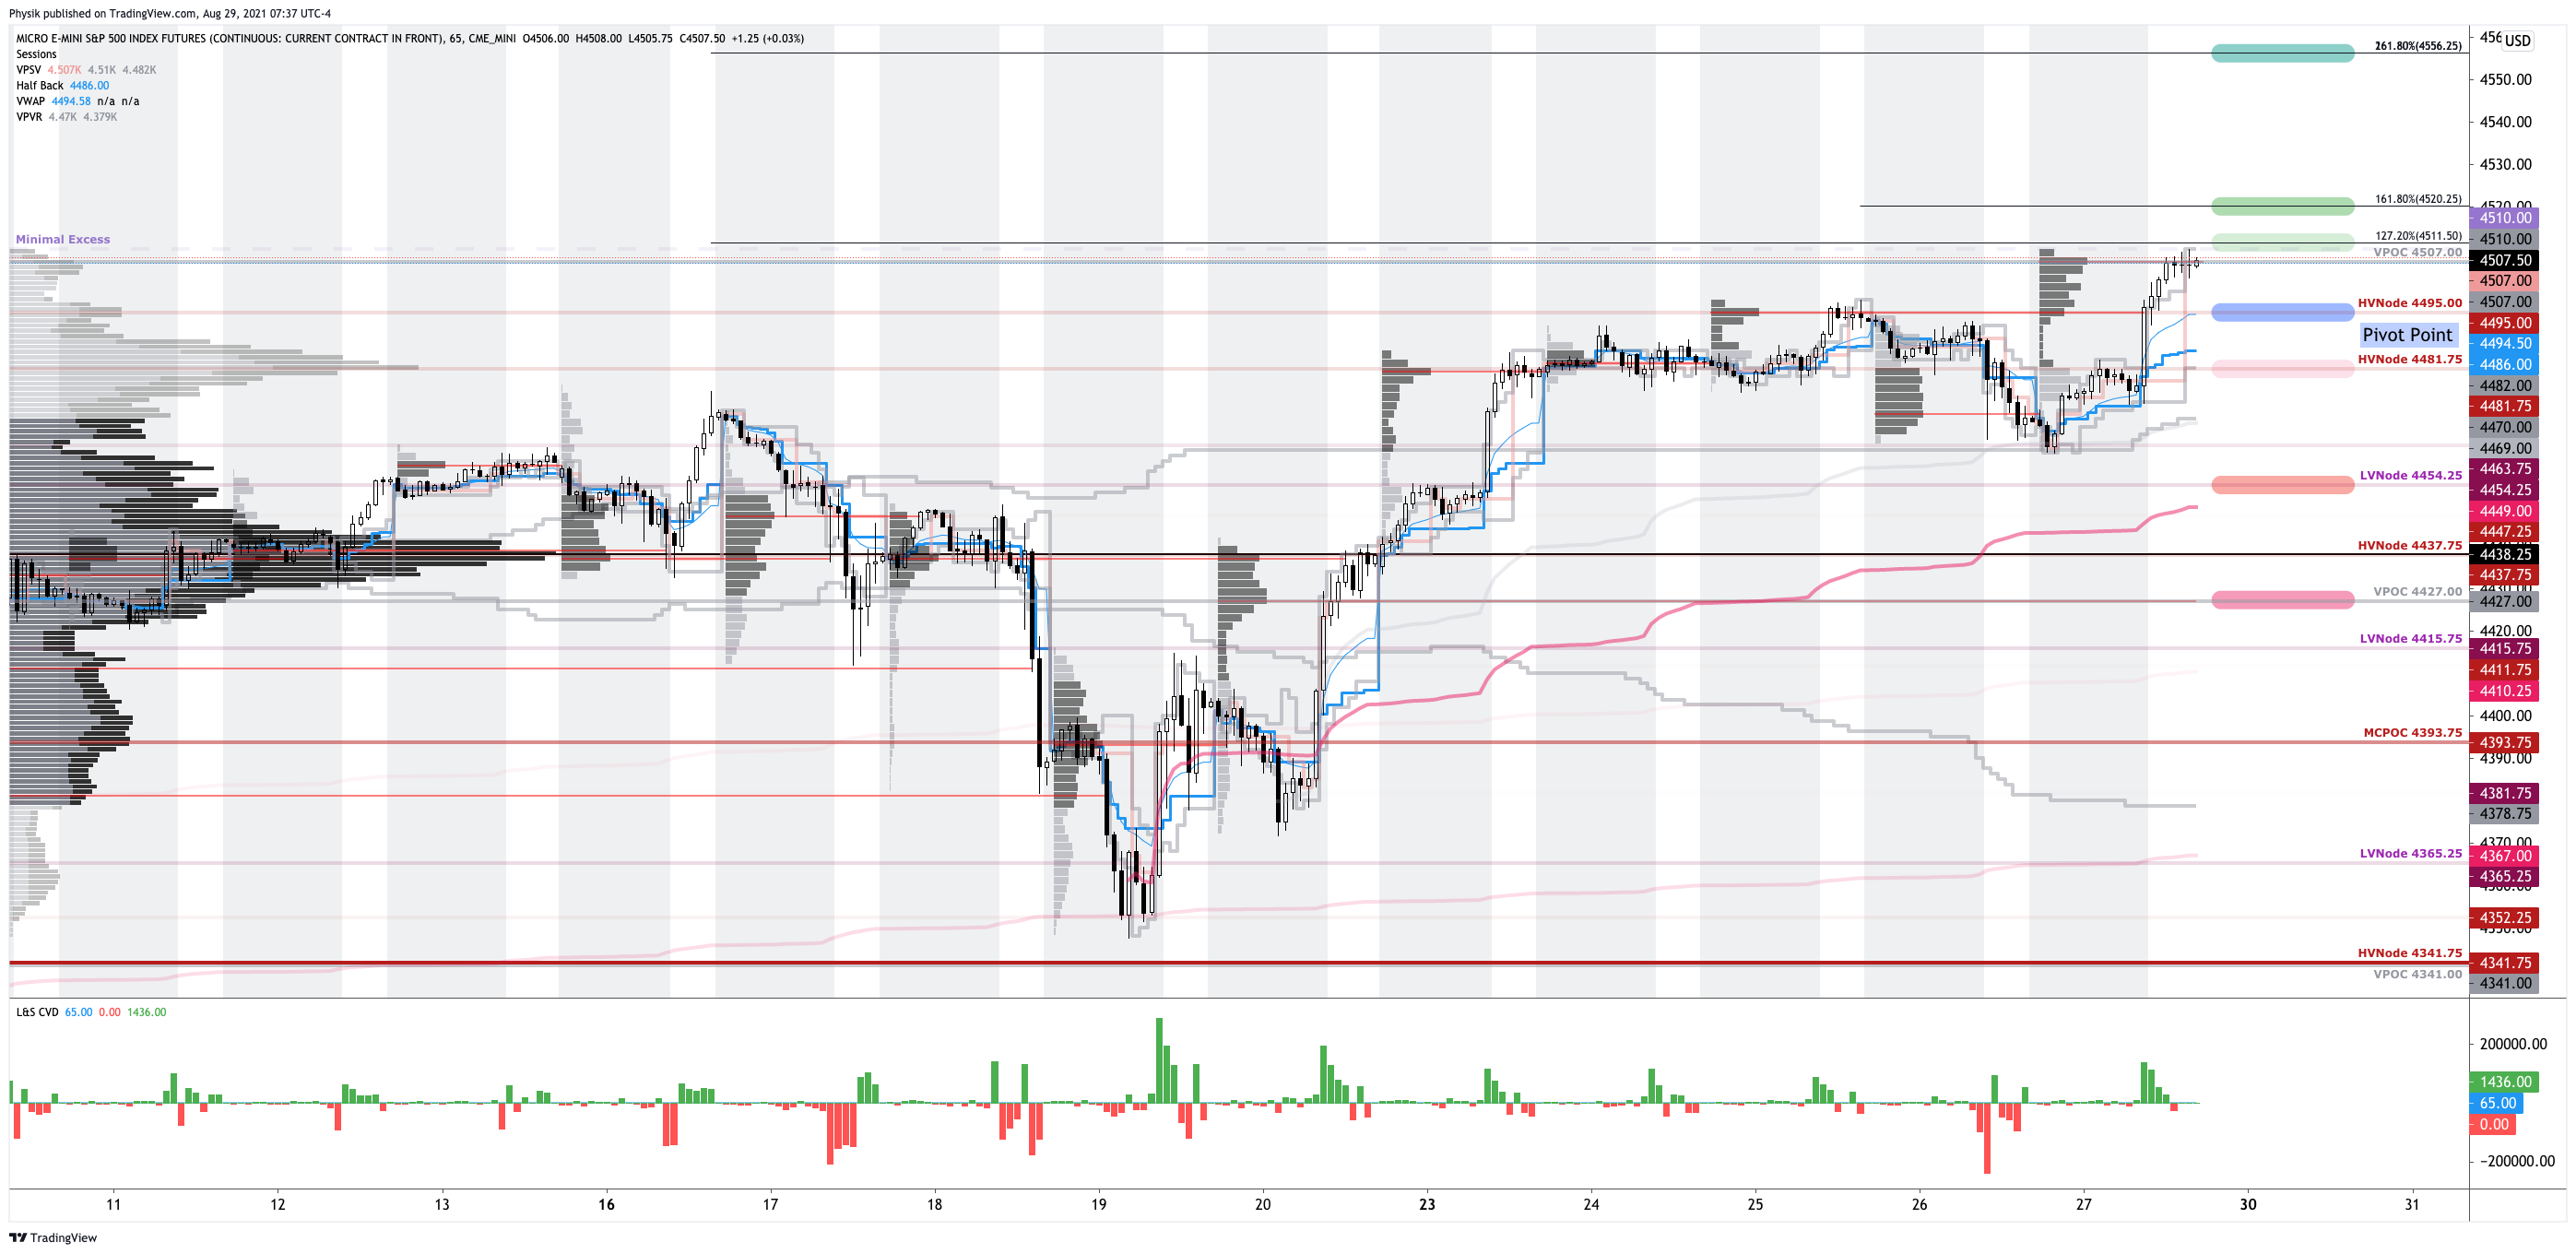
Moreover, given a divergent volume delta and decline in metrics like DIX and GEX, the odds of significant upside volatility are lower. Still, participants may make use of the following objective frameworks for next week’s trade. Check for updated levels in Monday morning’s commentary.
In the best case, the S&P 500 trades sideways or higher; activity above the $4,495.00 high volume area (HVNode) pivot puts in play the minimal excess all-time high and $4,511.50 Fibonacci extension. Initiative trade beyond the $4,511.50 level could reach as high as the $4,520.25 and $4,556.25 extensions.
In the worst case, the S&P 500 trades lower; activity below the $4,495.00 HVNode puts in play the $4,481.75 HVNode. Initiative trade beyond the $4,481.75 HVNode could reach as low as the $4,454.25 low volume area (LVNode) and $4,427.00 untested point of control (VPOC).
To note, the $4,454.25 LVNode corresponds with an anchored volume-weighted average price (VWAP), a metric highly regarded by chief investment officers, among other participants, for quality of trade. Additionally, liquidity algorithms are benchmarked and programmed to buy and sell around VWAPs.
Volume Delta: Buying and selling power as calculated by the difference in volume traded at the bid and offer.

DIX: For every buyer is a seller (usually a market maker). Using DIX — which is derived from short sales (i.e., liquidity provision on the market-making side) — we can measure buying pressure.

Gamma: Gamma is the sensitivity of an option to changes in the underlying price. Dealers that take the other side of options trades hedge their exposure to risk by buying and selling the underlying. When dealers are short-gamma, they hedge by buying into strength and selling into weakness. When dealers are long-gamma, they hedge by selling into strength and buying into weakness. The former exacerbates volatility. The latter calms volatility.

Volume Areas: A structurally sound market will build on past areas of high volume. Should the market trend for long periods of time, it will lack sound structure (identified as a low volume area which denotes directional conviction and ought to offer support on any test).

If participants were to auction and find acceptance into areas of prior low volume, then future discovery ought to be volatile and quick as participants look to areas of high volume for favorable entry or exit.

Excess: A proper end to price discovery; the market travels too far while advertising prices. Responsive, other-timeframe (OTF) participants aggressively enter the market, leaving tails or gaps which denote unfair prices.

POCs: POCs are valuable as they denote areas where two-sided trade was most prevalent. Participants will respond to future tests of value as they offer favorable entry and exit.
Weekly Trade Idea
Please Note: In no way is the below a trade recommendation. It is a peek into the thought process here at Physik Invest.
Options offer an efficient way to gain directional exposure.
If an option buyer was short (long) stock, he or she could buy a call (put) to hedge upside (downside) exposure. Additionally, one can spread, or buy (+) and sell (-) options together, strategically.
Commonly discussed spreads include credit, debit, ratio, back, and calendar.
Credit: Sell -1 option closer to the money. Buy +1 option farther out of the money.
Debit: Buy +1 option closer to the money. Sell -1 option farther out of the money.
Ratio: Buy +1 option closer to the money. Sell -2 options farther out of the money.
Back: Sell -1 option closer to the money. Buy +2 options farther out of the money.
Calendar: Sell -1 option. Buy +1 option farther out in time, at the same strike.
Typically, if bullish (bearish), sell at-the-money put (call) credit spread and/or buy a call (put) debit/ratio spread structured around target price. Alternatively, if the expected directional move is great (small), opt for a back spread (calendar spread). Also, if credit spread, capture 50-75% of the premium collected. If debit spread, capture 2-300% of the premium paid.
Be cognizant of risk exposure to direction (delta), time (theta), and volatility (vega).
Negative (positive) delta = synthetic short (long).
Negative (positive) theta = time decay hurts (helps).
Negative (positive) vega = volatility hurts (helps).
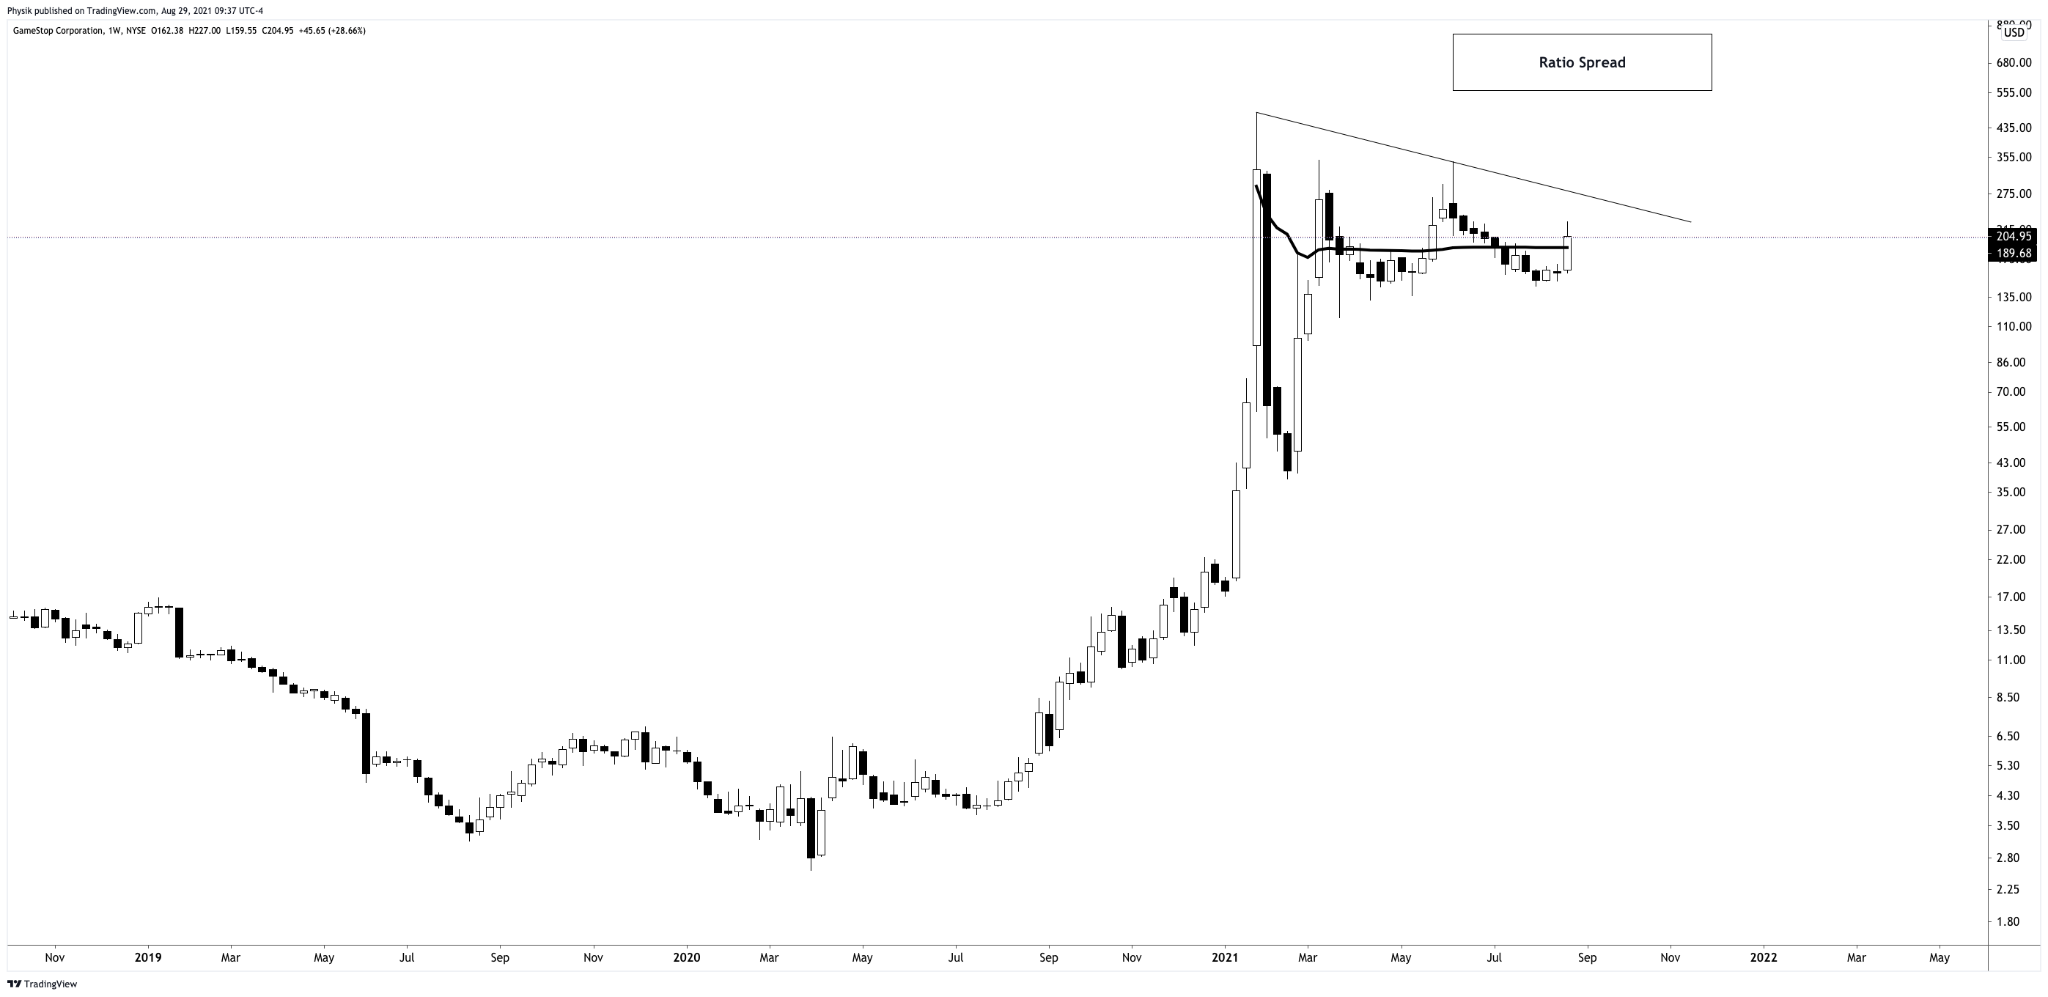
Trade Idea: SELL -1 1/2 BACKRATIO GME 100 17 SEP 21 530/680 CALL @1.20 LMT
Though I began filling this trade at limits for credit as high as 2.00, the spread collapsed markedly, Friday. Still, there’s an opportunity for unique structures such as the 530C+1, 680C-2 that pay you to be long the stock.
All else equal (i.e., discounting factors such as an increase in volatility), should the spread trade fully in-the-money – meaning the stock travels to the $680 short strike – the 530 strike will be 150 points in-the-money while the at-the-money strikes, combined (based on current at-the-money pricing), will trade around $53.00.
That suggests the spread should price for a credit north of $97.00 to close. Nice!
Thesis: I’m bullish on GameStop and I think the stock may climb over the next week few weeks.
I will structure a spread above the current stock price, expiring in 18 days. I will buy the 530 call option once (+1) and sell the 680 call option twice (-2) for a $1.20 credit or better. Should the stock not move to my target, I keep the $120.00 credit. Should it move to $680, I could make $15,000.00 at expiry. Should the stock move past $830 break even or so, I may incur unlimited losses. My goal with this spread is to capture the initial credit and close for additional credit if the stock moves higher.
If necessary, I will hedge the position by either (A) buying stock, (B) widening strikes, (C) buying a far out-of-the-money call option to cap upside in case of an unpredictable move higher, or (D) roll strikes up in price and out in time.
Below is a log chart of GameStop Corporation (NYSE: GME) and the ratio spread profit zone.
News And Analysis
Treasury bears redeemed as Citi, Michael Burry see higher yields.
Visa jumps into the NFT craze, buying a CryptoPunk for $150,000.
The top 7 reasons why COVID-19 could lead to inflationary regime.
Storm Ida roars toward Louisiana with winds of 150 miles per hour.
Chinese health officials reject U.S. allegations on COVID-19 probe.
What People Are Saying
Let’s Hang Out
Los Angeles, CA September 10-12
Salt Lake City, UT September 28-30
About
After years of self-education, strategy development, and trial-and-error, Renato Leonard Capelj began trading full-time and founded Physik Invest to detail his methods, research, and performance in the markets.
Additionally, Capelj is a finance and technology reporter. Some of his biggest works include interviews with leaders such as John Chambers, founder and CEO, JC2 Ventures, Kevin O’Leary, businessman and Shark Tank host, Catherine Wood, CEO and CIO, ARK Invest, among others.
Disclaimer
At this time, Physik Invest does not manage outside capital and is not licensed. In no way should the materials herein be construed as advice. Derivatives carry a substantial risk of loss. All content is for informational purposes only.
One reply on “Weekly Brief For August 29, 2021”
[…] liquidity is to shrink, naturally, as the economy grows quicker than the M2 money supply; the Marshallian K – the difference between year-over-year growth in M2 money supply and GDP – which had turned […]