
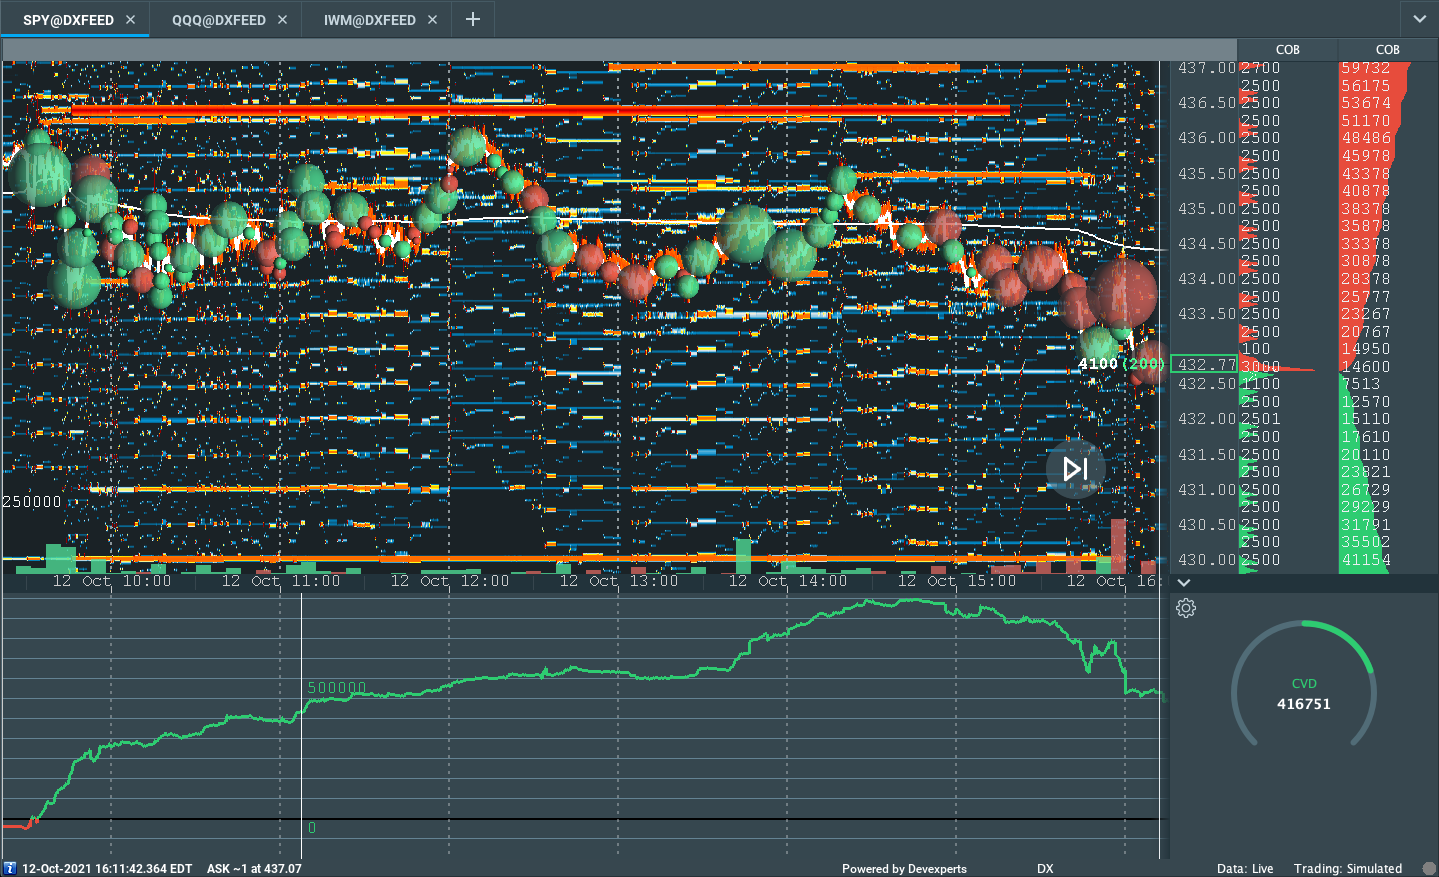
Editor’s Note: Tuesday’s newsletter tested a new feature to view real-time charts with key levels. From here on out, links to an updated layouts page will be found in the What To Expect section, below. Thanks!
Market Commentary
Equity index futures trade sideways to higher with bonds. Commodities were mixed.
- Initiative sellers fail to expand the range.
- Ahead is CPI, FOMC minutes, earnings.
What Happened: U.S. stock index futures auctioned sideways to higher ahead of data that would shed light on inflation and earnings.
Ahead is data on the Consumer Price Index (8:30 AM ET), FOMC minutes (2:00 PM ET), as well as Fed-speak (4:30 and 8:00 PM ET).
What To Expect: As of 6:30 AM ET, Wednesday’s regular session (9:30 AM – 4:00 PM EST) in the S&P 500 will likely open inside of prior-range and -value, suggesting a limited potential for immediate directional opportunity.
Adding, during the prior day’s regular trade, on positive intraday breadth and divergent market liquidity metrics, the worst-case outcome occurred, evidenced by another spike or knee-jerk, end-of-day move, after initiative buyers lacked the conviction to push for excess.
Overnight exploration failed to provide validation of the spike; indices recovered the area where two-sided trade was most prevalent in Tuesday’s regular session.
Combining the activity over the past couple of sessions, we see an inability – on the part of sellers – to expand the range and value (i.e., the area where 70% of the day’s volume occurred). Trading above $4,360.00 in the S&P 500 invalidates Monday’s spike, likely forcing those short-term participants who sold the break to cover.
Further, the aforementioned trade is happening in the context of a seasonal cycle of rebalancing and earnings, improvement among some positioning metrics, among other things.
Though these themes support (1) October volatility and (3) an increased potential for sideways to higher trade, some risks exist.
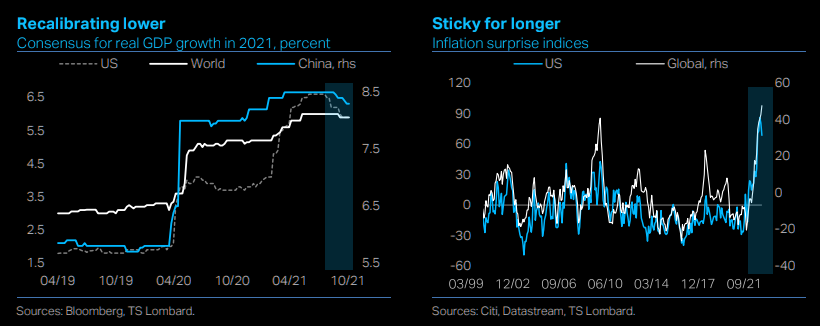
Nordea summarizes it well: “The combination of higher inflation risks and weaker activity data makes the near-term market outlook uncertain. We see more hawkish central banks, higher bond yields, and a stronger USD ahead.”
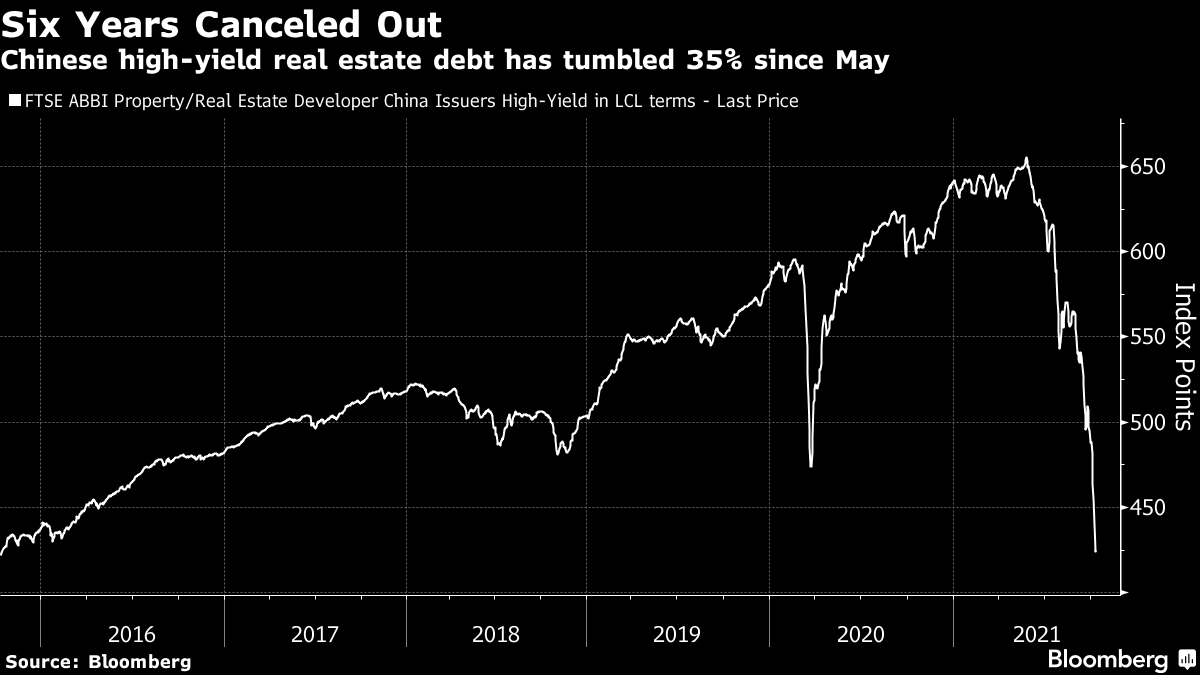
At the same time, according to a summary put out by The Market Ear, TS Lombard sees (1) China’s economic slowdown spilling over, (2) consumer confidence weakening amidst a bump in inflation expectations, (3) persistent inflationary pressures hastening the global monetary tightening, and (4) COVID-19 mutations leading to renewed lockdowns.
Moreover, for today, participants may make use of the following frameworks.
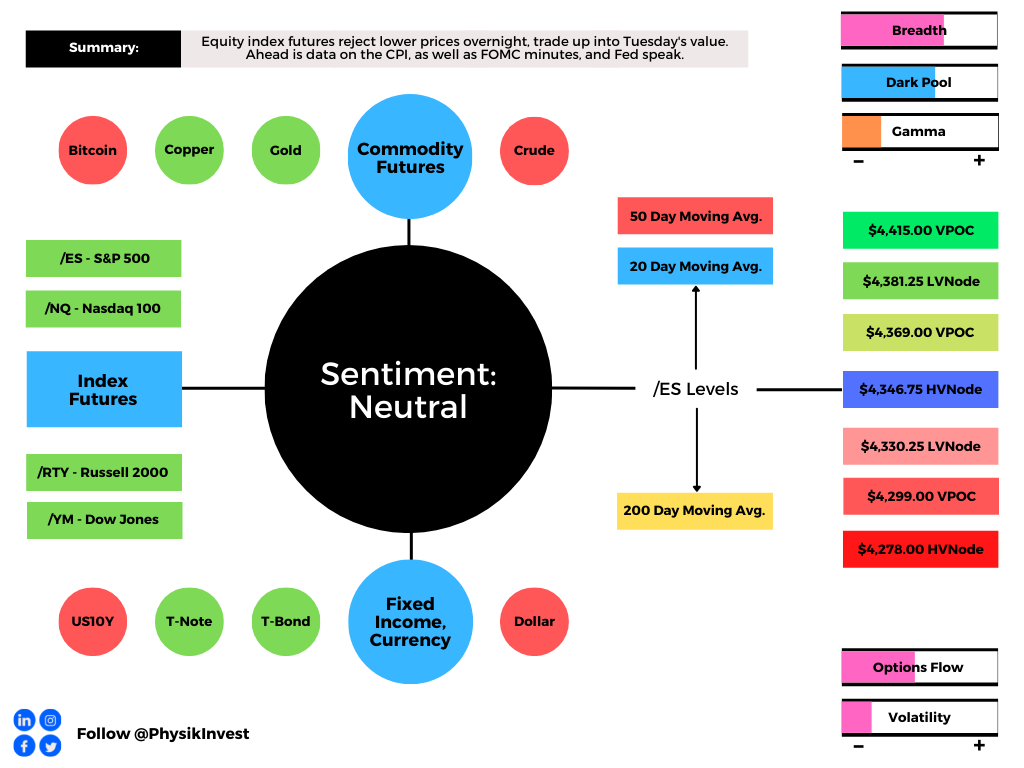
In the best case, the S&P 500 trades sideways or higher; activity above the $4,346.75 high volume area (HVNode) pivot puts in play the $4,369.00 untested point of control (VPOC). Initiative trade beyond the VPOC could reach as high as the $4,381.25 low volume area (LVNode) and $4,415.00 VPOC, or higher.
In the worst case, the S&P 500 trades lower; activity below the $4,346.75 HVNode pivot puts in play the $4,330.25 LVNode. Initiative trade beyond the LVNode could reach as low as the $4,299.00 VPOC and $4,278.00 HVNode, or lower.
Click here to load today’s updated real-time key levels into the web-based TradingView charting platform. Please note that all levels are derived using the 65-minute timeframe.

Definitions
Spikes: Spike’s mark the beginning of a break from value. Spikes higher (lower) are validated by trade at or above (below) the spike base (i.e., the origin of the spike).
Volume Areas: A structurally sound market will build on areas of high volume (HVNodes). Should the market trend for long periods of time, it will lack sound structure, identified as low volume areas (LVNodes). LVNodes denote directional conviction and ought to offer support on any test.
If participants were to auction and find acceptance into areas of prior low volume (LVNodes), then future discovery ought to be volatile and quick as participants look to HVNodes for favorable entry or exit.
POCs: POCs are valuable as they denote areas where two-sided trade was most prevalent in a prior day session. Participants will respond to future tests of value as they offer favorable entry and exit.
Excess: A proper end to price discovery; the market travels too far while advertising prices. Responsive, other-timeframe (OTF) participants aggressively enter the market, leaving tails or gaps which denote unfair prices.
Value-Area Placement: Perception of value unchanged if value overlapping (i.e., inside day). Perception of value has changed if value not overlapping (i.e., outside day). Delay trade in the former case.
News And Analysis
Half of all delinquent homeowners have missed six payments.
China credit growth slows amid property, Evergrande troubles.
JPMorgan smashing estimates on M&A, wealth management.
Low vaccination rates exacerbate America’s caregiving crisis.
Apple finally fell victim to the never-ending supply chain crisis.
What People Are Saying
About
After years of self-education, strategy development, and trial-and-error, Renato Leonard Capelj began trading full-time and founded Physik Invest to detail his methods, research, and performance in the markets.
Additionally, Capelj is a finance and technology reporter. Some of his biggest works include interviews with leaders such as John Chambers, founder and CEO, JC2 Ventures, Kevin O’Leary, businessman and Shark Tank host, Catherine Wood, CEO and CIO, ARK Invest, among others.
Disclaimer
At this time, Physik Invest does not manage outside capital and is not licensed. In no way should the materials herein be construed as advice. Derivatives carry a substantial risk of loss. All content is for informational purposes only.