
The daily brief is a free glimpse into the prevailing fundamental and technical drivers of U.S. equity market products. Join the 300+ that read this report daily, below!
What To Expect
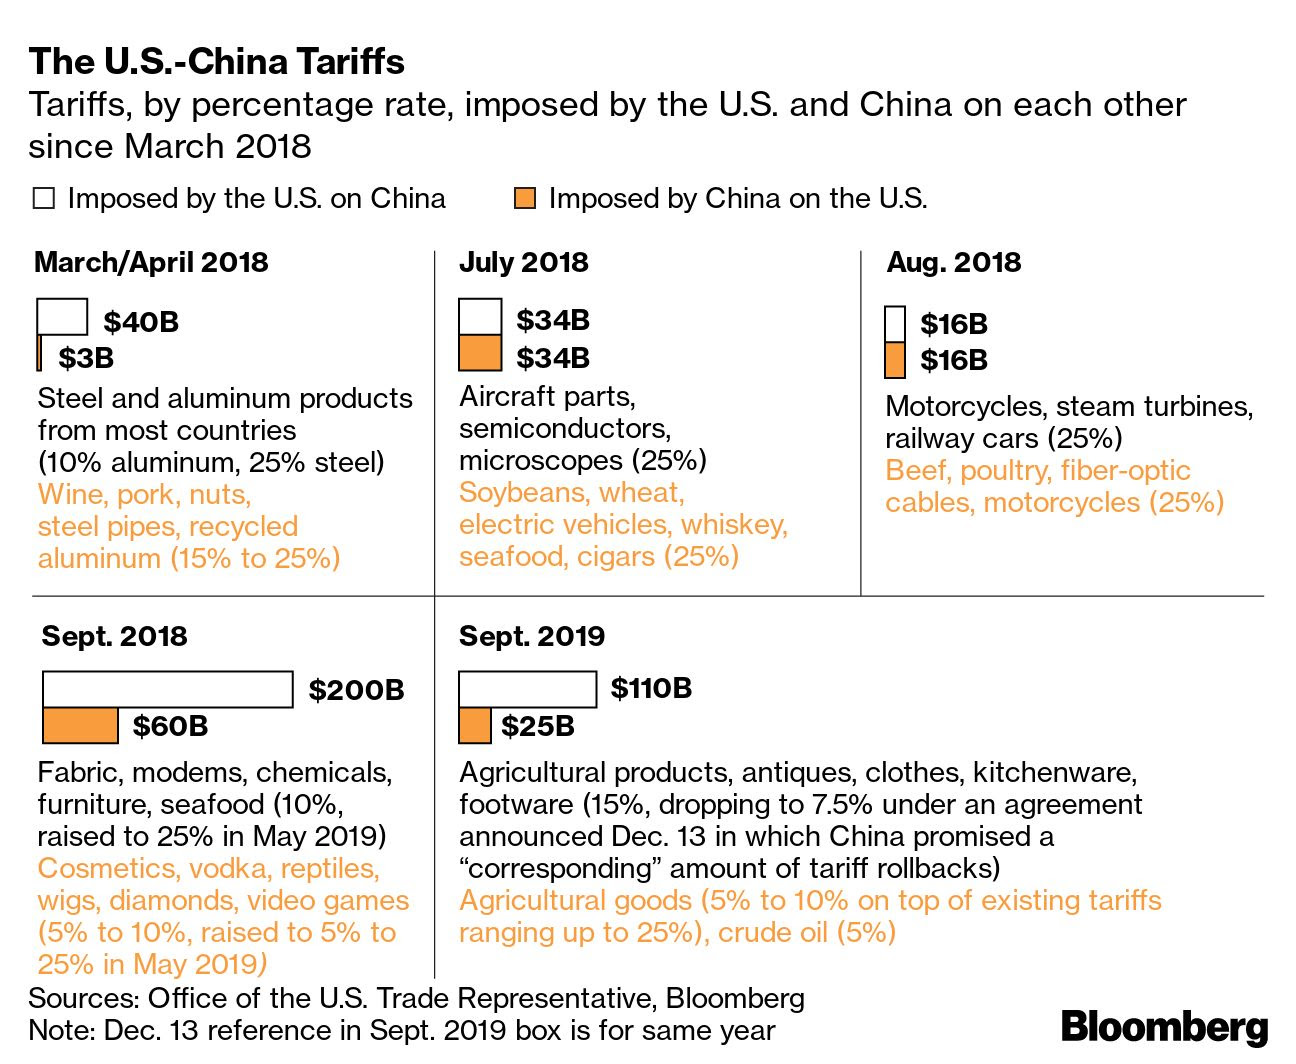
Fundamental: In the headlines were the chip boom’s loss of steam, the Bank of England’s consideration of 50-year mortgages, the potential collapse or rise in oil by year-end, NATO’s resumption of expansion processes, slowing car sales, China tariffs reduction, Germany’s first monthly trade deficit since 1991 on inflation, and more.
Key in last week’s narratives was U.S. manufacturing’s decline as new orders were below that of inventories.
Bloomberg’s John Authers explains that “[t]he signal grows even more discomforting if the new orders number is below the recessionary cutoff at 50.”
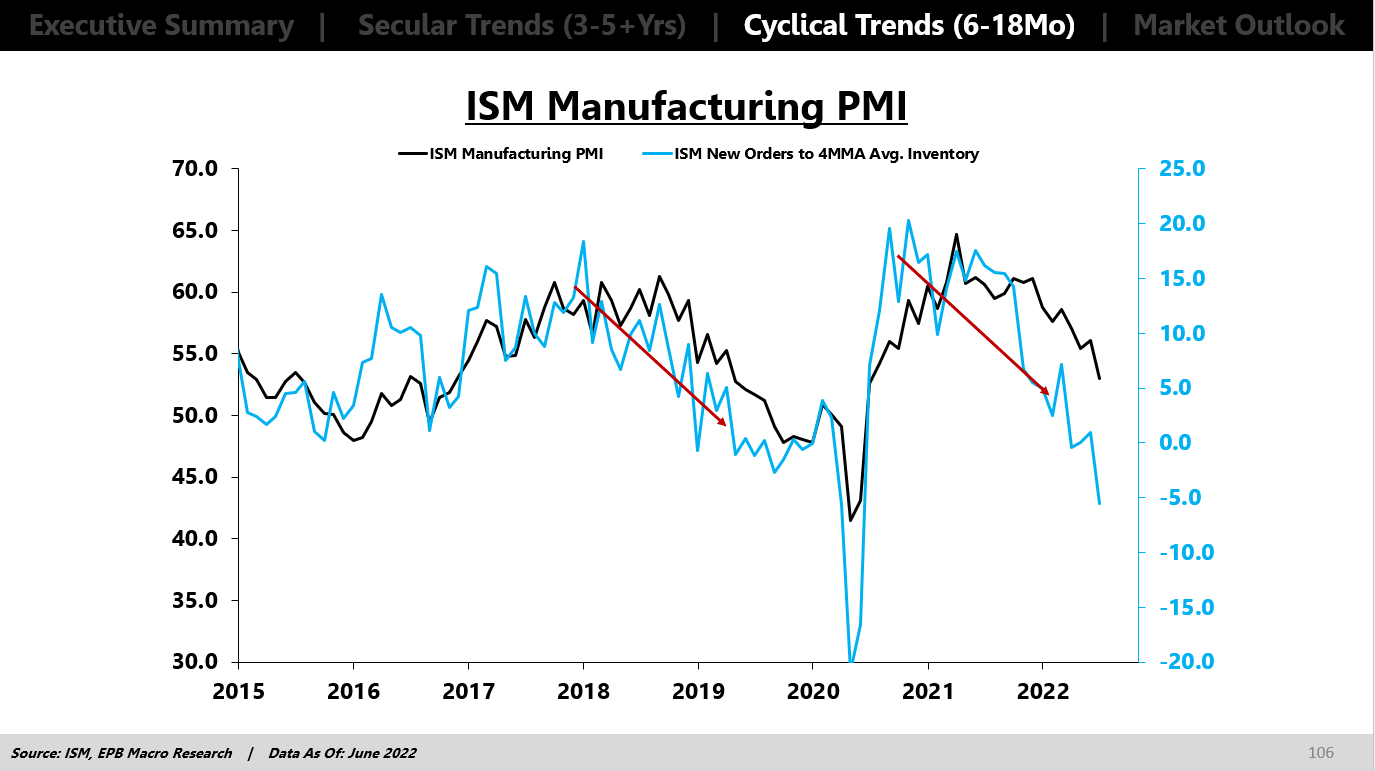
“If the new story of imminent slowdown and a limited monetary tightening campaign turns out to be true, then the narrative on earnings will have to change. That positivity about earnings is what is keeping stocks from selling off far more,” Authers adds.
“The next couple of weeks will bring critical macro data on inflation and employment; but immediately after that, the earnings numbers will start to flow. It might not be pretty.”
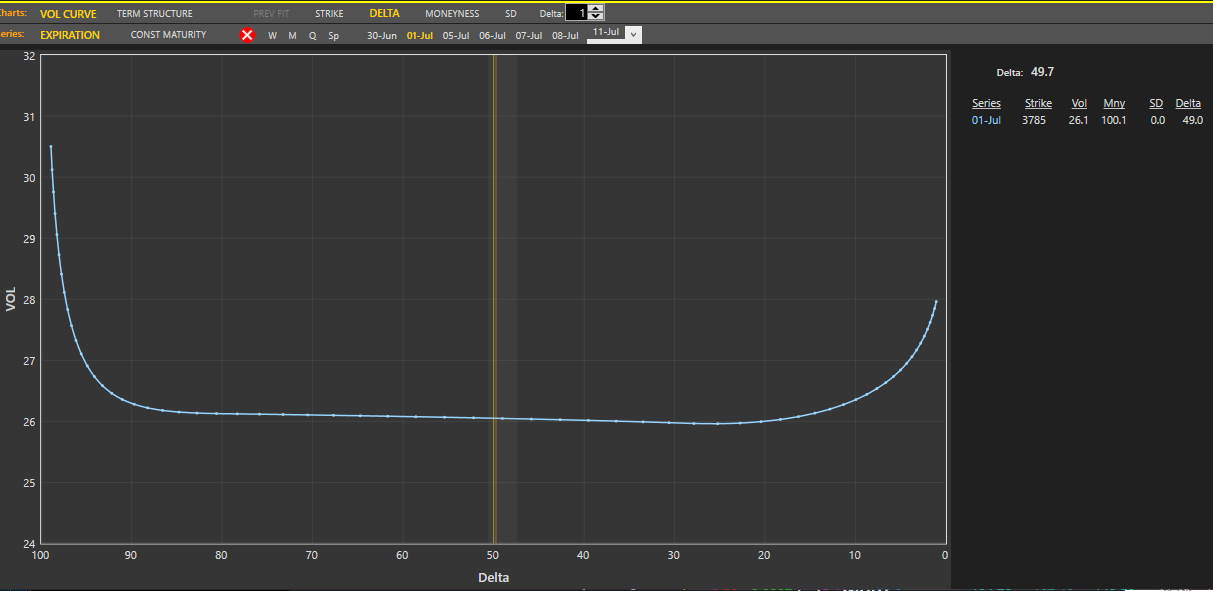
Positioning: Data on net gamma exposures points to more volatile ranges.
Given the relationship between realized (RVOL) and implied (IVOL) volatility, as well as naive metrics for skew, it makes sense to not be a seller of volatility, especially in options that are short-dated and farther out.
Moreover, participants’ combined view is that markets are likely to head lower, via Deutsche Bank AG (NYSE: DB).
However, as we discussed in sessions prior, their demand for exposure to the upside resulted in “a flattening in the downside strike skew, while the upside wings have become more smiley.”
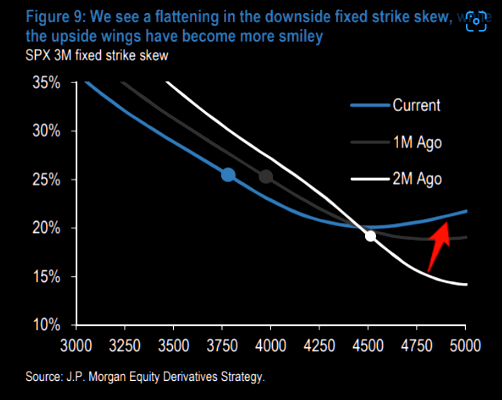
A “higher starting point” in implied volatility (IVOL), and a still-present right-tail (from the positioning for a bear market rally), make it so we may position, for less cost, in short-dated structures with asymmetric payouts, on both sides of the market.
Read: For more on how to play, read the Daily Brief for June 30, 2022.
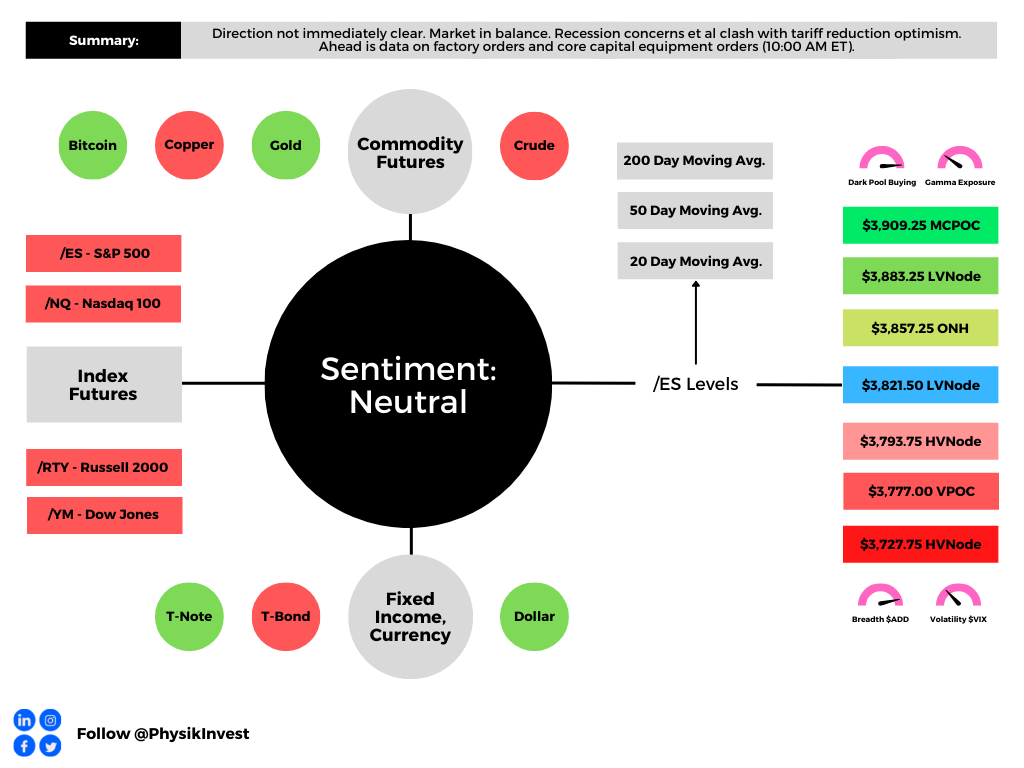
Technical: As of 6:30 AM ET, Tuesday’s regular session (9:30 AM – 4:00 PM ET), in the S&P 500, is likely to open in the middle part of a balanced overnight inventory, inside of prior-range and -value, suggesting a limited potential for immediate directional opportunity.
In the best case, the S&P 500 trades higher.
Any activity above the $3,821.50 LVNode puts into play the $3,857.25 ONH. Initiative trade beyond the ONH could reach as high as the $3,883.25 LVNode and $3,909.25 MCPOC, or higher.
In the worst case, the S&P 500 trades lower.
Any activity below the $3,821.50 LVNode puts into play the $3,793.75 HVNode. Initiative trade beyond the HVNode could reach as low as the $3,777.00 VPOC and $3,727.75 HVNode, or lower.
Click here to load today’s key levels into the web-based TradingView charting platform. Note that all levels are derived using the 65-minute timeframe. New links are produced, daily.

Definitions
Overnight Rally Highs (Lows): Typically, there is a low historical probability associated with overnight rally-highs (lows) ending the upside (downside) discovery process.
Volume Areas: A structurally sound market will build on areas of high volume (HVNodes). Should the market trend for long periods of time, it will lack sound structure, identified as low volume areas (LVNodes). LVNodes denote directional conviction and ought to offer support on any test.
If participants were to auction and find acceptance into areas of prior low volume (LVNodes), then future discovery ought to be volatile and quick as participants look to HVNodes for favorable entry or exit.
POCs: POCs are valuable as they denote areas where two-sided trade was most prevalent in a prior day session. Participants will respond to future tests of value as they offer favorable entry and exit.
About
After years of self-education, strategy development, mentorship, and trial-and-error, Renato Leonard Capelj began trading full-time and founded Physik Invest to detail his methods, research, and performance in the markets.
Capelj also develops insights around impactful options market dynamics at SpotGamma and is a Benzinga reporter.
Some of his works include conversations with ARK Invest’s Catherine Wood, investors Kevin O’Leary and John Chambers, FTX’s Sam Bankman-Fried, former Bridgewater Associate Andy Constan, Kai Volatility’s Cem Karsan, The Ambrus Group’s Kris Sidial, among many others.
Disclaimer
In no way should the materials herein be construed as advice. Derivatives carry a substantial risk of loss. All content is for informational purposes only.


