
Physik Invest’s Daily Brief is read by over 1,200 people. To join this community and learn about the fundamental and technical drivers of markets, subscribe below.
Administrative
Hope you had a great holiday with your closest!
Fundamental
Minutes from a Federal Open Market Committee (FOMC) meeting dropped last week.
As strategist Rishi Mishra summarized well, “the focus shift[ed] to the terminal rate from the pace of tightening; although the terminal rate would be higher than previously expected, the pace at which we get there will be slower because they want to take lags into account.”
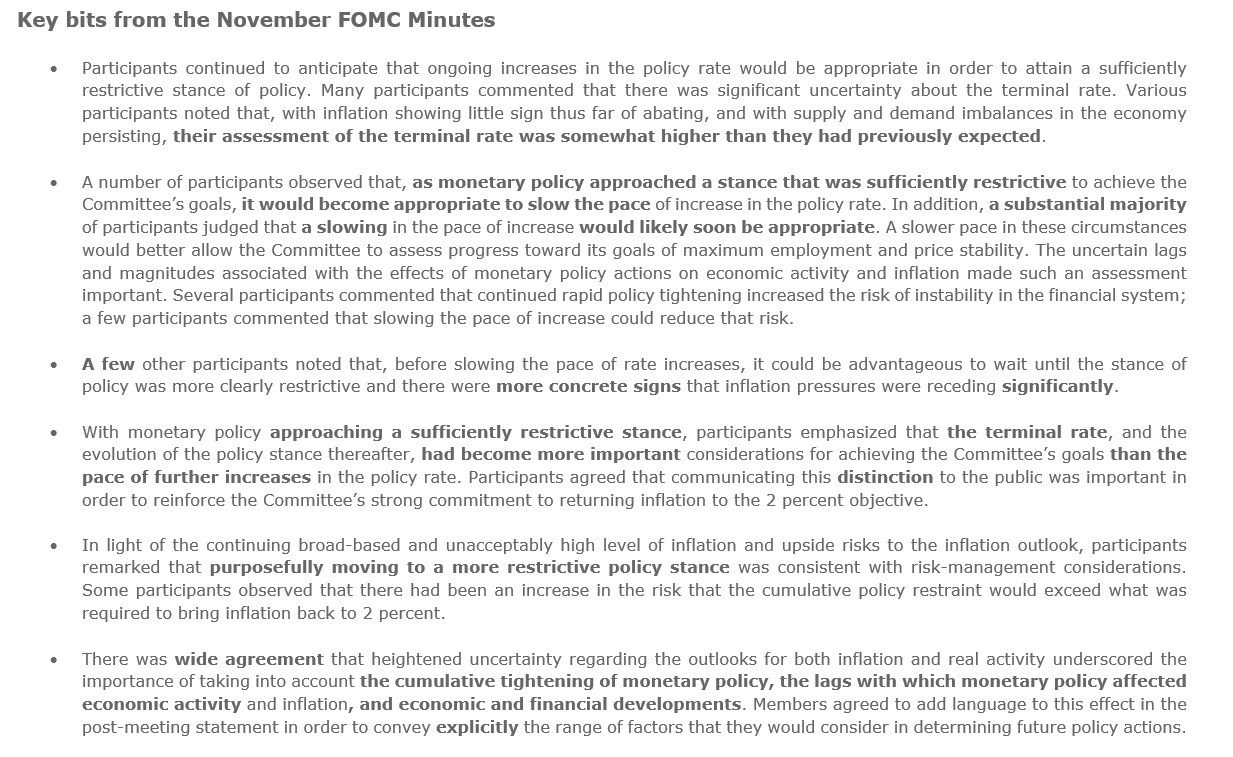
At its core, the economy has not slowed as much as the Fed was expecting, said Ellen Meade, a former Fed Board economist; “[t]hey can’t stop the rate increases until they see some measured evidence that the economy is slowing.”
So, with inflation “still at its highest since the 1980s,” according to Fabian Wintersberger, all the while financial conditions have loosened on easing inflation pressures, markets have yet to face their “most significant problems, [and] … keeping interest rates around 5% will not be a Fed pivot” (which is likely to happen near the middle of 2023, per the consensus analysis).
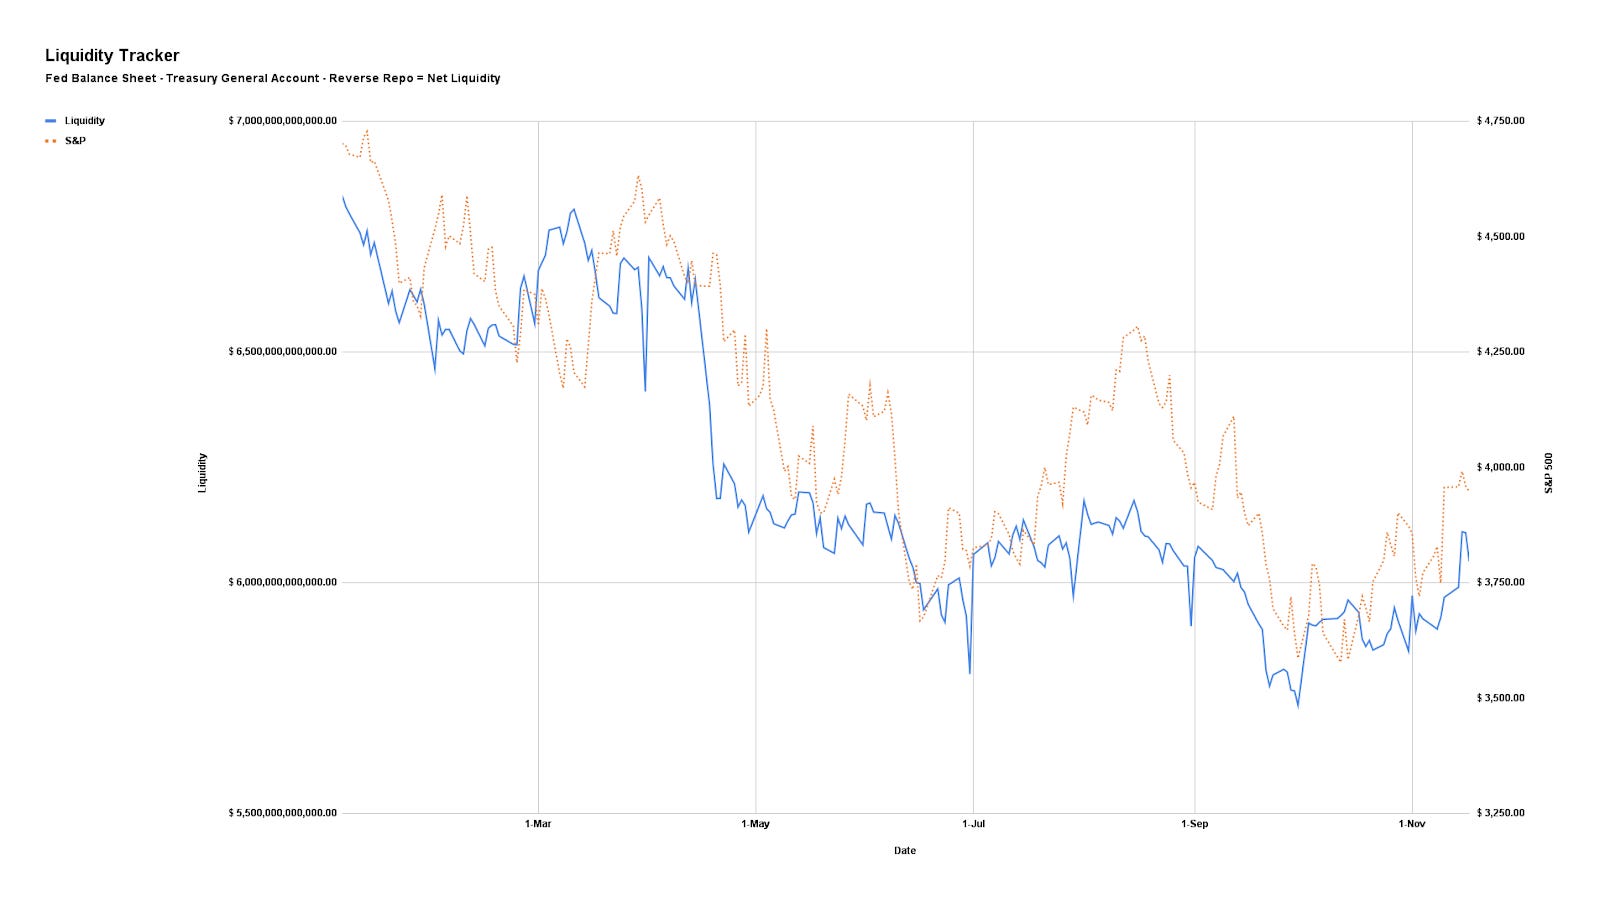
In short, the Fed must further raise rates and unwind liquidity injections.
To bring the “balance sheet back to [2020 levels], [the Fed] needs to reduce it by 41%.” The balance sheet has only been reduced by 1.5%. Should liquidity keep shrinking, that pulls investors out of risk.
Positioning
From a volatility perspective, it’s not a terrible time to hedge.
An example demonstrates the point, well. As lightly discussed in last week’s letters, in mid-June, a trading partner and I noticed a change in tone in the non-linearity of volatility and skew with respect to linear changes in the price of the market or S&P 500 (INDEX: SPX).
The cost of certain spread structures (e.g., long/short one option near- or at-the-money and short/long two or more further out-of-the-money options) changed by hundreds of percent for only a few basis points of change in the underlying’s price.
Here’s more detail:
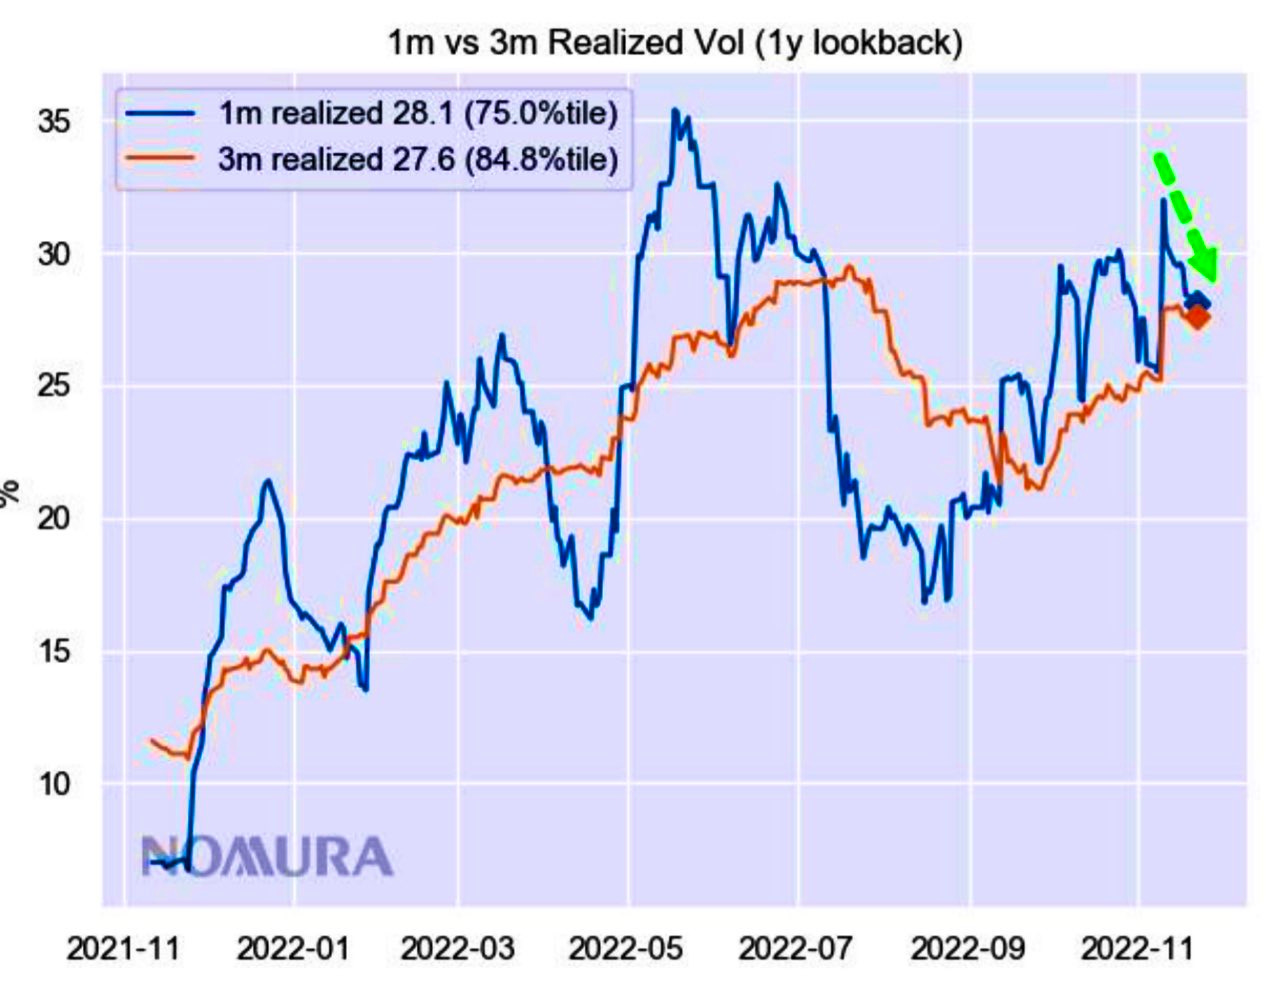
The market rose (boosted by a “vol crunch” and “systemic exposure reallocation,” per Nomura Holdings Inc’s [NYSE: NMR] Charlie McElligott) and, though top-line measures of IVOL have declined (e.g., INDEX: VIX), volatility skew is performing well.
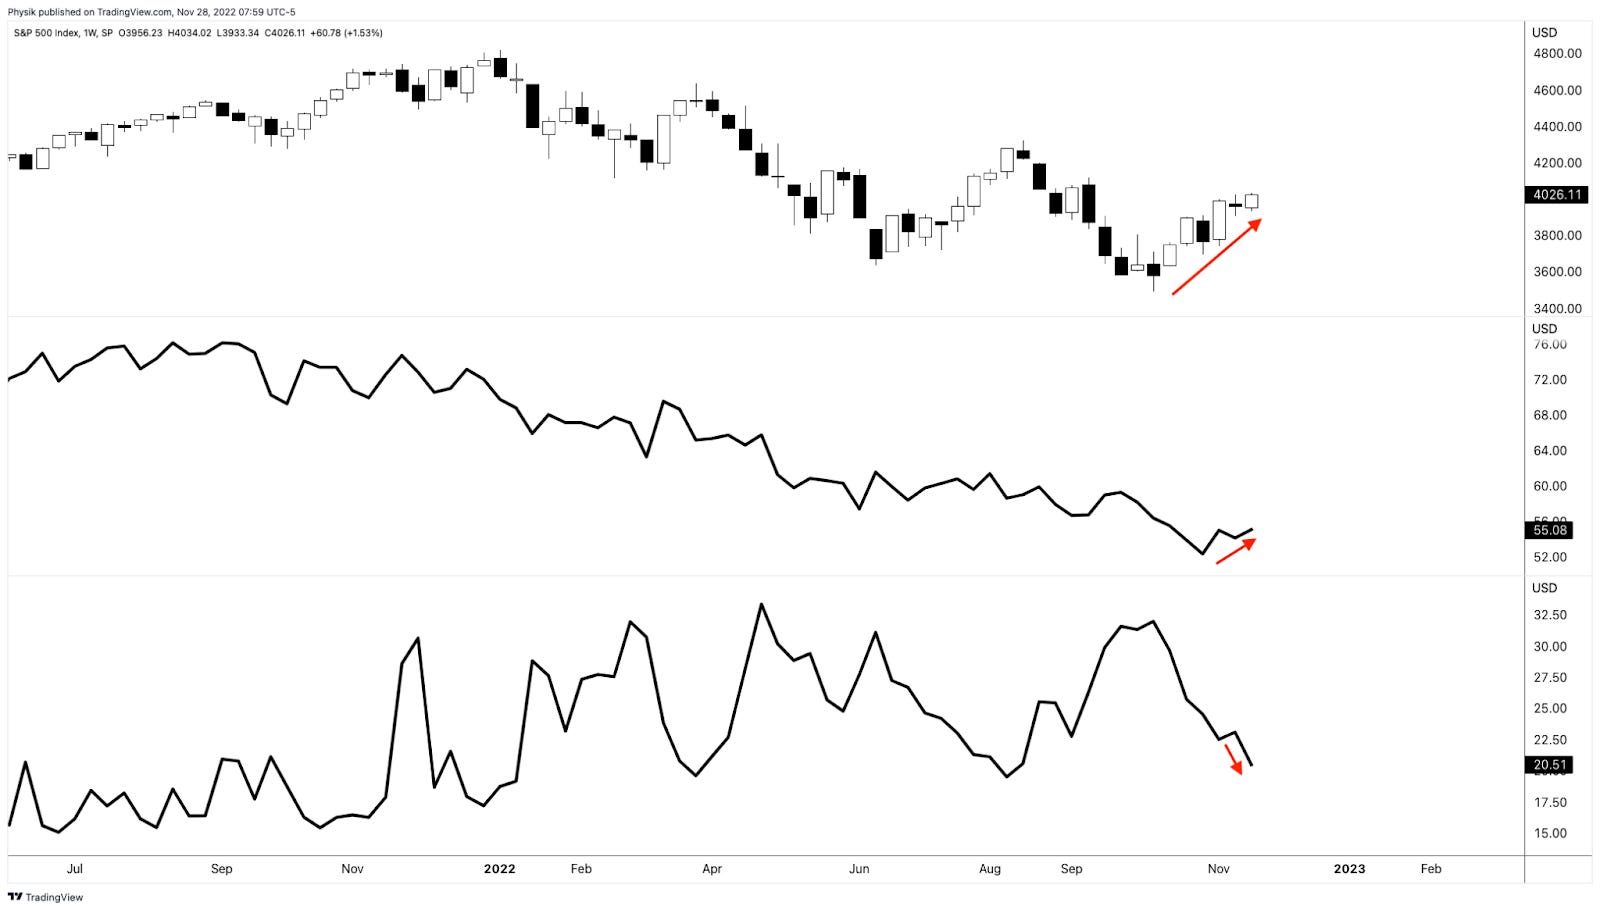
As Kai Volatility’s Cem Karsan once explained, this suggests “a potentially critical change in dealer positioning [and] the distribution of underlying outcomes”.
IVOL is at a lower bound and the bullish impacts yielded by its compressing have, largely, played out.
There is more to be gained by movement higher in IVOL. By owning protection, particularly that which is farther from current prices, you are positioned to monetize on non-linear repricings of volatility (as we saw earlier this year and may still see).
Technical
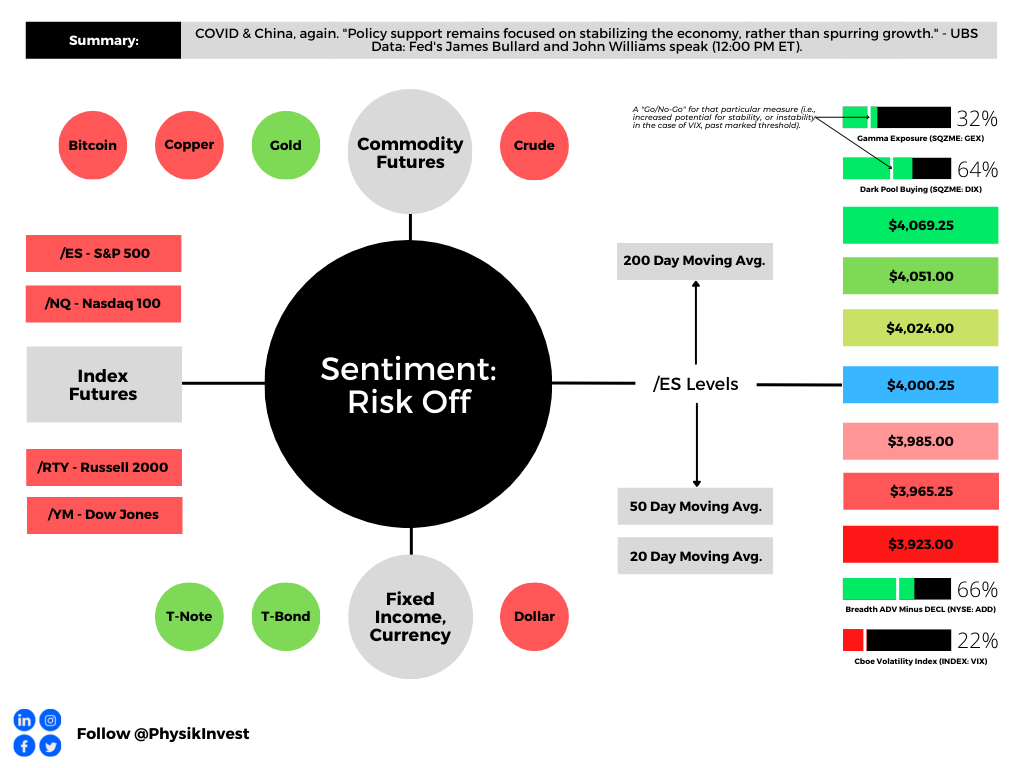
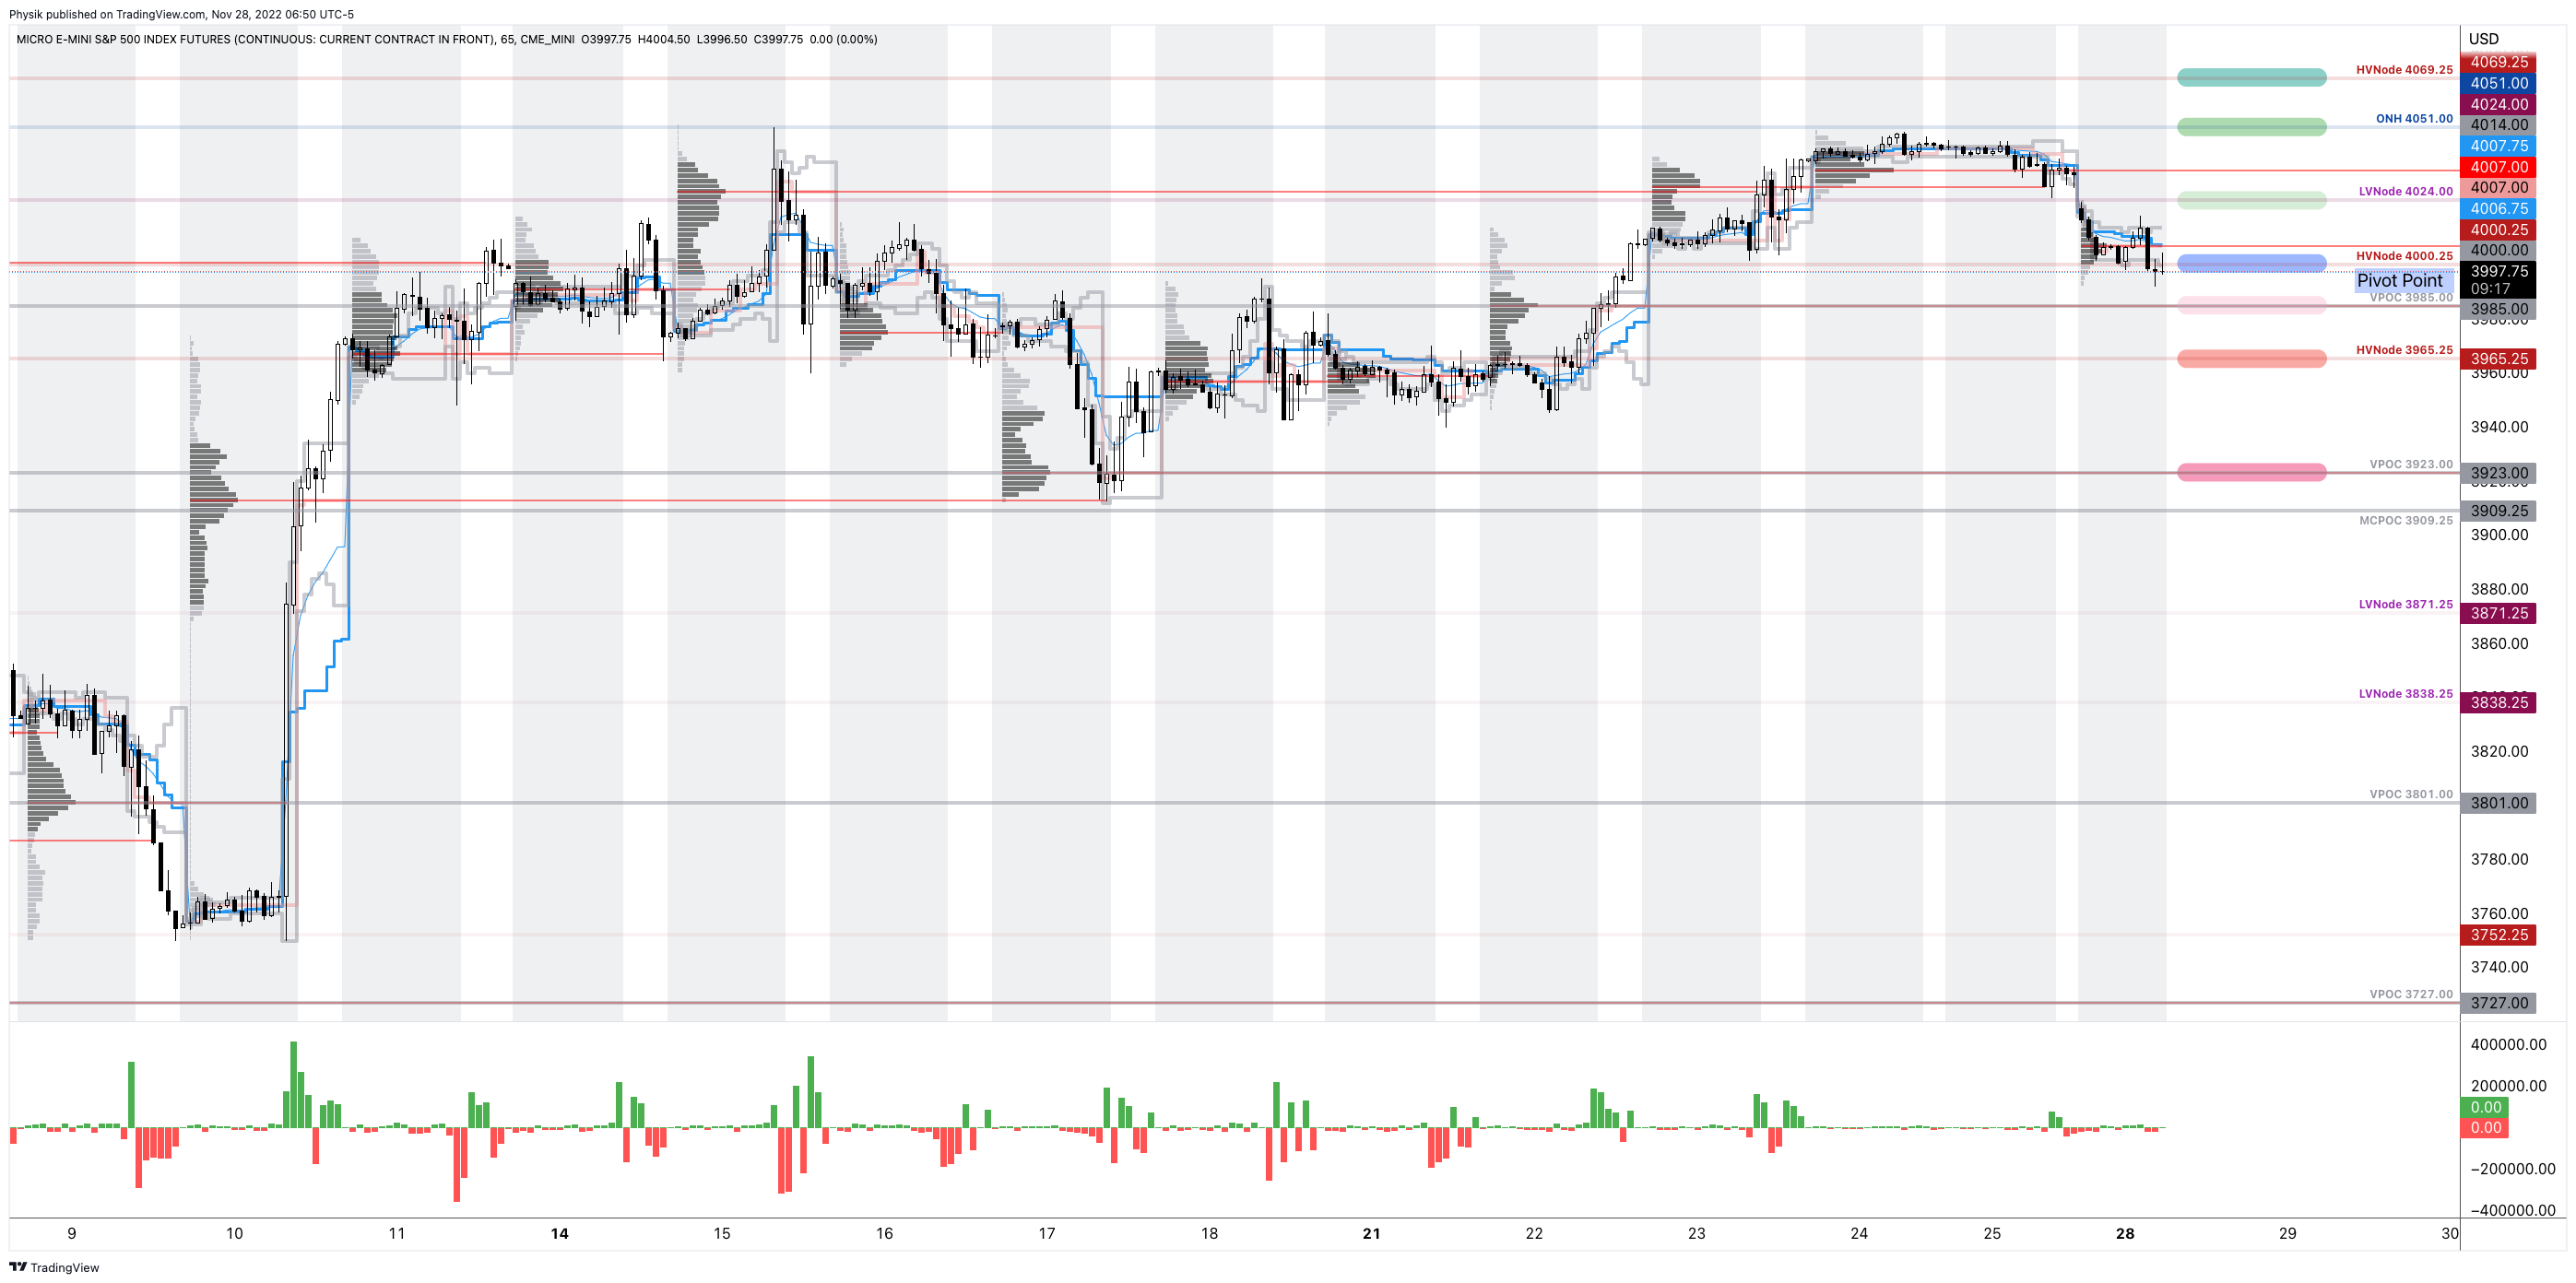
As of 6:45 AM ET, Monday’s regular session (9:30 AM – 4:00 PM ET), in the S&P 500, is likely to open in the lower part of a negatively skewed overnight inventory, outside of prior-range and -value, suggesting a potential for immediate directional opportunity.
Our S&P 500 pivot for today is $4,000.25.
Key levels to the upside include $4,024.00, $4,051.00, and $4,069.25.
Key levels to the downside include $3,985.00, $3,965.25, and $3,923.00.
Click here to load today’s key levels into the web-based TradingView platform. All levels are derived using the 65-minute timeframe. New links are produced, daily.
Definitions
Overnight Rally Highs (Lows): Typically, there is a low historical probability associated with overnight rally-highs (lows) ending the upside (downside) discovery process.
Volume Areas: A structurally sound market will build on areas of high volume (HVNodes). Should the market trend for long periods of time, it will lack sound structure, identified as low volume areas (LVNodes). LVNodes denote directional conviction and ought to offer support on any test.
If participants were to auction and find acceptance into areas of prior low volume (LVNodes), then future discovery ought to be volatile and quick as participants look to HVNodes for favorable entry or exit.
POCs: POCs are valuable as they denote areas where two-sided trade was most prevalent in a prior day session. Participants will respond to future tests of value as they offer favorable entry and exit.
MCPOCs: POCs are valuable as they denote areas where two-sided trade was most prevalent over numerous day sessions. Participants will respond to future tests of value as they offer favorable entry and exit.
About
After years of self-education, strategy development, mentorship, and trial-and-error, Renato Leonard Capelj began trading full-time and founded Physik Invest to detail his methods, research, and performance in the markets.
Capelj also writes options market analyses at SpotGamma and is a Benzinga journalist.
His past works include private discussions with ARK Invest’s Catherine Wood, investors Kevin O’Leary and John Chambers, the infamous Sam Bankman-Fried of FTX, former Bridgewater Associate Andy Constan, Kai Volatility’s Cem Karsan, The Ambrus Group’s Kris Sidial, the Lithuanian Delegation’s Aušrinė Armonaitė, among many others.
Contact
Direct queries to renato@physikinvest.com or Renato Capelj#8625 on Discord.
Disclaimer
Do not construe this newsletter as advice. All content is for informational purposes.


3 replies on “Daily Brief For November 28, 2022”
[…] you’re betting on lower prices, recommended is a quick reference of Physik Invest’s Daily Brief for November 28, 2022. In short, according to SpotGamma, “there’s less to be lost owning protection down below,” […]
[…] we said earlier this week (November 29, 2022, and November 28, 2022), it’s not a terrible time to hedge, and selling volatility, blindly, on either side of the […]
[…] and “systemic exposure reallocation,” Nomura Holdings Inc’s (NYSE: NMR) Charlie McElligott November 28, 2022, […]