Photo: By Alan Stoddard. Taken on January 11,2018.
Hey, all! I hope you had a great weekend. Today, we dive into what’s driving markets and what the near future may look like. On Monday, we will do deeper dives like this. Friday, we’ll try for recaps. Trade ideas are coming soon via monthly research, which will look similar to this linked document.
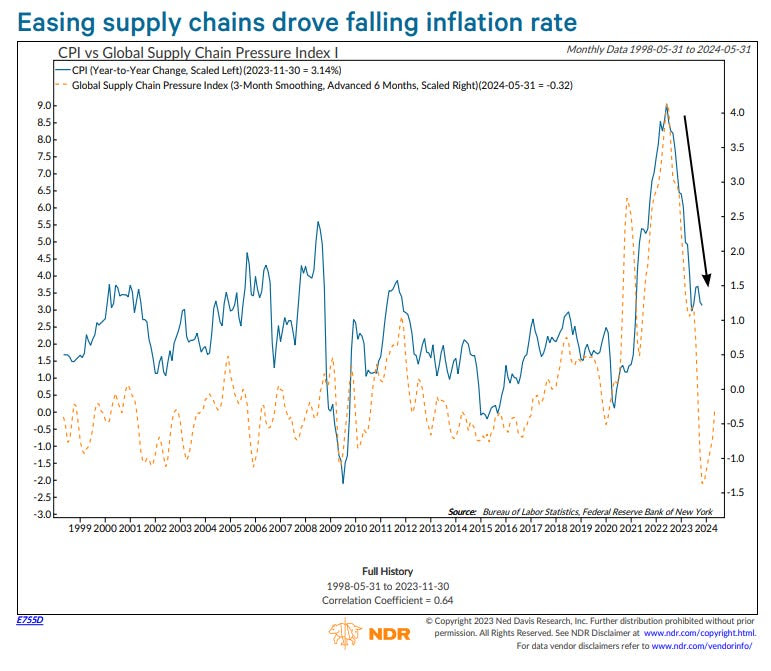
Market momentum slowed with bumps in economic and inflation data last week, yet the trend of economic resilience and declining inflation persists. Anticipation looms over a potential shift in the Federal Reserve’s approach, with traders awaiting Tuesday for insights from Governor Christopher Waller regarding the possibility of a decrease in interest rates.
CrossBorder Capital remarks the economy may avoid recession, attributing this to economic measures adjusted for distortion—an increase in adjusted yields points to a mild recovery in business activity later in the year.
Graphic: Retrieved from CrossBorder Capital. Based on the mortgage curve, they calculate a 10-year Treasury yield 110 basis points higher. A steeper curve implies easier monetary conditions.
Former open markets trader Joseph Wang maintains cautious optimism, foreseeing cuts, albeit less aggressive than the market prices. However, Cem Karsan from Kai Volatility suggests that if anticipated stock struggles and declines reach 10% or more, more decisive, politically motivated actions may be taken ahead of the election.
Graphic: Retrieved from Bloomberg via Joseph Wang. The SOFR term structure provides insights into the market’s expectations for short-term interest rates over various time horizons.
In any case, injecting money into a healthy economy is bullish. That being so, Goldman Sachs foresees the S&P 500 reaching 4,950 to 5,050 by 2025. Wang, emphasizing the potential benefits of both monetary and fiscal stimulus, notes deficit spending ultimately triggers an increase in both yields and risk assets like stocks.
Cryptocurrencies may also benefit, with some anticipating the approval of a bitcoin exchange-traded fund to invigorate a bullish trend akin to the impact of State Street’s Gold Trust on the gold market. However, not all share this optimism, including Tom McClellan, who parallels a situation in 1974 when investors bid up gold prices in anticipation of Americans regaining the right to own gold, only to witness a decline of 41% in prices by August 1976.
Whether higher rates persist or not, specific forces are at play that are unlikely to destabilize the market markedly. Elevated rates give rise to an increased demand for what is termed “one-sided and risky positioning,” elongating the market cycle and reducing short-term volatility through mechanical interventions. This artificial stability sends misleading signals, fostering even more interest in this type of trading. Karsan aptly dubs it the “sumomarket,” echoing Amy Wu Silverman of RBC Capital Markets’ insight that such strategies aren’t indefinite and may sour.
We hedge when we can, not when we must! Traditional reliance on bonds falls short in a landscape where correlations have transformed. During the subdued realized and implied volatility, traders protect against pullbacks, particularly during or after the earnings season, by buying Cboe VIX call options.
In the realm of alternatives, the choice depends on your timeframe and view on price trajectories. We gave explanations last year, revealing options like allocating principal to less risky assets such as box spreads utilized as collateral for margin-intensive trades. For those eyeing the short-term downside, ultra-wide butterflies—equidistant or slightly broken—emerge as a consideration. Contrastingly, if it were 2022, cheaper ratio spreads would be preferred due to the subdued tendencies of implied volatility. However, with “over-positioning into short volatility,” that may no longer be the case.
Photo: By Glenn Halog. Taken on September 17, 2012.
Hey, all! I hope you had a great weekend. We’re sticking to our promise, as shared on Substack. Today, we dive into what’s driving markets and what the near future may look like. Generally speaking, on Monday, we will do deeper dives like this. Friday, we will do recaps. Trade ideas are coming soon via monthly research, which will look similar to this linked document.
That’s a take hot enough to grab your attention, isn’t it? We digress. It’s been a couple of years since central banks began tightening. With it being this late in the economic cycle, the effects of contractionary monetary policy should be felt, right? Well, not as you imagined heading into last year. The economy is strong, and inflation was better managed than anticipated.
Is it that the economy is less sensitive to monetary policy? Citadel’s Kenneth Griffin states that monetary tightening struggles to offset fiscal stimulus. Jerome Powell, Chair of the Federal Reserve, has had his mission to engineer a soft landing complicated. “Whether it is the Inflation Reduction Act or other programs that have increased spending, we keep stimulating the economy out of DC.”
Graphic: Retrieved from Global Financial Data via Meb Faber Research.
That’s the outlook envisioned by some, including Cem Karsan of Kai Volatility. In his analysis, this policy divergence traces back to the era of easy money spanning decades—instances like the Federal Reserve buying long-term bonds, reducing their yields, and steering investors towards riskier assets. A “growth engine” resulted, as Karsan describes it, driving innovation and globalization, accompanied by low inflation and occasional deflation.
The bulk of the stimulus predominantly benefiting the top echelons—corporations focused on profit generation through cost-cutting and expanding market share—contributed to a widening gap between the privileged and the less privileged (i.e., the wealth effect and labor competing globally with other labor and technology). If the current emphasis is on populist fiscal measures (such as increasing the velocity of money by directly injecting funds into the hands of the public and, consequently, into the economy) to address inequality and enhance the average person’s spending capacity, this could be the catalyst for sparking inflation and the potential for elevated yields for years to come.
Photo: By Glenn Halog. Taken on September 17, 2012. View on Flickr here.
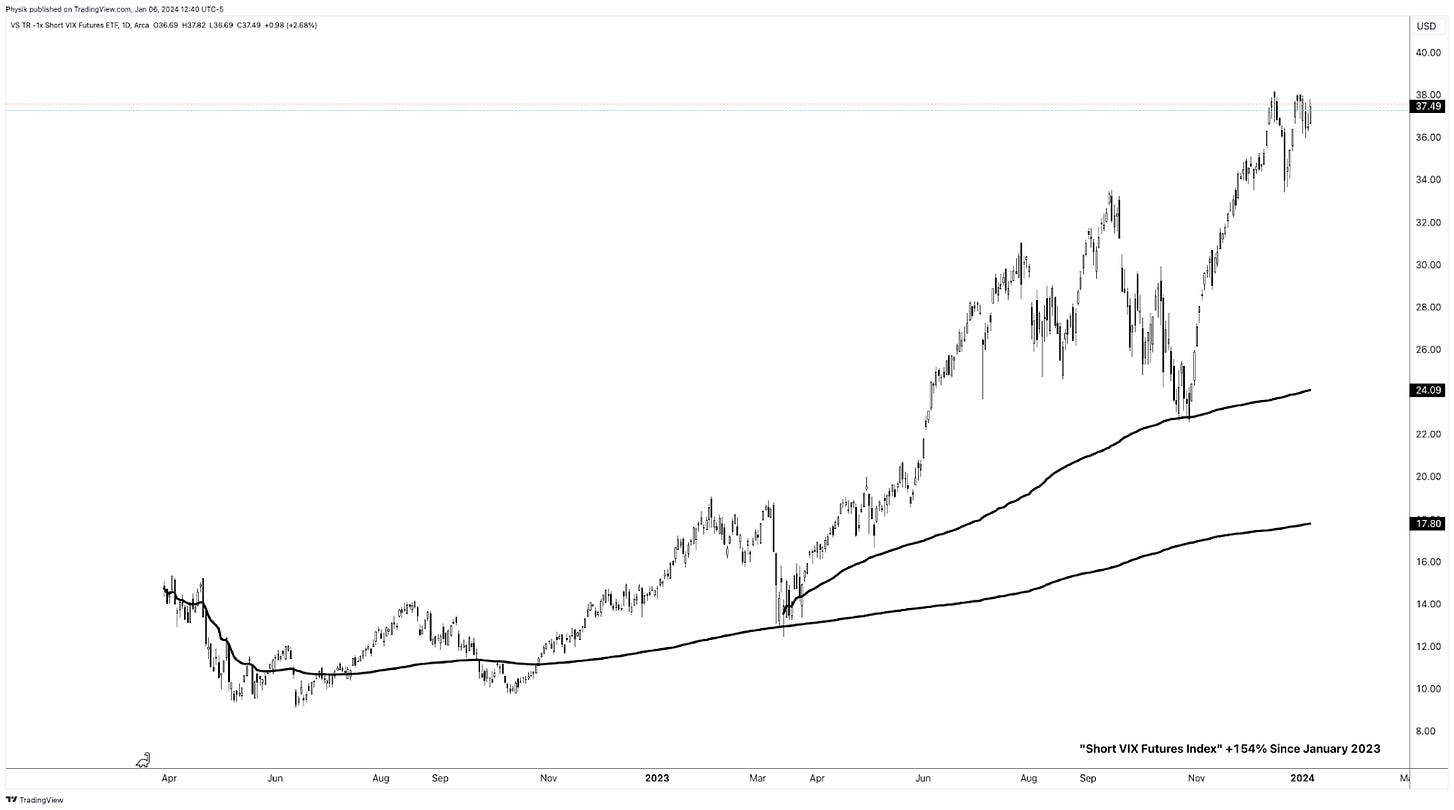
It’s a new era, and as Karsan points out, the tail is getting thicker, indicating a shift towards one-sided and risky positioning. Why is that so? Individuals are hedging the above realities, turning to Treasuries (used as collateral) and short equity options or volatility (the all-encompassing term) to enhance returns.
Graphic: Retrieved from TradingView. Pictured is the short VIX Futures ETF.
“If you remember 2017, right before we got into Volmageddon in February 2018, the volatility environment smelled similar to right now,” Amy Wu Silverman, head of derivatives strategy at RBC Capital Markets, shared with Bloomberg. “It works until it doesn’t.”
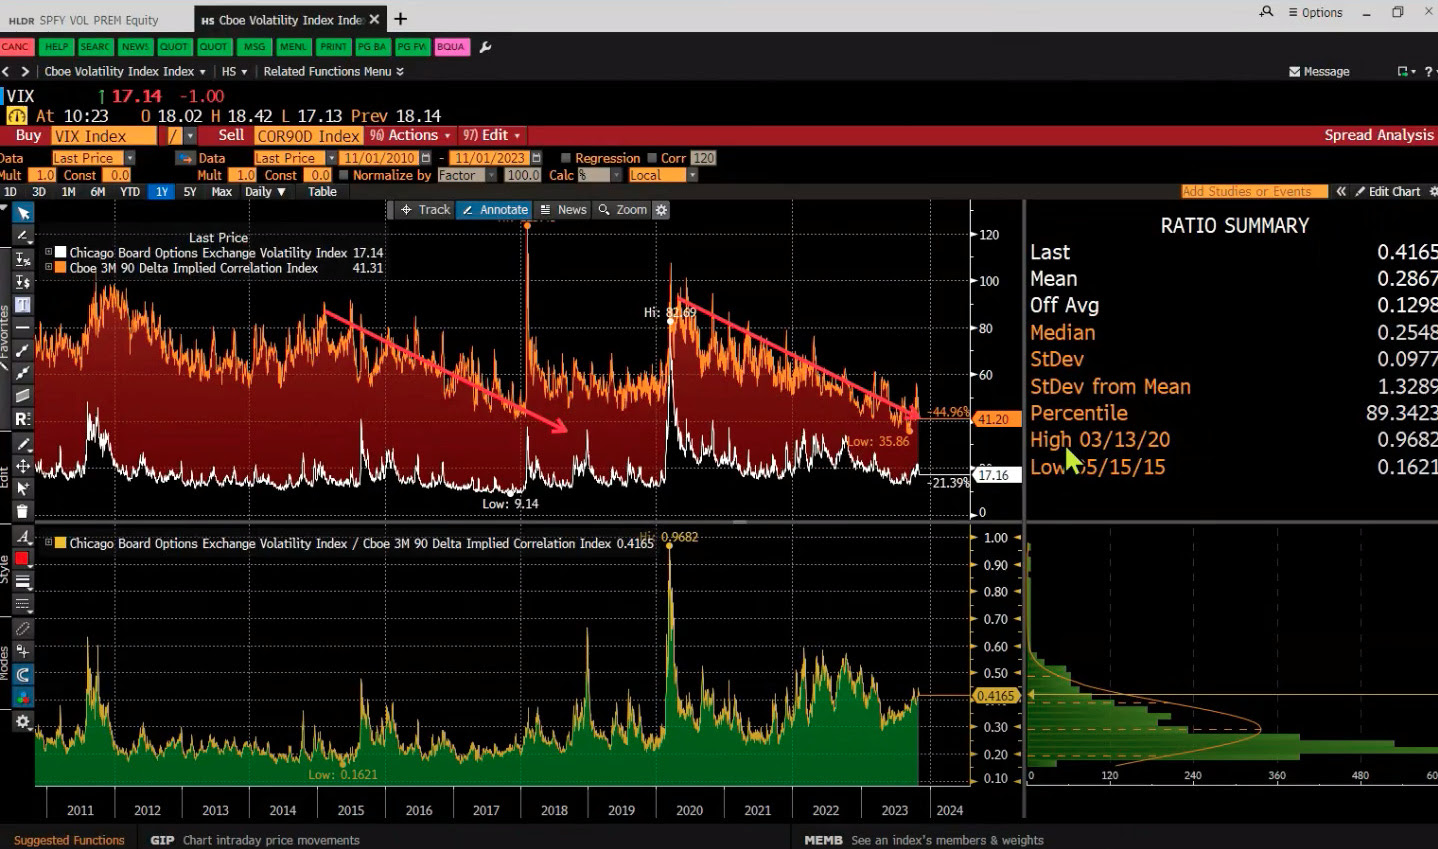
Graphic: Retrieved from Bloomberg via Simplify Asset Management’s Michael Green. Implied correlation for a 90 Delta call or 10 Delta put. Given the current volatility level, the implied correlation is lower than expected, indicating potential market vulnerability or “deeply unhealthy” conditions.
Kris Sidial from The Ambrus Group explains highly responsive spot-vol beta results. For example, we see quick fluctuations in volatility measures like the Cboe’s Volatility Index or VIX. He adds it’s a crowding of the dispersion trade, where participants shift from underperforming longer-dated options to shorter-dated ones for purposes like hedging, directional trading, and yield enhancement. This activity supports and stabilizes the indexes while the individual components underneath occasionally fluctuate pretty drastically. The only way to reconcile these fluctuations is through a decrease in correlation.
This environment is reminiscent of the 1999 to 2000 period, mentioned by Michael Green from Simplify Asset Management during a pre-event call for a Benzinga appearance. Despite the costliness of growth stocks in the late nineties, they still managed to double and triple.
In this scenario, the go-to trade of stocks and bonds (e.g., 60/40) may be less effective. Instead, at least over the short term, one could own long-term call options while selling stocks. Why? Karsan says that volatility “pinning leads to a momentum factor” that sustains itself. As yields rise, more liquidity flows into alternatives like structured products. With index volatility subdued and at a lower limit, positive flows persist until more significant market trends take over.
Graphic: Retrieved from Danny Kirsch of Piper Sandler. On December 18, the S&P 500’s price and SPX’s $4,800 strike option volatility were up.
Looking ahead to 2024, Fabian Wintersberger predicts a higher stock market, dismissing concerns of a second wave of inflation in 2024. The changes in the money supply typically impact the broader economy with an 18-month lag, implying projected rate cuts in 2024 may not affect inflation until 2025 or 2026.
“It seems that the Fed’s and the ECB’s projections are too high, and inflation might turn into deflation in the second half of 2024.” Otherwise, we’re likely in the seventh or eighth inning because higher real yields are starting to come through the economy, Griffin states, noting the Federal Reserve will likely make it clear they will get near a 2% rate in time, stabilizing as best they can employment and prices.
Graphic: Retrieved from Bloomberg. A recent quarterly refunding announcement spurred a rally in bonds and equities. Generally, a weak dollar and lower rates ease financial conditions. That’s good for stocks.
“[Jerome Powell] had a horrible hand to play. We’ve had the pandemic supply chain shocks and massive fiscal stimulus. And he’s supposed to try to achieve price stability. That’s a no-win scenario.”
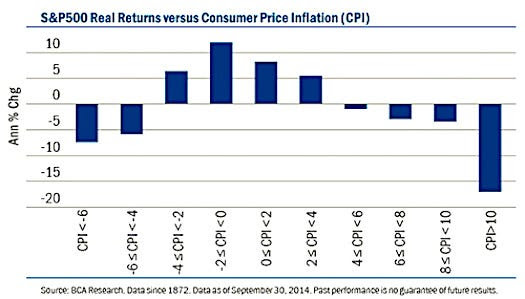
Graphic: Retrieved from BCA Research.
As interest rates decline, the discussed structured product trades and dispersion flows might slow or reverse. The question arises: will the diminishing volatility supply compound challenges arising from weakened macro liquidity, potentially outweighing the anticipated benefits of interest rate cuts and stimulative fiscal measures? We’re working on unraveling this.
While euphoria seems scarce and fragility is not prominently signaled, as Sidial points out, the telltale signs will come as an “explosion” of convexity in the 3-, 5-, and 7-day terms of the volatility structure, as noted by Karsan. Until these signs emerge, former open markets desk trader Joseph Wang suggests cautious optimism, advocating for bullishness amid digestion in terms of time or price.
Graphic: “The market averages three 5% corrections a year,” explains Jay Woods of Freedom Capital Markets, who foresees a touch of ~$4,600 in the S&P 500 ($460 SPY) as a likely scenario. “It isn’t abnormal.”