
Market Commentary
Equity index futures, bonds, commodities sideways to higher. Yields, dollar lower.
- Narratives collide; side with fear or greed?
- Ahead is data on claims, trade, and more.
- Indexes positioned for directional resolve.
What Happened: U.S. stock index futures auctioned sideways overnight ahead of Friday’s key nonfarm payrolls release.
Ahead is data on jobless claims, trade balance, productivity, core capital goods orders, and unit labor costs (8:30 AM ET), as well as factory orders (10:00 AM ET).
What To Expect: As of 6:30 AM ET, Thursday’s regular session (9:30 AM – 4:00 PM EST) in the S&P 500 will likely open inside of prior-range and -value, suggesting a limited potential for immediate directional opportunity.
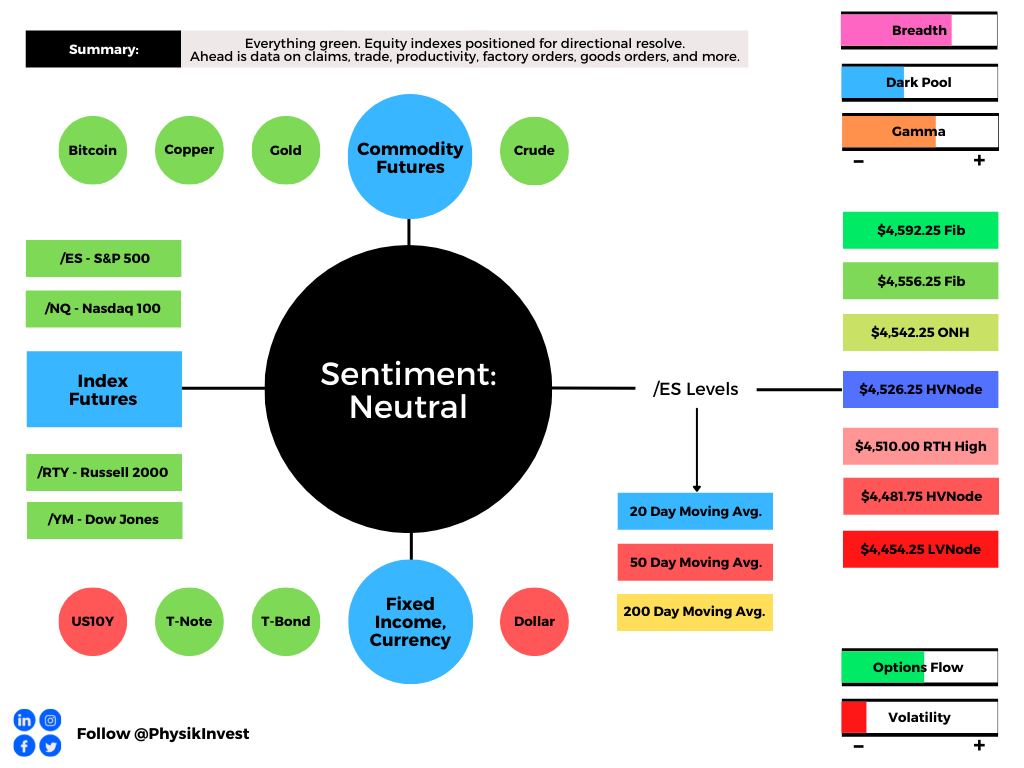
Adding, during the prior day’s regular trade, on positive, albeit middling intraday breadth and divergent market liquidity metrics, the best case outcome occurred, evidenced by sideways trade just shy of the $4,542.25 overnight all-time high (ONH).
Overnight Rally Highs (Lows): Typically, there is a low historical probability associated with overnight rally-highs (lows) ending the upside (downside) discovery process.
This is significant because it marked balance and acceptance, or a willingness to transact at higher prices. We’re carrying forward, though, the presence of poor structure.
Balance (Two-Timeframe Or Bracket) Is The Status Quo: Rotational trade that denotes current prices offer favorable entry and exit. Balance-areas make it easy to spot a change in the market (i.e., the transition from two-time frame trade, or balance, to one-time frame trade, or trend).
Modus operandi is responsive trade (i.e., fade the edges), rather than initiative trade (i.e., play the break).
Further, the aforementioned trade is happening in the context of peak growth and a moderation in the economic recovery, as well as some of the dynamics unpacked in-depth Tuesday (e.g., non-seasonally aligned inflows, impactful options market dynamics, divergent sentiment, and fears of a mid-cycle transition).
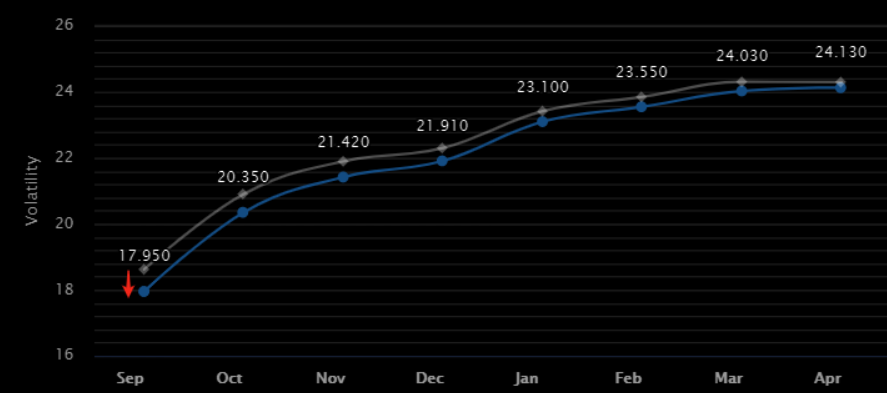
Though some of the implications of these themes on price are contradictory (e.g., inflows and declining sentiment), participants aren’t rushing to protect against short-term risks. This is most obvious via a shift lower in shorter-dated VIX expiries, a dynamic more so positive for near-term equity market stability.
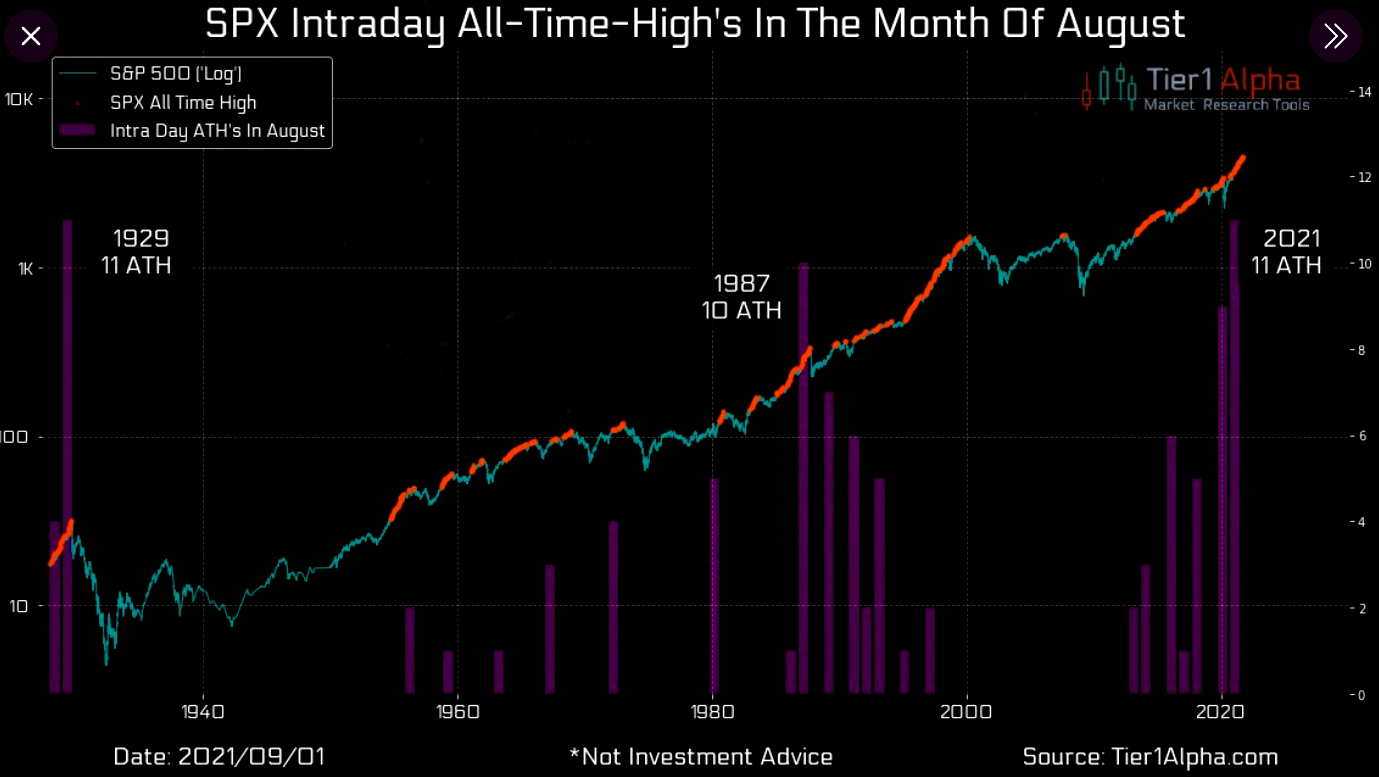
That said, context is above all; walls of worry – inadvertently – push markets higher. Given that seasonality norms are breaking (as evidenced by non-seasonally aligned inflows), among other things, there may be more waiting before that long-awaited pullback comes to fruition.
As Robert Shiller once said: “Part of the reason we had the Great Depression is people were aware of crowd psychology. Every day, they were watching the stock price index as a barometer of the health of the economy, and that made it more volatile.” So, how much fear has to come into the market for things to turn?
Fears of a top have been called too many times. Nonetheless, we watch upcoming releases such as Friday’s data on nonfarm payrolls for clues.
Moreover, for today, given an increased potential for middling volatility and responsive trade, participants may make use of the following frameworks.
In the best case, the S&P 500 trades sideways or higher; activity above the $4,526.25 high volume area (HVNode) puts in play the $4,542.25 overnight high (ONH). Initiative trade beyond the ONH puts in play the $4,556.25 and $4,592.25 Fibonacci extensions.
In the worst case, the S&P 500 trades lower; activity below the $4,526.25 HVNode puts in play the $4,510.00 level, a regular trade high (RTH High), and gap. Initiative trade beyond the RTH High and gap puts in play the $4,481.75 HVNode and $4,454.25 LVNode.
Volume Areas: A structurally sound market will build on past areas of high volume. Should the market trend for long periods of time, it will lack sound structure (identified as a low volume area which denotes directional conviction and ought to offer support on any test).

If participants were to auction and find acceptance into areas of prior low volume, then future discovery ought to be volatile and quick as participants look to areas of high volume for favorable entry or exit.

POCs: POCs are valuable as they denote areas where two-sided trade was most prevalent. Participants will respond to future tests of value as they offer favorable entry and exit.

Responsive Buying (Selling): Buying (selling) in response to prices below (above) an area of recent price acceptance.

News And Analysis
Hurricane Ida to boost oil and gas companies’ margins.
OPEC sticks with its supply hike as demand improves.
China warns climate cooperation is at risk over tension.
Bank buybacks hit record helping push stocks to highs.
Non-fungible tokens (NFTs) from a trader’s perspective.
U.S. lodging recovery trajectory is on track despite delta.
Bill Gross said yields make bond investment garbage.
The ECB will likely slow down the pace of bond buying.
U.S. STB rejected voting trust for CN’s KCS acquisition.
New York City declares a state of emergency over rain.
Hurricane Ida losses short of Katrina totals, to hit $25B.
What People Are Saying
About
After years of self-education, strategy development, and trial-and-error, Renato Leonard Capelj began trading full-time and founded Physik Invest to detail his methods, research, and performance in the markets.
Additionally, Capelj is a finance and technology reporter. Some of his biggest works include interviews with leaders such as John Chambers, founder and CEO, JC2 Ventures, Kevin O’Leary, businessman and Shark Tank host, Catherine Wood, CEO and CIO, ARK Invest, among others.
Disclaimer
At this time, Physik Invest does not manage outside capital and is not licensed. In no way should the materials herein be construed as advice. Derivatives carry a substantial risk of loss. All content is for informational purposes only.