Notice: To view this week’s big picture outlook, click here.
What Happened: Alongside uncertainty surrounding Senate runoffs and new COVID lockdowns, U.S. index futures balanced overnight after Monday’s rapid sell-off.
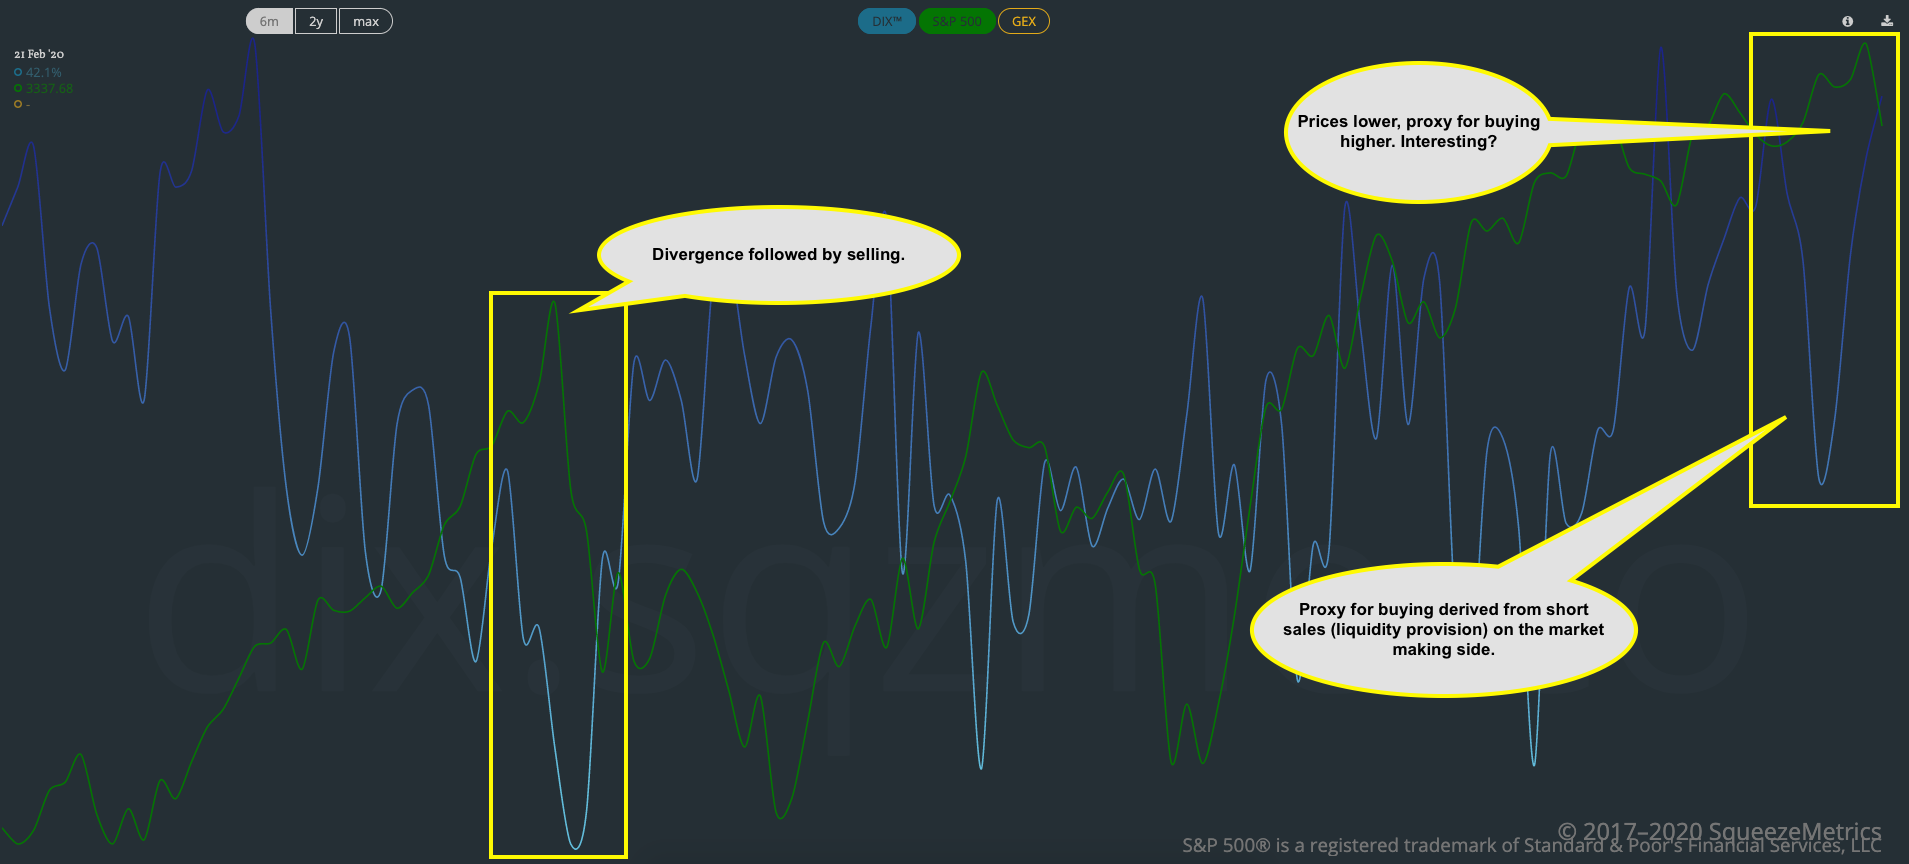
What Does It Mean: During last Thursday’s session, initiative buying, in the S&P 500, diverged prices from value. This dynamic resolved itself in Monday’s regular trade.
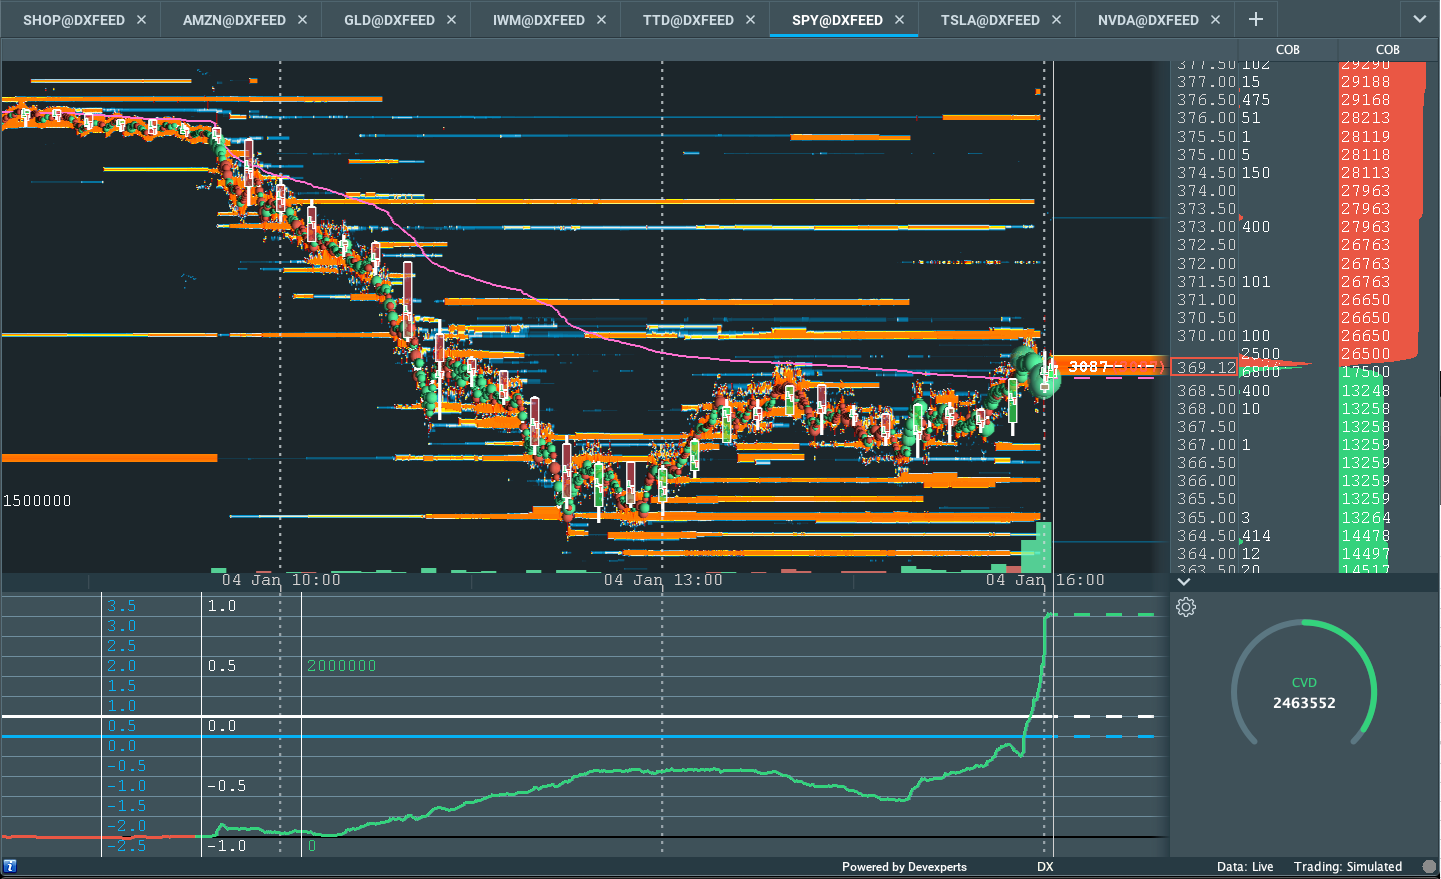
Overnight, prices recovered off their lows, but encountered responsive selling at the $3,705.00 low-volume node (LVNode).
What To Expect: Tuesday’s regular session (9:30 AM – 4:00 PM ET) will open inside of prior-balance and -range.
Adding, participants will come into today’s session knowing the following: (1) short-term, technically-driven market traders were not able to defend last week’s advance on tapering, holiday volumes, (2) weekend trade established a new all-time high (i.e., historically, there is a low probability that overnight all-time highs end the upside discovery process), (3) increased capital was not committed into the lows, evidenced by a divergent delta (i.e., the difference between buying and selling pressure), (4) the auction is resisting the low-volume area above $3,705.00, leaving a ledge, (5) a proxy for buying derived from short sales (i.e., liquidity provision on the market making side) rose, (6) bearish activity was concentrated in shorter-dated options.

Given the above dynamics, the following framework applies:
The S&P 500 will likely open within prior-balance and -range, so volatility will likely be high. The go/no-go level for upside is the $3,705.00 ledge which has repeatedly attracted responsive selling. Should prices auction off the ledge, into the low-volume area, the likelihood of continuation increases substantially. In such case, participants would then monitor for a response at the $3,727.25 high-volume node (HVNode), which also corresponds with a 61.80% fibonacci retracement.
Noting: High-volume areas represent value and have the tendency to attract price. Should the market auction into the high-volume area, then prices should slow as balanced, two-sided trade takes over (i.e., the region offers attractive entry and exit). Auctioning through the high-volume area would be the most positive outcome.
Breaking below Monday’s regular-trade low would be the most negative outcome. In that case, participants would monitor for responses at the high-volume node near $3,610.00 and the $3,597.50 anchored, volume-weighted average price.
Levels Of Interest: $3,705.00 LVNode.
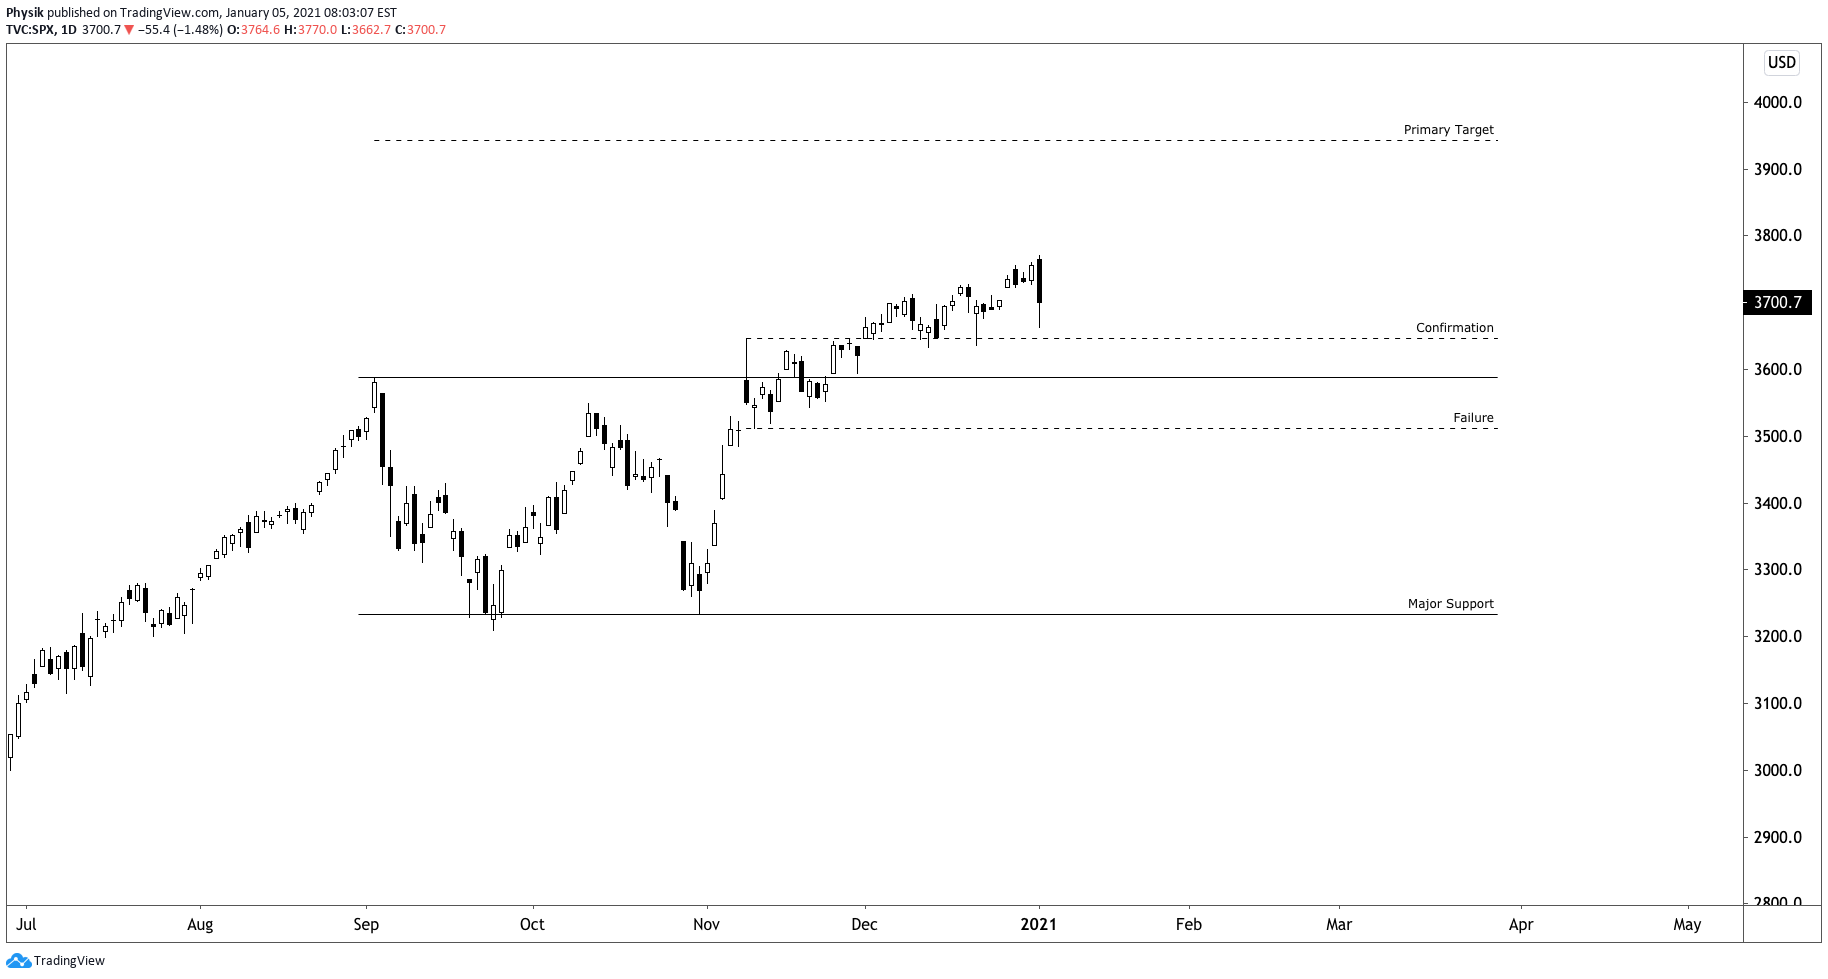
Overall: The higher-time frame breakout in the S&P 500 remains intact. Caution warranted.