
Market Commentary
Equity index futures continued yesterday’s late-day liquidation.
- Chop-chop: Fed nears time to taper.
- Busy morning in regards to releases.
- Range is wide; volatility may persist.
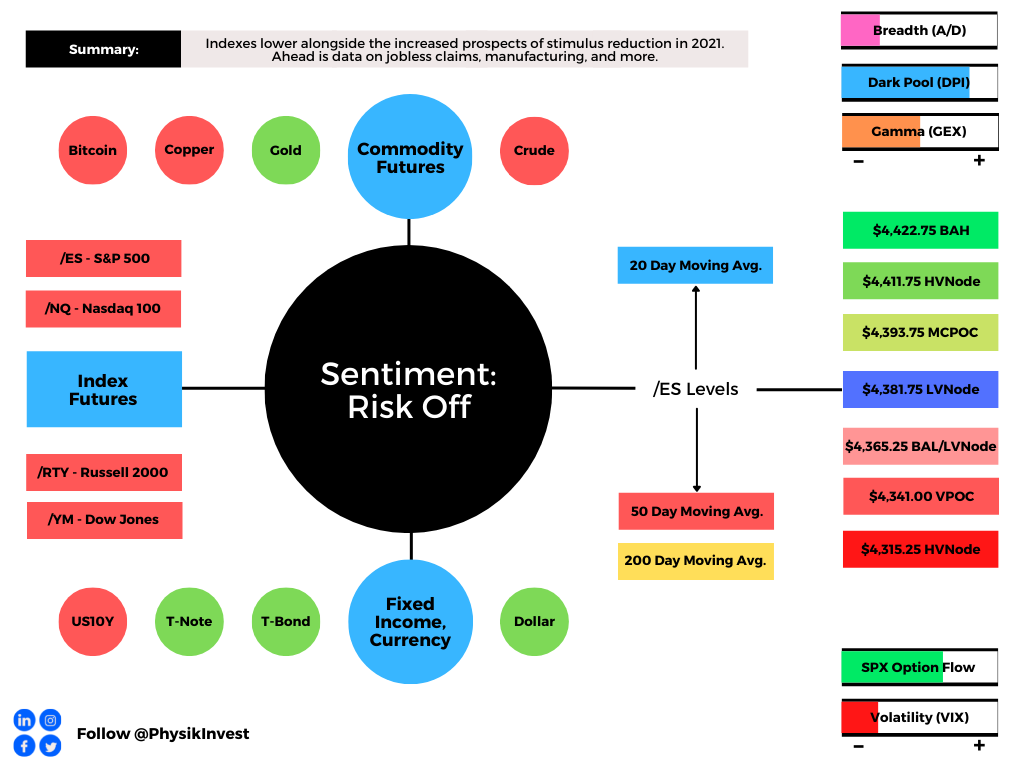
What Happened: U.S. stock index futures auctioned lower overnight alongside the increased prospects of stimulus reduction in 2021.
Ahead is data on jobless claims (8:30 AM ET), Philadelphia Fed manufacturing index (8:30 AM ET), and the index of leading economic indicators (10:00 AM ET).
What To Expect: As of 6:45 AM ET, Thursday’s regular session (9:30 AM – 4:00 PM EST) in the S&P 500 will likely open outside of prior-range and -value, suggesting a higher potential for immediate directional opportunity.
Adding, during the prior day’s regular trade, on weak intraday breadth and market liquidity metrics, the worst-case outcome occurred, evidenced by a close below the $4,422.75 balance area high (BAH) and 20-day simple moving average (SMA).
This is significant because the BAH marked a go/no-go level on a prior breakout and the SMA – a metric that ought to solicit a response by short-term (i.e., technically driven) participants who may be unable to defend retests – broke. As a result of this failure, odds supported the move to the $4,365.25 balance area low (BAL), the lower end of the balance.
Gap Scenarios In Play: Gaps ought to fill quickly. Should they not, that’s a signal of strength; do not fade. Leaving value behind on a gap-fill or failing to fill a gap (i.e., remaining outside of the prior session’s range) is a go-with indicator.

Auctioning and spending at least 1-hour of trade back in the prior range suggests a lack of conviction; in such a case, do not follow the direction of the most recent initiative activity.
Further, the aforementioned trade is happening in the context of a shift in the tapering debate, ahead of the Jackson Hole Economic Policy Symposium August 26-28, 2021. This theme’s implications on price are contradictory; to elaborate, the summary of the late July Federal Open Market Committee (FOMC) meeting suggests an inclination to start reducing the pace of asset purchases this year.
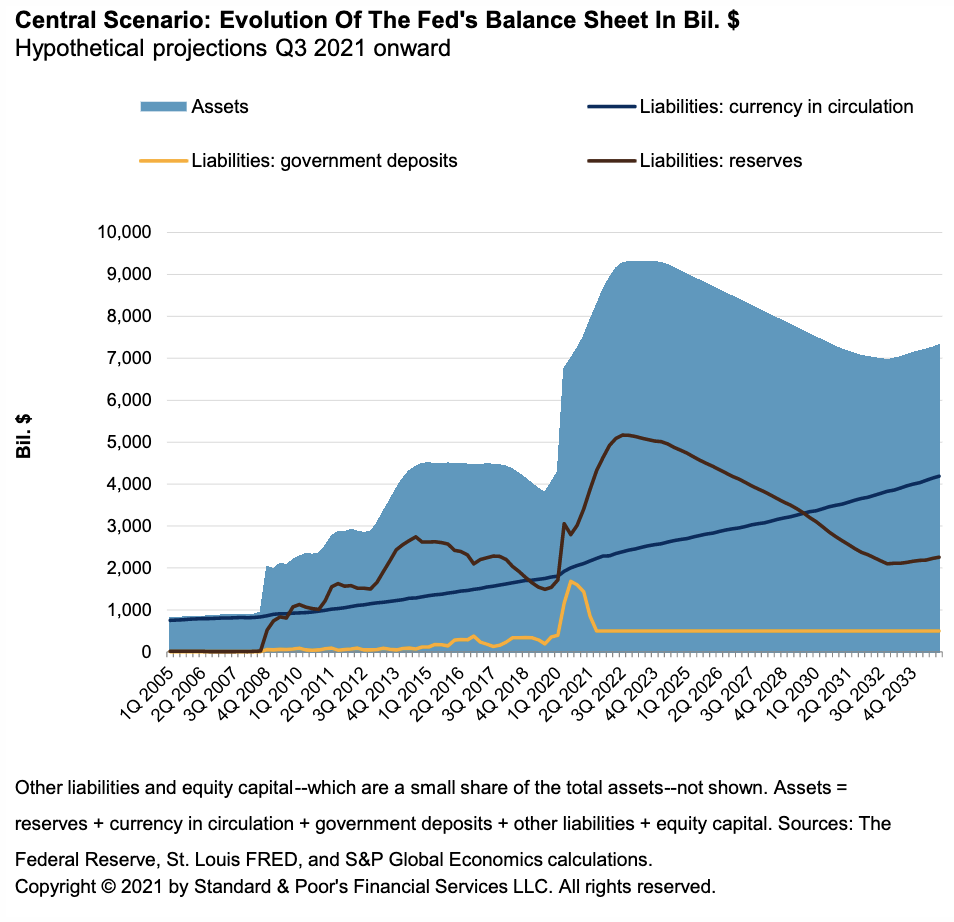
As an aside, markets went on a historic tear over the past year or so given monetary frameworks and max liquidity, so to speak. Add in the growth of derivatives exposure and potential for offsides positioning, even the slightest reduction in the Federal Reserve’s balance sheet – the removal of liquidity – has the potential to prompt a cascading reaction that exacerbates underlying price movements.
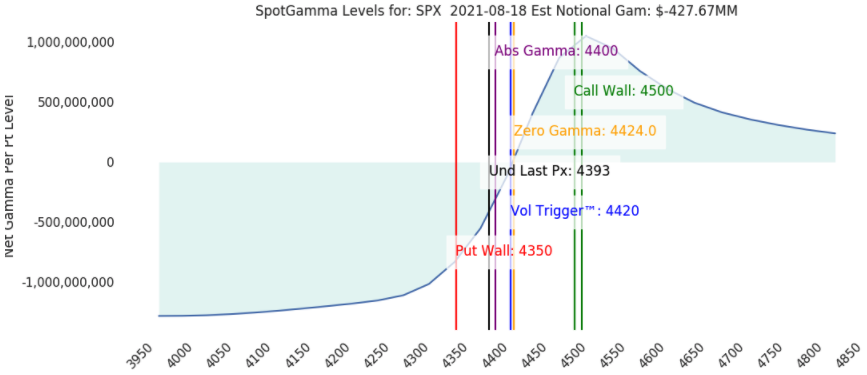
As Kai Volatility’s Cem Karsan, in a conversation with me for a Benzinga article, said: “It’s not a coincidence that the mid-February to mid-March 2020 downturn literally started the day after February expiration and ended the day of March quarterly expiration. These derivatives are incredibly embedded in how the tail reacts and there’s not enough liquidity, given the leverage, if the Fed were to taper.”
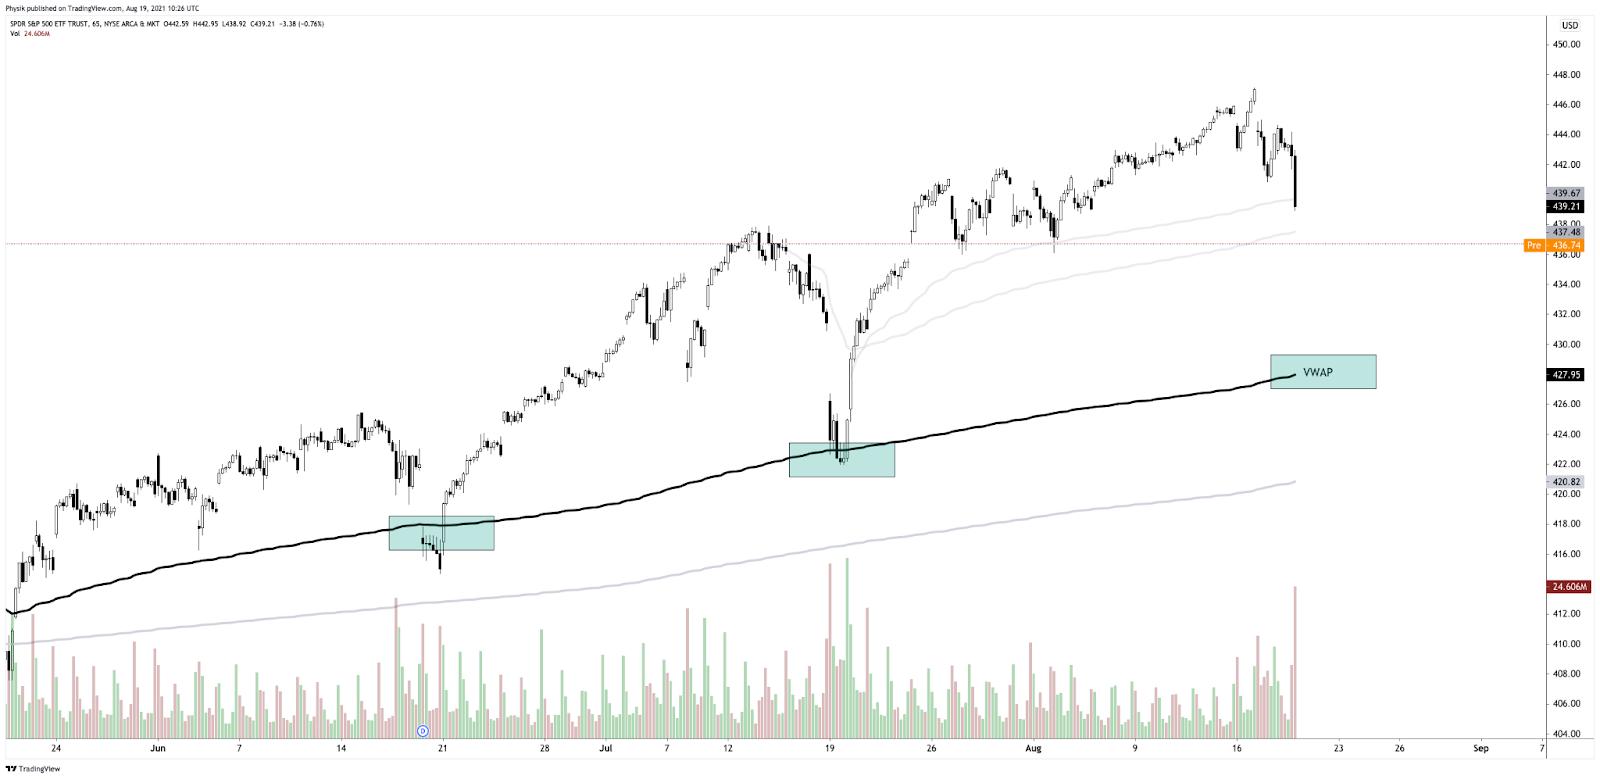
Moreover, for today, in light of higher volatility and responsive trade expectations – given overextension from value (i.e., fair prices for two-sided trade as derived from the volume profile) and a test of a key anchored volume-weighted average price (VWAP) – participants may make use of the following frameworks.
More On Volume-Weighted Average Prices (VWAPs): A metric highly regarded by chief investment officers, among other participants, for quality of trade. Additionally, liquidity algorithms are benchmarked and programmed to buy and sell around VWAPs.
In the best case, the S&P 500 trades sideways or higher; activity above the $4,381.75 low volume area (LVNode) pivot puts in play the $4,393.75 micro composite point of control (MCPOC). Initiative trade beyond the MCPOC could reach as high as the $4,411.75 high volume area (HVNode) and the aforementioned $4,422.75 BAH.
In the worst case, the S&P 500 trades lower; activity below the $4,381.75 low volume area (LVNode) puts in play the $4,365.25 BAL/LVNode. Initiative trade beyond the BAL/LVNode could reach as low as the $4,341.00 untested point of control (VPOC) and $4,315.25 HVNode.
Volume Areas: A structurally sound market will build on past areas of high volume. Should the market trend for long periods of time, it will lack sound structure (identified as a low volume area which denotes directional conviction and ought to offer support on any test).

If participants were to auction and find acceptance into areas of prior low volume, then future discovery ought to be volatile and quick as participants look to areas of high volume for favorable entry or exit.

POCs: POCs are valuable as they denote areas where two-sided trade was most prevalent. Participants will respond to future tests of value as they offer favorable entry and exit.

News And Analysis
Landlords from Florida to California are jacking up rents.
COVID vaccines are less effective against new variants.
UK Fintech market runs hot but fear of bubble premature.
Tencent warns of more China tech curbs after growth hit.
A closer look at the investment/speculative-grade divide.
US restaurants up prices to offset labor inflation, demand.
Disenchanted investors help drive the record gold prices.
A complete Fed balance sheet normalization years away.
What People Are Saying
About
After years of self-education, strategy development, and trial-and-error, Renato Leonard Capelj began trading full-time and founded Physik Invest to detail his methods, research, and performance in the markets.
Additionally, Capelj is a finance and technology reporter. Some of his biggest works include interviews with leaders such as John Chambers, founder and CEO, JC2 Ventures, Kevin O’Leary, businessman and Shark Tank host, Catherine Wood, CEO and CIO, ARK Invest, among others.
Disclaimer
At this time, Physik Invest does not manage outside capital and is not licensed. In no way should the materials herein be construed as advice. Derivatives carry a substantial risk of loss. All content is for informational purposes only.