Physik Invest’s Daily Brief is read by thousands of subscribers. You, too, can join this community to learn about the fundamental and technical drivers of markets.
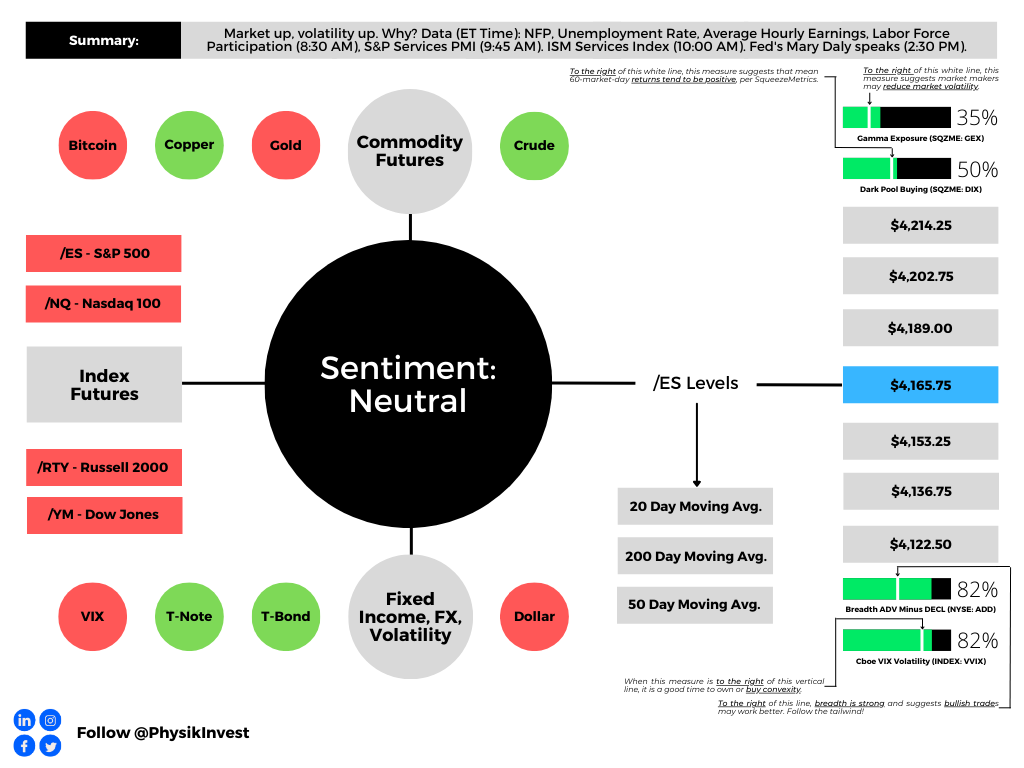
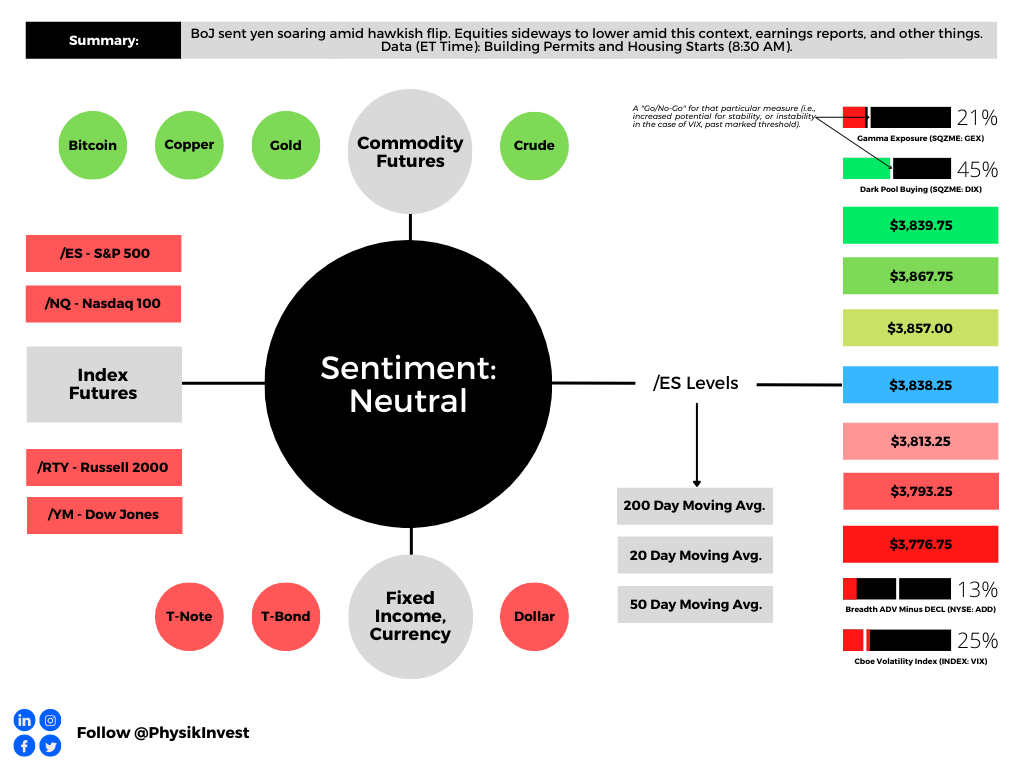
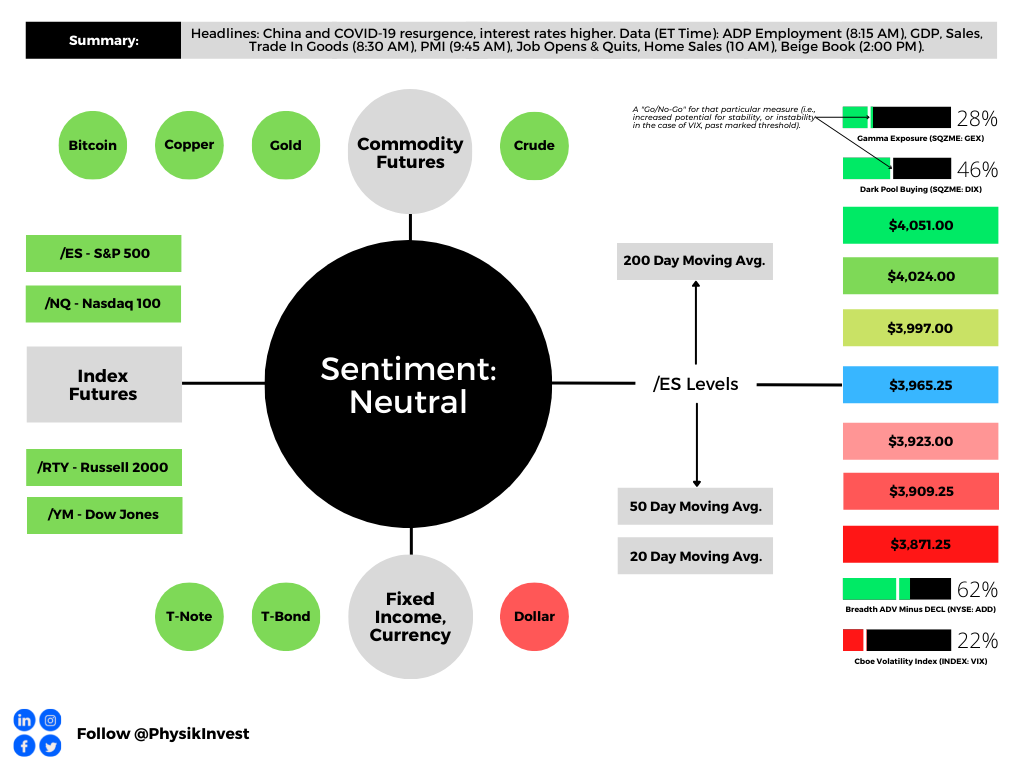
Graphic updated 8:20 AM ET. Sentiment Neutral if expected /ES open is inside of the prior day’s range. /ES levels are derived from the profile graphic at the bottom of this letter. Click here for the latest levels. SqueezeMetrics Dark Pool Index (DIX) and Gamma (GEX) with the latter calculated based on where the prior day’s reading falls with respect to the MAX and MIN of all occurrences available. A higher DIX is bullish. At the same time, the lower the GEX, the more (expected) volatility. Click to learn the implications of volatility, direction, and moneyness. Breadth reflects a reading of the prior day’s NYSE Advance/Decline indicator. The CBOE VIX Volatility Index (INDEX: VVIX) reflects the attractiveness of owning volatility.
Positioning
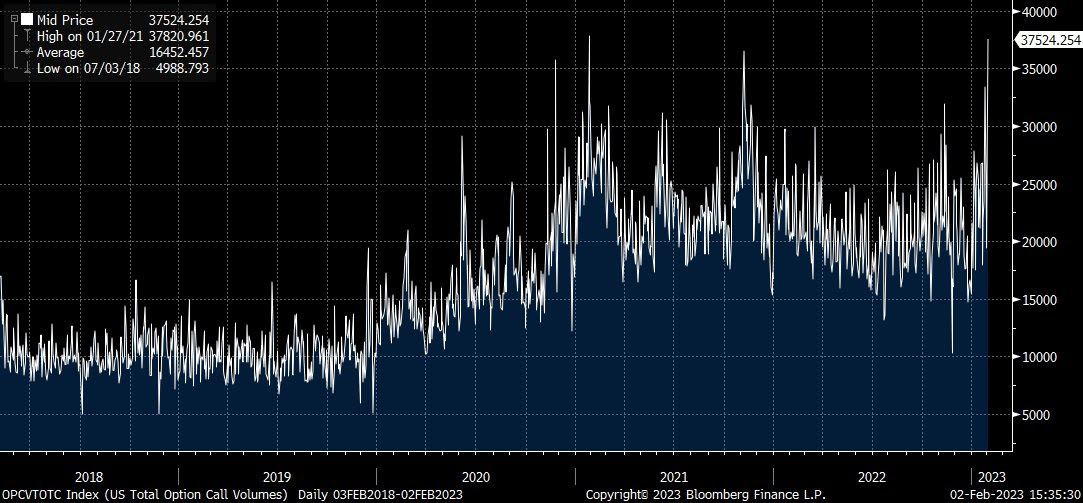
The Federal Reserve’s (Fed) decision to increase its benchmark interest rate by 25 basis points kicked off a bout of strength, boosted by the compression of wound implied volatility (IVOL). This volatility compression we observed with a shift lower in the IV term structure in the S&P 500 (INDEX: SPX). Follow-on strength surfaced on Thursday and, based on an analysis of top-line IVOL measures such as the Cboe Volatility Index (INDEX: VIX) trending higher with the SPX, it was, in part, from traders’ demands for call options, hence high call option volumes.
Graphic: Retrieved from Bloomberg via Danny Kirsch on 2/2/2023.
Recall our detailed letter published prior to February 2, 2023 (e.g., February 1, 2023, January 26, 2023, and beyond). The context was set for the SPX and VIX to trend higher; traders bidding up call options due to their fear of missing out, in the context of less liquidity to absorb those demands, would be beneficial to owners of structures like call option butterflies and ratio spreads. Additionally, owning such structures would help dampen the impact of potential SPX downside on portfolios.
For instance, on January 25, 2023, this letter said trades structured in the indexes such as the Nasdaq 100 (INDEX: NDX), where there was a steeper skew that would enable us to collect more credit in the options we are short, thereby lowering the cost of the spread we own, looked attractive, given the likelihood that the index would stay strong after the earnings reports of some big movers like Tesla Inc (NASDAQ: TSLA).
In yesterday’s letter update, we said that such trades were working spectacularly. In fact, your letter writer’s trading partner, who “initiated some +1 x -2 (17 FEB 23 13500/14000) [NDX] call ratio spreads for free (i.e., $0.00 debit or better to enter),” saw his spreads price in excess of a $40.00 credit to close, yesterday. That structure went from a $0 debit to open to a $4,000.00 credit to close. Again, nice job Justin. I’m expecting that case study, soon!
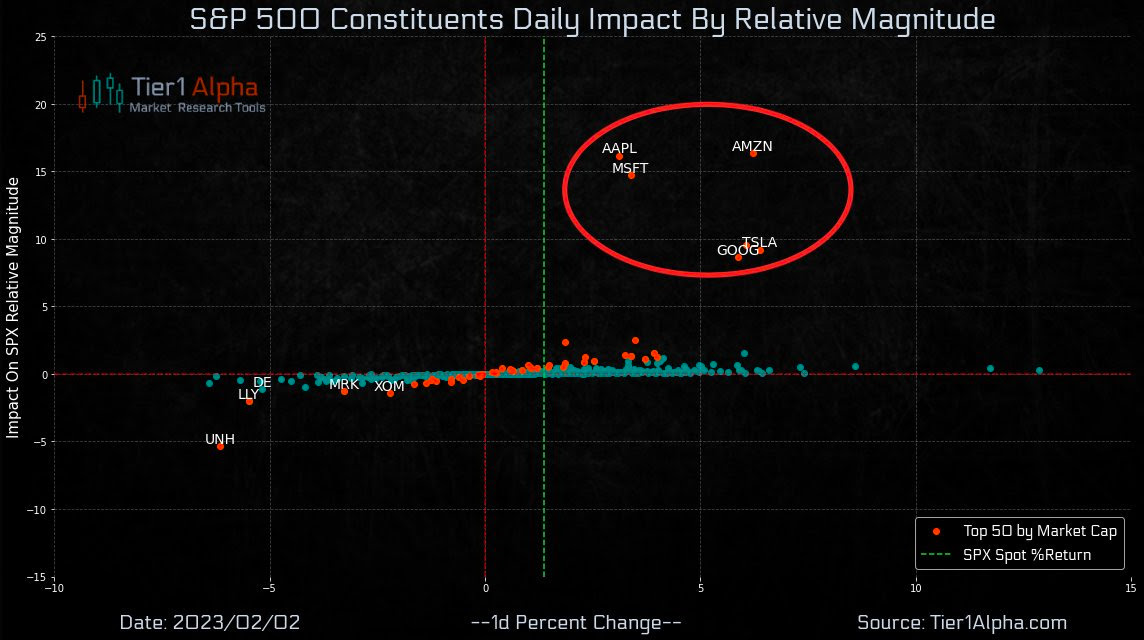
The NDX was probably the best place to be, yesterday, looking at the magnitude of movement in some of the heavyweights in the SPX, yesterday.
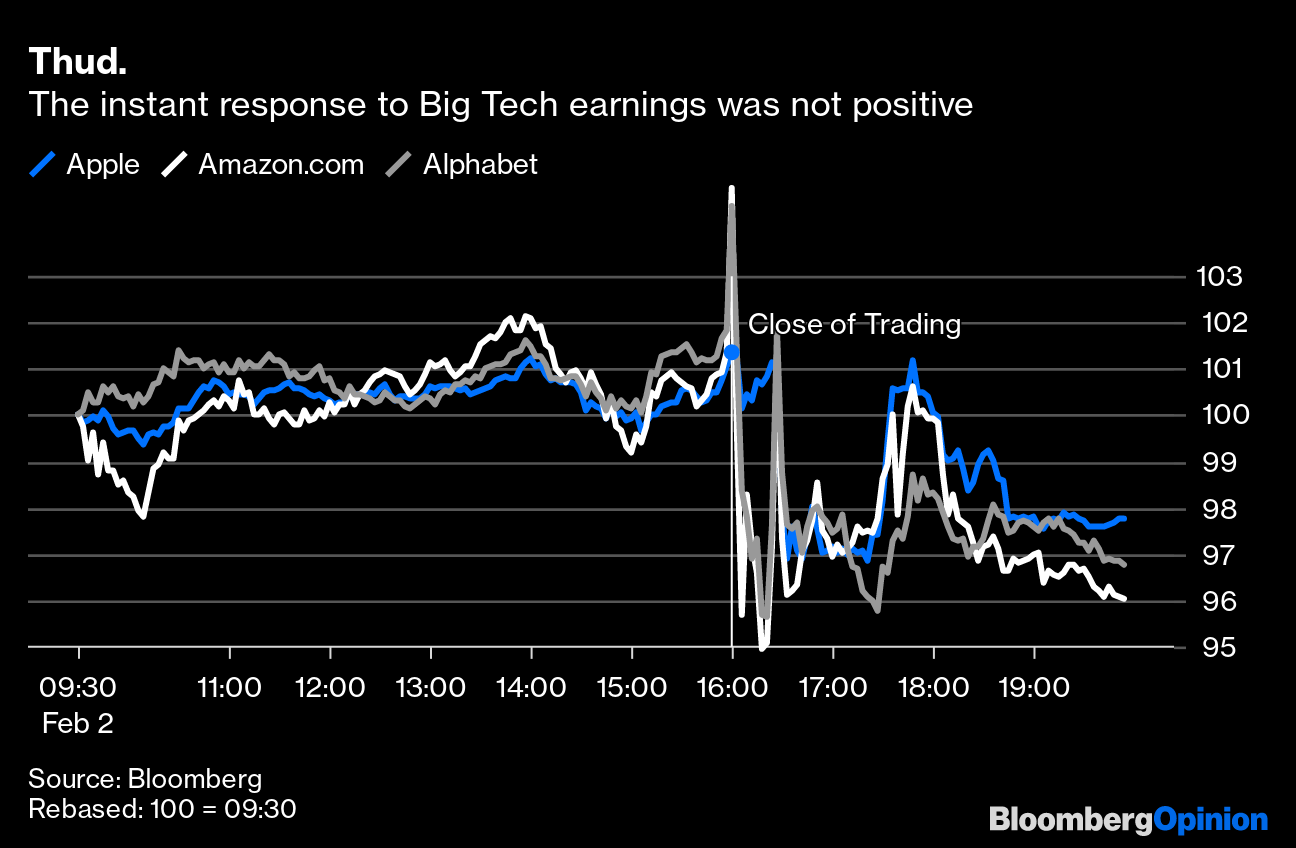
Noteworthy is that many of the strongest performers (e.g., Google, Amazon, Apple) weakened considerably in the after-market when their earnings, and the speeches associated, pointed to some challenges ahead.
Breadth was, generally, not that strong, to add. This validates your letter writer’s belief the market is in a precarious position. Notwithstanding the market’s potential to stay strong into the mid-February timeframe as some strategists believe, the data seems to suggest that “whenever there are two million or more call contracts that exchange hands on the Cboe, future 5- and 10-day returns tend toward being negative (about -1.37% and -2.12% respectively),” SpotGamma said.
SpotGamma added: “This is, in part, because the bullish hedging impact of short-dated call options activity is not long-lasting. Also, IV compressing from a relatively low starting point also does little to bolster long-lasting rallies.”
As further validation for the precariousness the market is in, “[t]he most prominent feature of the 0DTE landscape is actually customer-bought calls way out at $4,200.00 (which would ramp up buying from dealer long-gamma if SPX were to rise to ~$4,170.00.” Per SpotGamma, should “traders’ interest build at or slightly above current SPX prices, then dealers’ hedging may actually result in range suppression or pressure” as time passes and volatility falls. That’s because if a long call option’s probability of finishing in the money at expiration falls, the dealer’s risk falls as well and, so, the dealer can sell some of their hedges. This is market pressure.
As this letter stated, yesterday, knowing that longer-dated SPX IVOL “is cheap, now attractive trades include selling rich call verticals to finance put verticals.”
Per Joseph Wang, the “increasing probability of a second bout of inflation, an issue in the 1970s that the Fed is keen to avoid … [by] retighten[ing] financial conditions … through its balance sheet,” the flow of capital out of capital markets presents more pressure on the financial economy (not necessarily the real economy). Cheap put protection may help hedge the realization of further macro-type market pressure.
As of 8:15 AM ET, Friday’s regular session (9:30 AM – 4:00 PM ET), in the S&P 500, is likely to open in the upper part of a negatively skewed overnight inventory, inside of the prior range, suggesting a limited potential for immediate directional opportunity.
The S&P 500 pivot for today is $4,165.75.
Key levels to the upside include $4,189.00, $4,202.75, and $4,214.25.
Key levels to the downside include $4,153.25, $4,136.75, and $4,122.50.
Disclaimer: Click here to load the updated key levels via the web-based TradingView platform. New links are produced daily. Quoted levels hold weight barring an exogenous development.
Graphic: 65-minute profile chart of the Micro E-mini S&P 500 Futures.
Definitions
Volume Areas: Markets will build on areas of high-volume (HVNodes). Should the market trend for a period of time, this will be identified by a low-volume area (LVNodes). The LVNodes denote directional conviction and ought to offer support on any test.
If participants auction and find acceptance in an area of a prior LVNode, then future discovery ought to be volatile and quick as participants look to the nearest HVNodes for more favorable entry or exit.
POCs: Areas where two-sided trade was most prevalent in a prior day session. Participants will respond to future tests of value as they offer favorable entry and exit.
About
In short, Renato Leonard Capelj is an economics graduate working in finance and journalism.
Capelj spends most of his time as the founder of Physik Invest through which he invests and publishes daily analyses to subscribers, some of whom represent well-known institutions.
Separately, Capelj is an equity options analyst at SpotGamma and an accredited journalist interviewing global leaders in business, government, and finance.
Physik Invest’s Daily Brief is read by thousands of subscribers. You, too, can join this community to learn about the fundamental and technical drivers of markets.
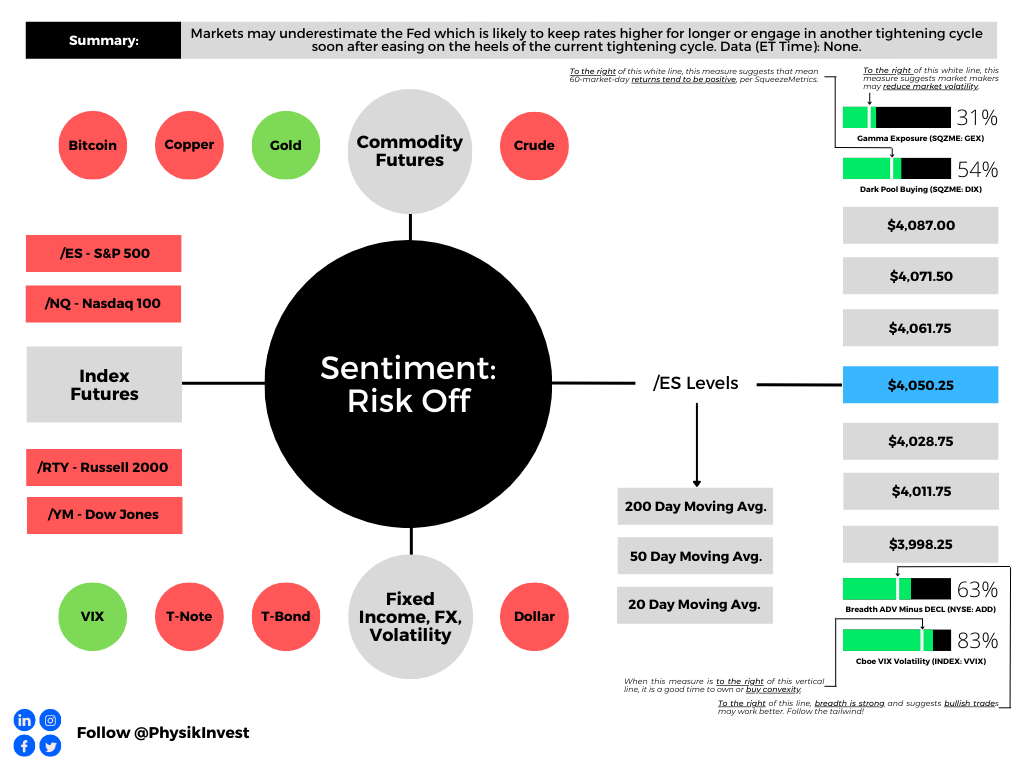
Graphic updated 8:45 AM ET. Sentiment Risk-Off if expected /ES open is below the prior day’s range. /ES levels are derived from the profile graphic at the bottom of this letter. Click here for the latest levels. SqueezeMetrics Dark Pool Index (DIX) and Gamma (GEX) with the latter calculated based on where the prior day’s reading falls with respect to the MAX and MIN of all occurrences available. A higher DIX is bullish. At the same time, the lower the GEX, the more (expected) volatility. Click to learn the implications of volatility, direction, and moneyness. Breadth reflects a reading of the prior day’s NYSE Advance/Decline indicator. The CBOE VIX Volatility Index (INDEX: VVIX) reflects the attractiveness of owning volatility.
Fundamental
Since the start of 2023, markets have trended higher. This has coincided with traders’ expectations that inflation has peaked and the pace of tightening should slow or peak soon, China re-opening, and the aversion of an energy crisis abroad, given a warmer-than-expected winter.
Investors continue to sit on a lot of cash, at this time.
Graphic: Retrieved from Bank Of America Corporation (NYSE: BAC) via Bloomberg.
Some, in their desire to put their cash to work, have demanded Treasuries.
Graphic: Retrieved from Bloomberg. “Each of the Treasury auctions this month were awarded at a yield lower than expected based on pre-sale trading, known as ‘stopping through’ — meaning that demand was strong. Primary dealers (who are obligated to bid) in Thursday’s $35 billion offering of seven-year notes picked up just 6.1% of the securities, the smallest in any Treasury note or bond auction in data going back to 2003.”
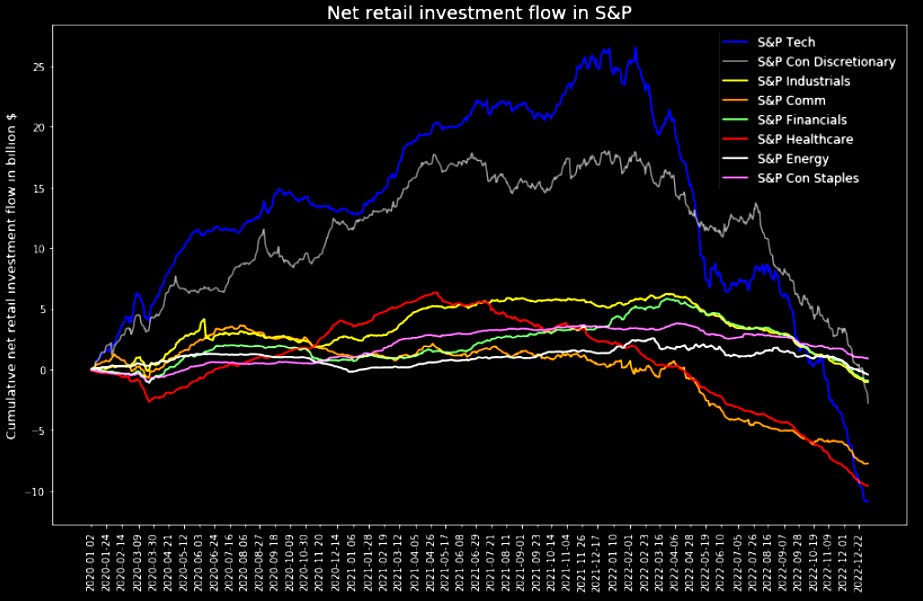
Strong demand during Treasury auctions (i.e., bond bid and yield pressured), as some suggest, is forcing investors into previously depressed equities which Goldman Sachs Group Inc (NYSE: GS) showed investors selling heavily leading up to 2023.
Graphic: Retrieved from Goldman Sachs Group Inc (NYSE: GS) via The Market Ear.
In fact, Treasury auctions have coincided with big demand for short-dated exposure to call options and short-covering.
Graphic: Retrieved from SpotGamma’s Weekend Note. “Last week’s bullishness appeared to be bolstered by very strong treasury auctions, which ignited the trade of short-dated (i.e., 0 DTE) call options. You can see this relationship in the image below wherein large 0DTE options flow (bottom) were triggered by the 1 PM ET treasury auction (red vertical line).”
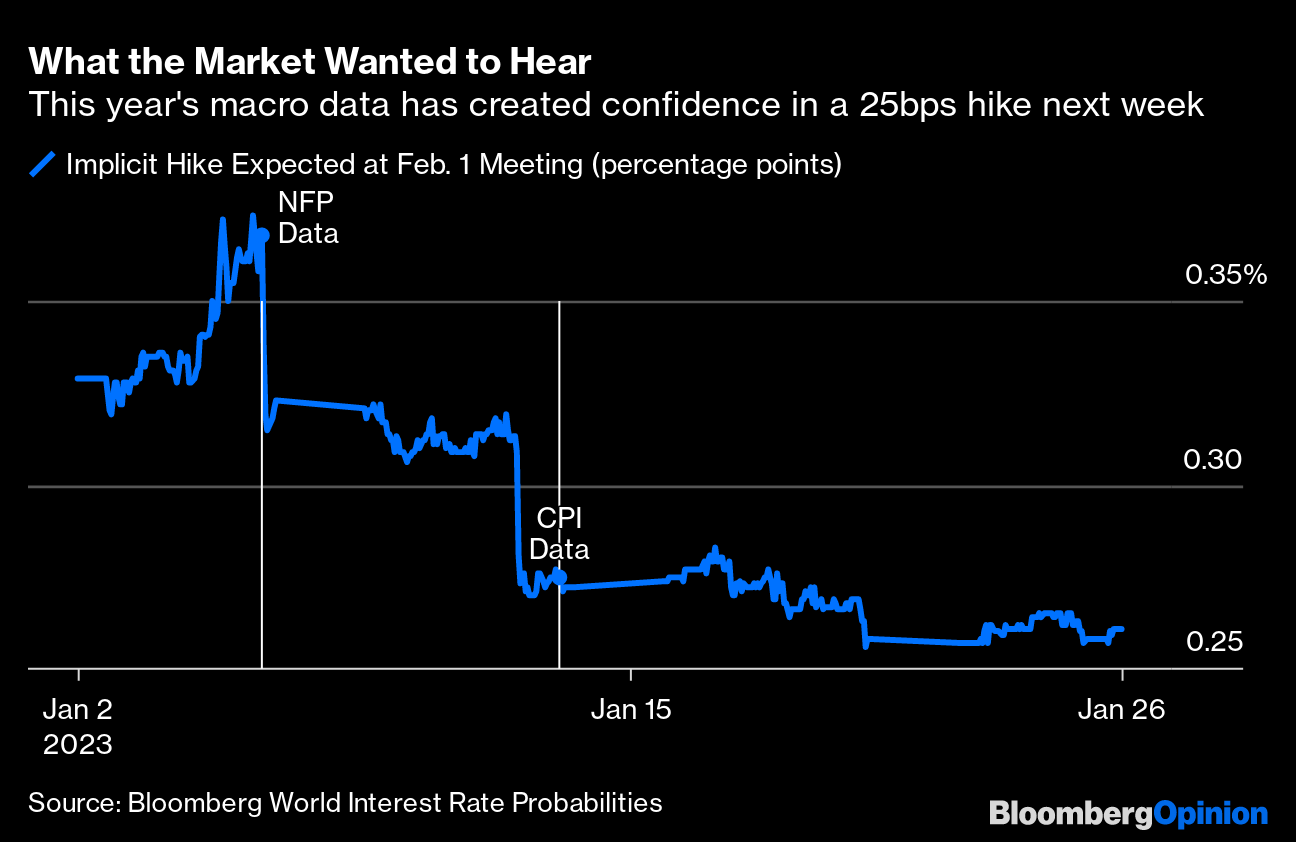
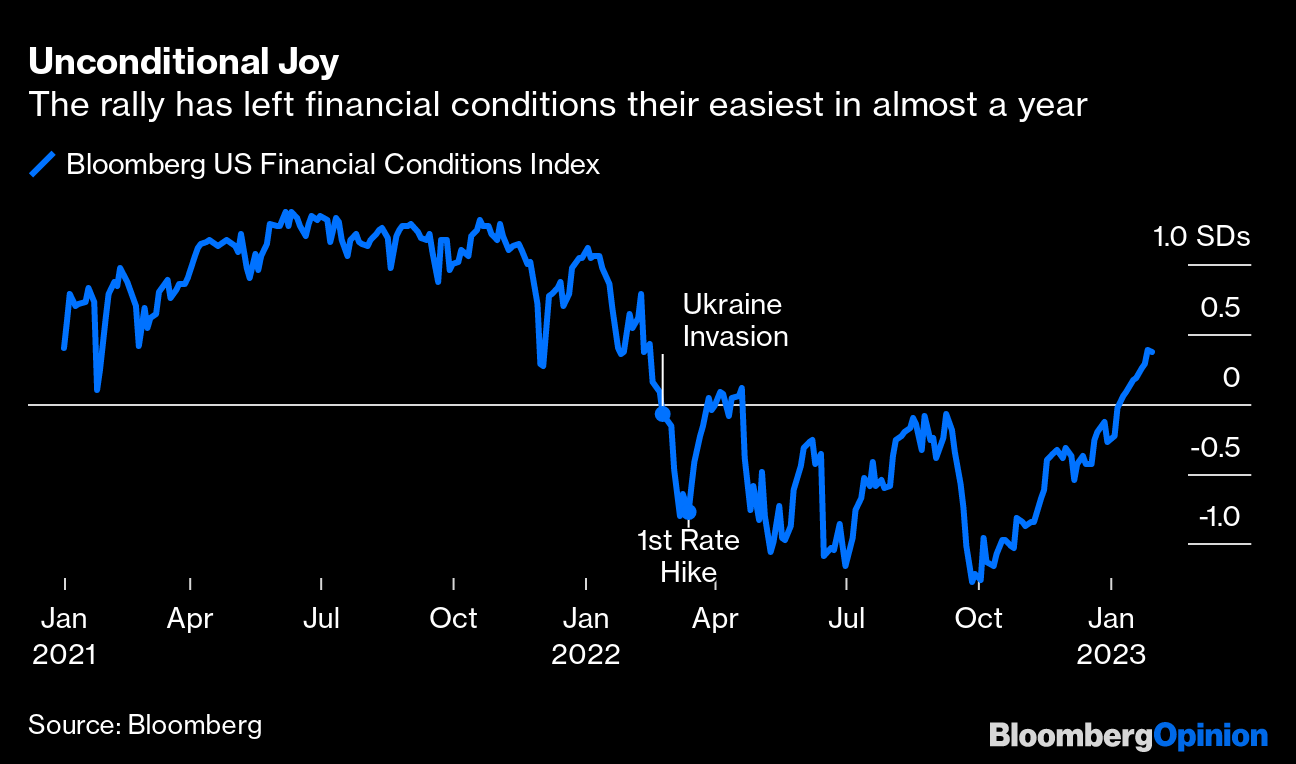
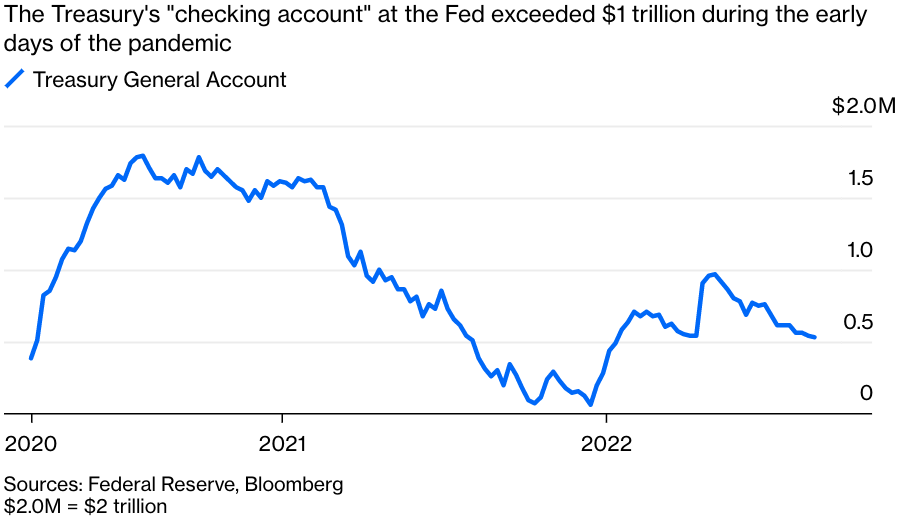
Additionally, the markets have enjoyed a liquidity boost, also a driver of equity market relief. The Treasury General Account (TGA), or the government’s checking account, if we will, was driven down and played into an easing of financial conditions which has benefitted stocks.
Per past letters, we note that a falling TGA is likely to be accompanied by a rise in bank reserves (liabilities to the Fed), increasing the room banks have to lend and finance trading activities which add to market liquidity. This added market liquidity, some suggest, is due to the debt ceiling. Consequently, once a debt ceiling deal is signed, run for the hills!
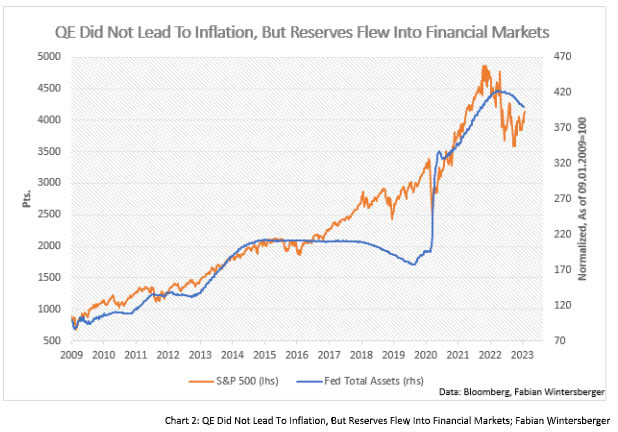
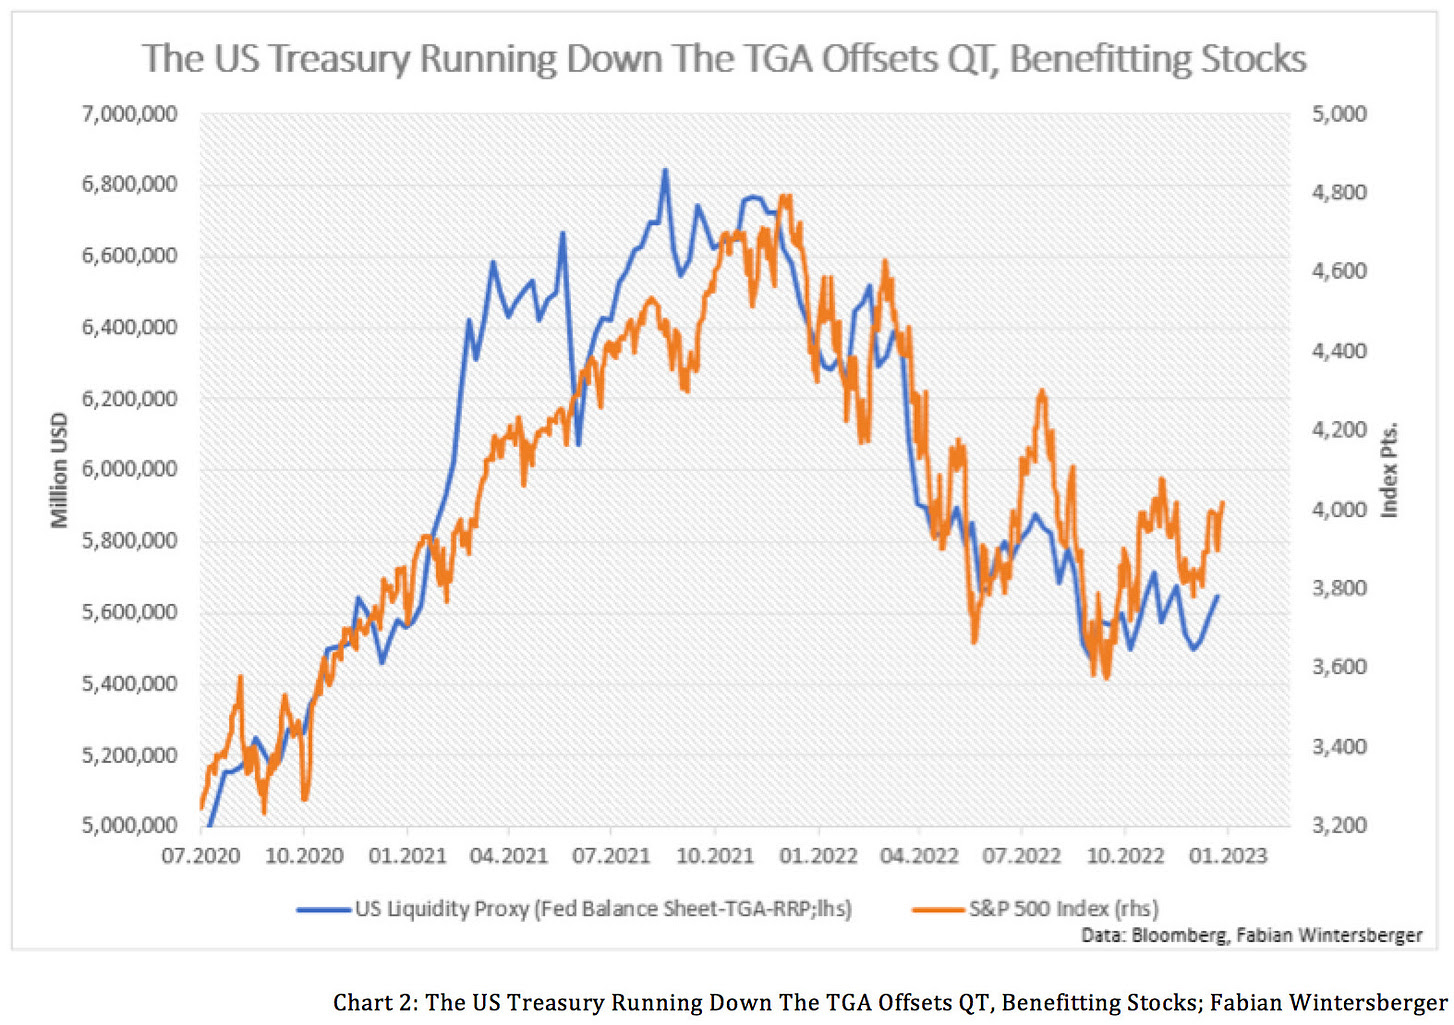
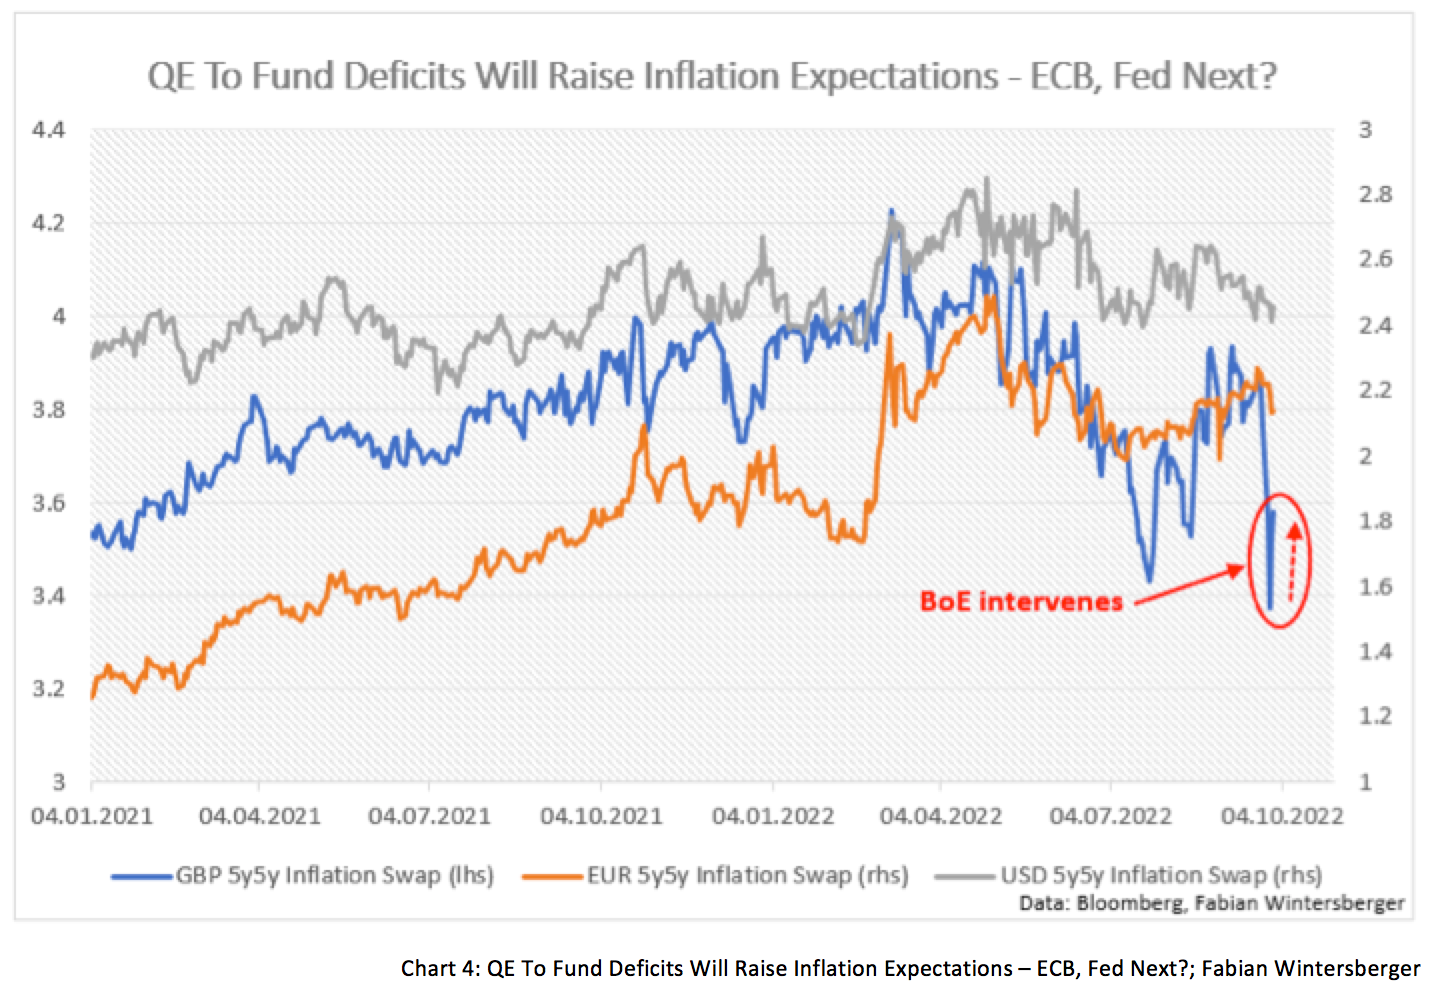
Graphic: Retrieved from Fabian Wintersberger. “One driving factor is the US is facing its debt ceiling (again). Hence, the US treasury needs to run off its Treasury General Account, which injects liquidity into markets from which stock markets benefit.”
“[T]he single most important driver of equities over the last year has been excess liquidity, and it’s about to turn more restrictive. The amount of liquidity in the system is about to change again – the Treasury is increasing bill issuance sizes, which will drain liquidity from the system. The Treasury could build cash by more than $200 billion over the span of a month – which on top of QT will effectively drain nearly $300 billion from bank reserves – which implies the S&P 500 should be 6% lower over the net month.”
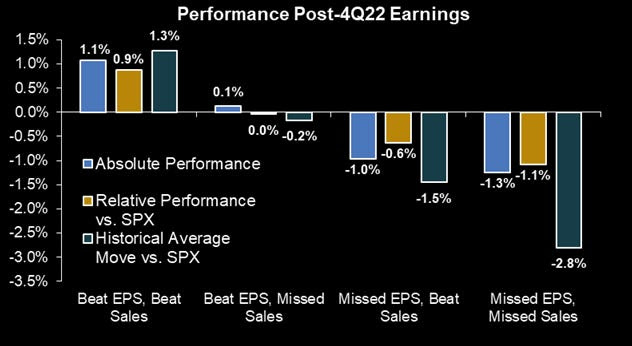
Anyways, strategists think markets are underestimating the Fed which is likely to keep rates higher for longer. There are not enough restrictions to reduce inflation. This would ultimately boost capital costs, leading to earnings misses and lower EPS.
Graphic: Retrieved from Morgan Stanley (NYSE: MS) via The Market Ear. “[M]isses, both on revenue and margin, were not punished as much as they have been historically.”
If this market strength is, in part, the result of a so-called front-running of the Fed’s pivot from tightening, either the failure to realize a pivot or an eventual pivot may be followed by the markets selling (i.e., buy the rumor and sell the news scenario).
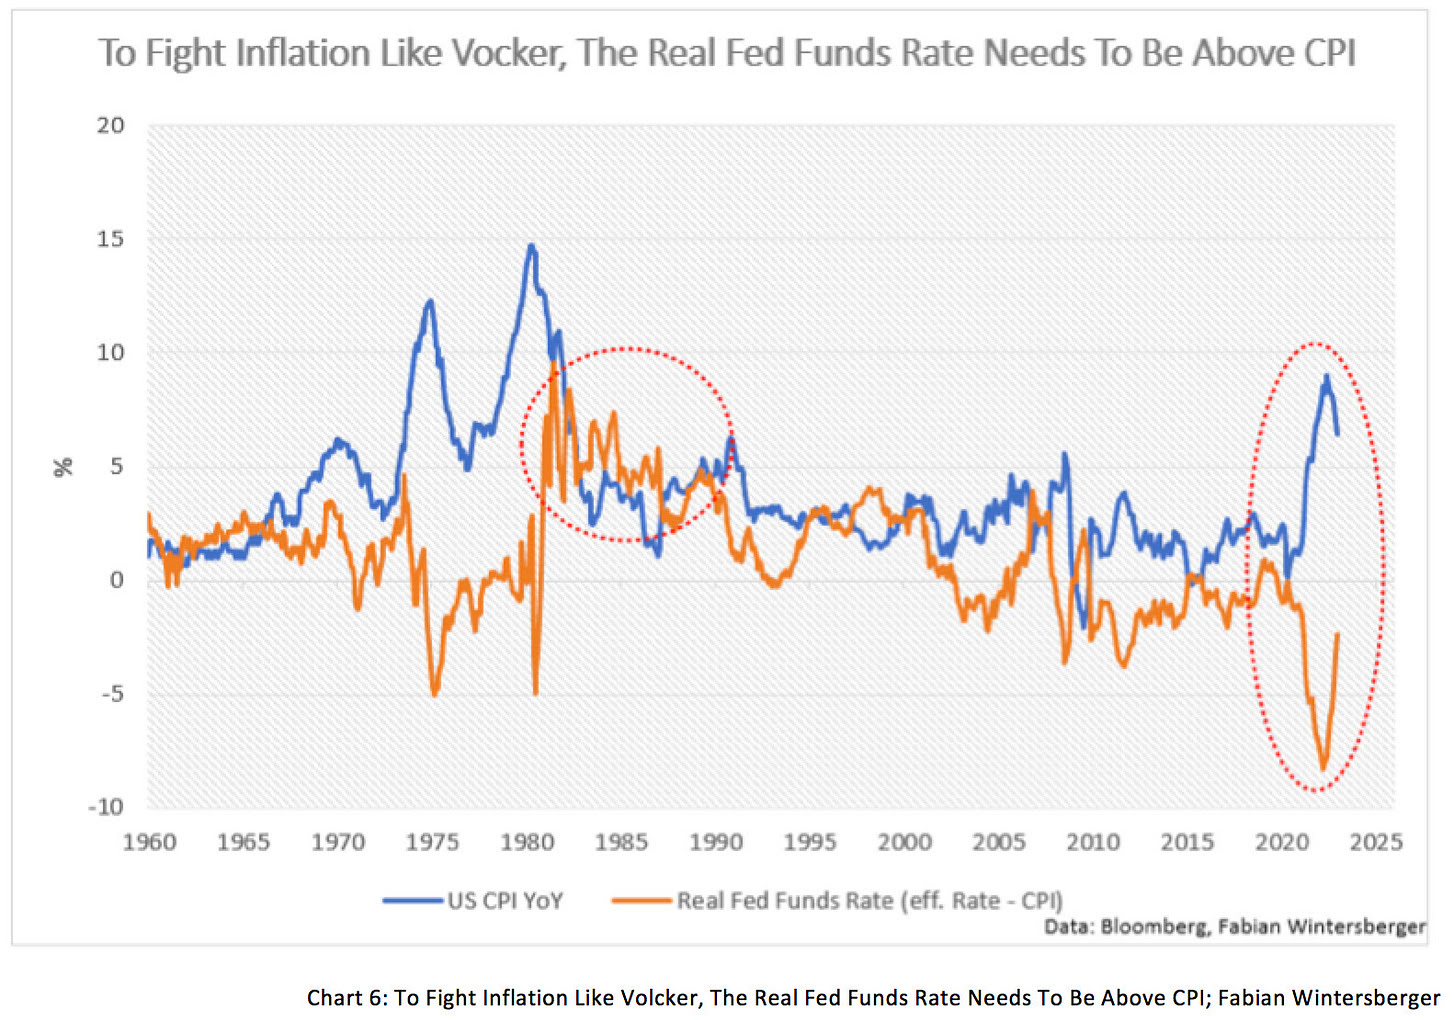
Graphic: Retrieved from Fabian Wintersberger. “Neither the ECB nor the Fed is restrictive enough to bring inflation back to 2 %. A look at the Volcker era shows that it is necessary to increase real interest rates above the inflation rate for a prolonged period to achieve that.”
A chart to tack on here at the end of the section is FINRA margin debt versus the S&P 500 (INDEX: SPX). In short, this measure is not supportive of the move up in stocks. More on this sometime later. Take care!
Graphic: Retrieved from Tier1Alpha via Callum Thomas.
Technical
As of 8:45 AM ET, Monday’s regular session (9:30 AM – 4:00 PM ET), in the S&P 500, is likely to open in the lower part of a negatively skewed overnight inventory, outside of the prior range, suggesting a potential for immediate directional opportunity.
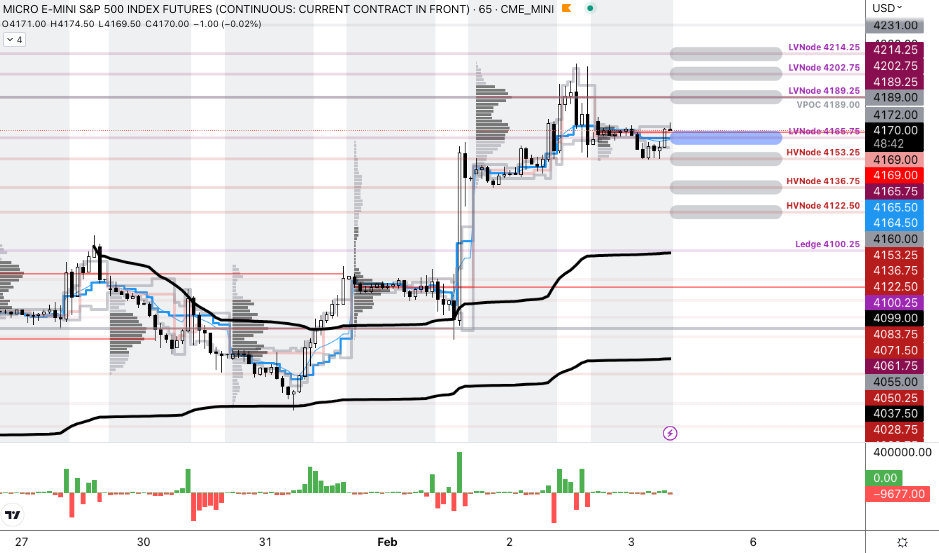
The S&P 500 pivot for today is $4,050.25.
Key levels to the upside include $4,061.75, $4,071.50, and $4,087.00.
Key levels to the downside include $4,028.75, $4,011.75, and $3,998.25.
Disclaimer: Click here to load the key levels via the TradingView platform. New links are produced daily. Quoted levels hold weight barring exogenous event.
Graphic: 65-minute profile chart of the Micro E-mini S&P 500 Futures.
Definitions
Volume Areas: Markets will build on areas of high-volume (HVNodes). Should the market trend for a period of time, this will be identified by a low-volume area (LVNodes). The LVNodes denote directional conviction and ought to offer support on any test.
If participants auction and find acceptance in an area of a prior LVNode, then future discovery ought to be volatile and quick as participants look to the nearest HVNodes for more favorable entry or exit.
POCs: Areas where two-sided trade was most prevalent in a prior day session. Participants will respond to future tests of value as they offer favorable entry and exit.
About
In short, Renato Leonard Capelj is an economics graduate working in finance and journalism.
Capelj spends most of his time as the founder of Physik Invest through which he invests and publishes daily analyses to subscribers, some of whom represent well-known institutions.
Separately, Capelj is an equity options analyst at SpotGamma and an accredited journalist interviewing global leaders in business, government, and finance.
Physik Invest’s Daily Brief is read by thousands of subscribers. You, too, can join this community to learn about the fundamental and technical drivers of markets.
Graphic updated 7:00 AM ET. Sentiment Neutral if expected /ES open is inside of the prior day’s range. /ES levels are derived from the profile graphic at the bottom of this letter. Click here for the latest levels. SqueezeMetrics Dark Pool Index (DIX) and Gamma (GEX) with the latter calculated based on where the prior day’s reading falls with respect to the MAX and MIN of all occurrences available. A higher DIX is bullish. At the same time, the lower the GEX, the more (expected) volatility. Click to learn the implications of volatility, direction, and moneyness. Breadth reflects a reading of the prior day’s NYSE Advance/Decline indicator. The CBOE VIX Volatility Index (INDEX: VVIX) reflects the attractiveness of owning volatility.
Administrative
Monday’s letter had some holes. Let’s try to fill them in, today, and get a fuller picture.
Summary of today’s letter: though the real economy may be strong, sticky inflation likely results in higher rates for longer, as well as quantitative tightening. This is not good for the financial economy. Some suggest the equity market rally persists into mid-February before further weaknesses appear. Read on for more.
Fundamental
Many sentiment and positioning indicators are bearish.
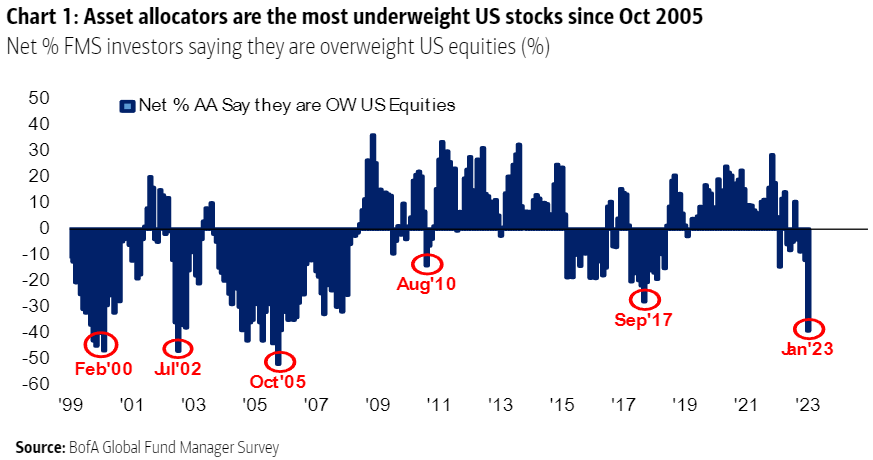
For instance, surveys by Bank of America Corporation (NYSE: BAC) point to allocators being very underweight US stocks. Also, investors are reporting some of their biggest one-month exits from stocks since BAC started surveying.
Graphic: Retrieved from BAC via Bloomberg’s John Authers.
The consensus is turning more bearish, we see, and some of this letter’s most quoted voices maintain that markets (not necessarily the economy) are in for more weakness.
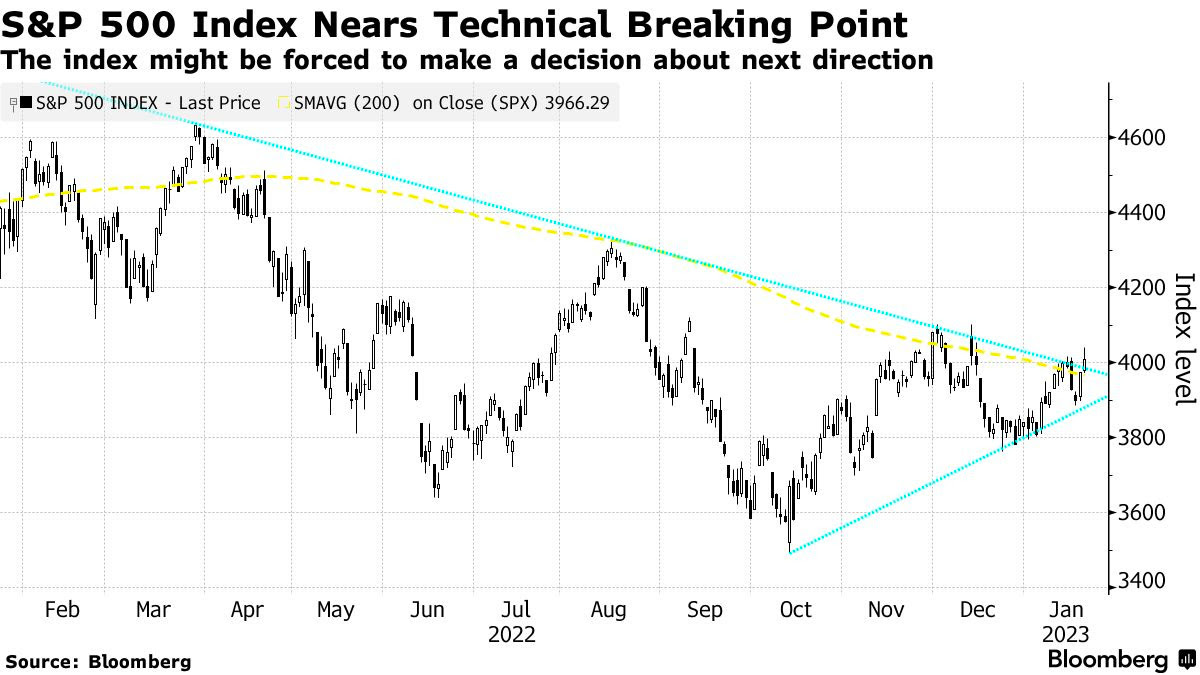
That is in the face of a severely depressed S&P 500 (INDEX: SPX) crossing above key areas denoting technical resistance, a signal for trend-followers to get involved on the long side (i.e., buy stocks) Kai Volatility’s Cem Karsan explained in a video last week.
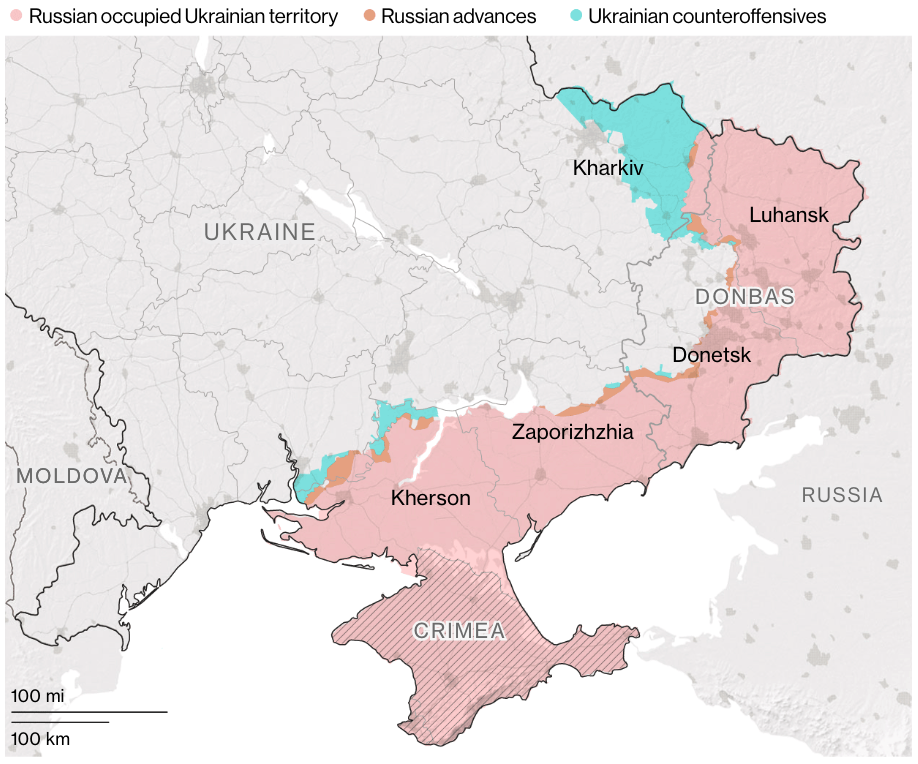
Equity market strength drivers, Karsan said, include China reopening and increasing stimulus, Europe’s not-so-bad winter, and little worsening of conflicts (e.g., Ukraine and Russia situation).
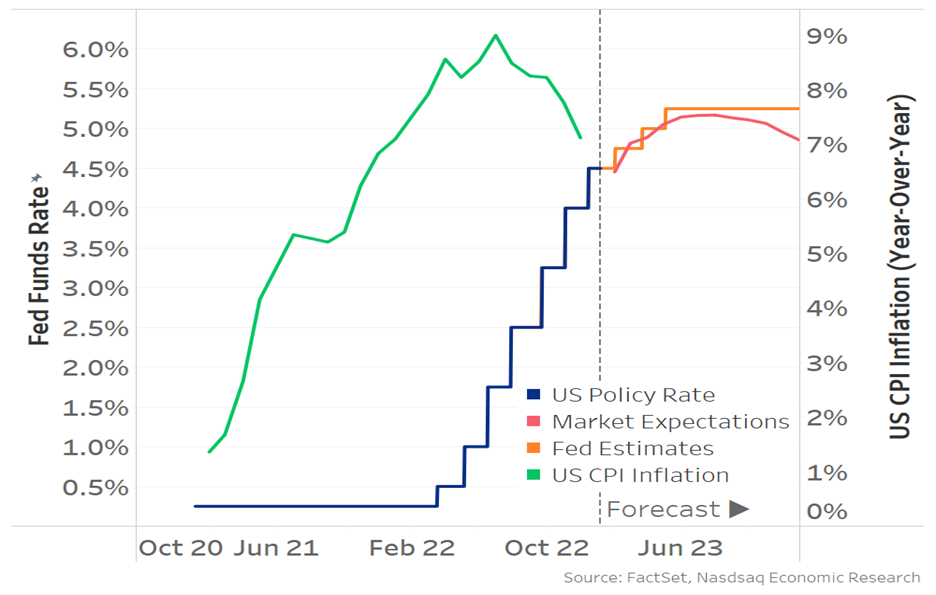
Adding, as The Macro Compass’ Alfonso Peccatiello said, the bond market thinks the Fed will not hike into a recession. Inflation likely “slows down to 2.5% quickly, [with] the Fed cutting rates to neutral (and never below). [That’s] not recessionary pricing. It’s immaculate disinflation pricing.”
The base case is a landing that’s soft.
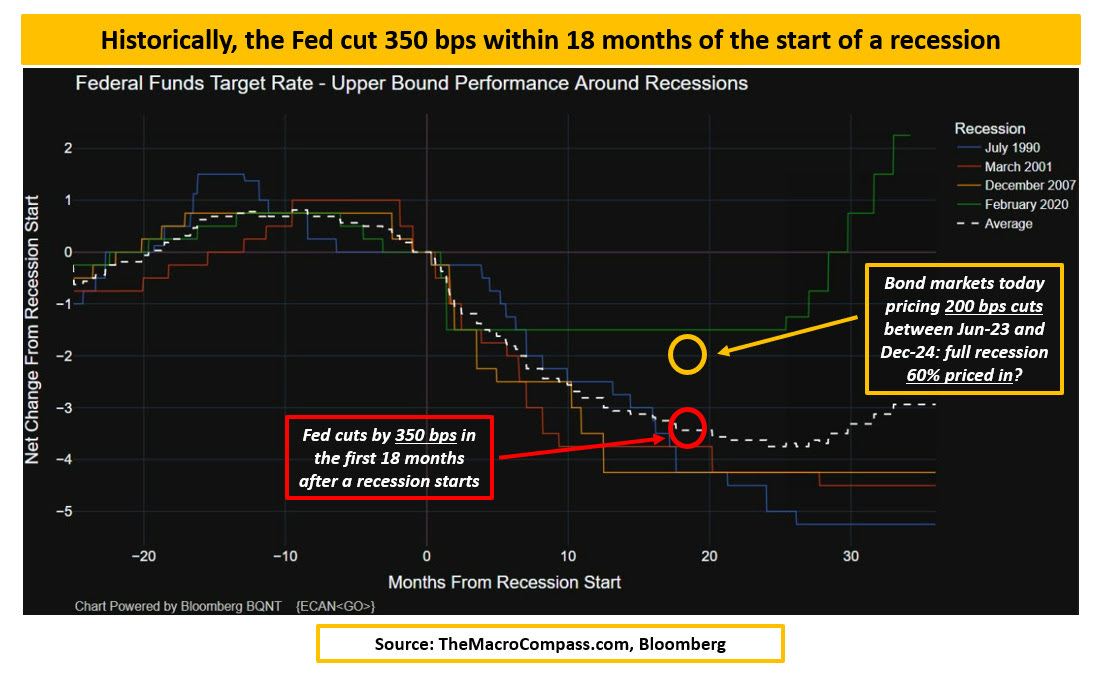
To elaborate, the data shows the Fed cut by about 350 basis points or so within 18 months of the start of a recession, Peccatiello said. Now, the markets are pricing a mid-2023 pivot with about 200 basis points of cuts between 2023 and 2024.
Graphic: Retrieved from Nasdaq Inc (NASDAQ: NDAQ).
“That must mean the bond market’s base case (60%) is a recession,” Peccatiello said, noting that the Fed Funds is not pricing “below reasonable estimates of neutral rate (2.25-2.75% in nominal terms)” in the next 2-5 years. That means this would be the first time ever the US is in a recession and the Fed doesn’t cut rates below neutral.”
And, though downside earnings revisions are happening, the “2023 EPS consensus at $225 implies a +4% earnings growth this year [while] in [past] recessionary episodes the average EPS decline is instead -30%.”
“[C]yclical sectors and countries are outperforming defensive,” and there is little fear and desire to protect against far-reaching weakness. “Protection in the S&P 500 is at the cheapest levels in 2 years” as evidenced by “the implied volatility in 20% out-of-the-money SPX puts … trading in the lowest” percentiles.
But, as Karsan implied in his recent appearance, there’s a disconnect. The economy is not the stock market, and the liquidity context is poor, which many may not recognize.
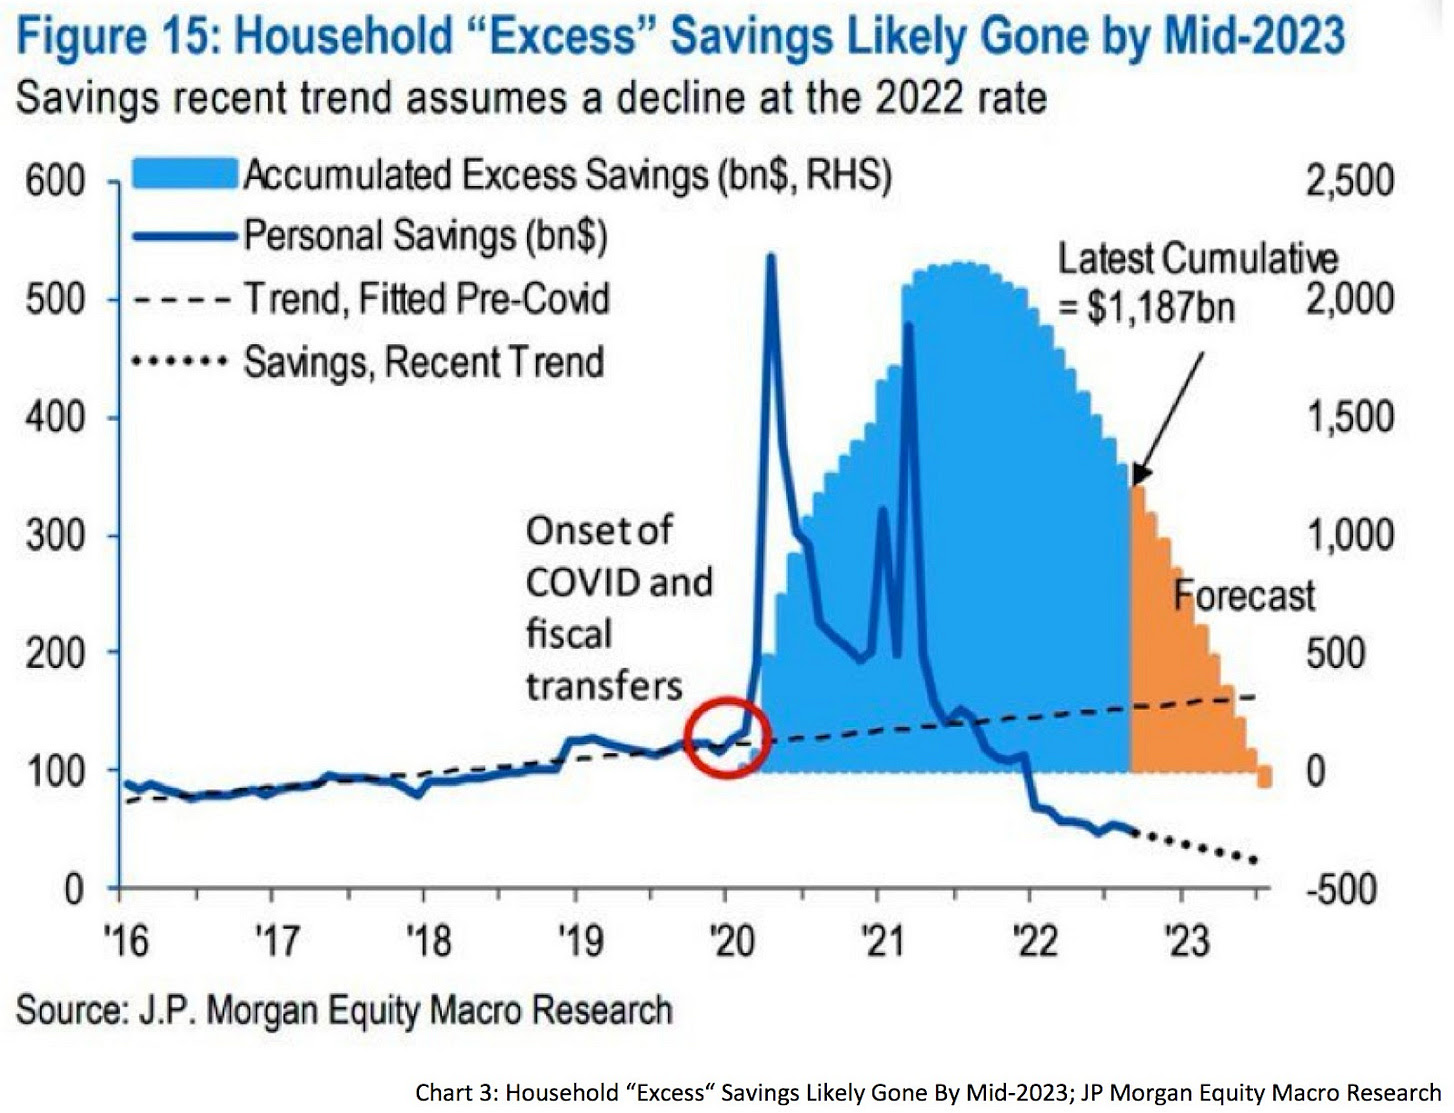
The economy performing well due to China reopening and strong demand among businesses surveyed, consumers’ savings excesses, persistent credit boom, and a strong labor market suggest inflation lasts longer.
Consequently, interest rates remain higher for longer and quantitative tightening is likely to persist. This is not so good for the financial economy.
Graphic: Retrieved from JPMorgan Chase & Co (NYSE: JPM) via Fabian Wintersberger.
“[B]lindly trusting the bond market could end badly,” Fabian Wintersberger added, noting that “recent bear market rallies in stocks and bonds will reverse” eventually.
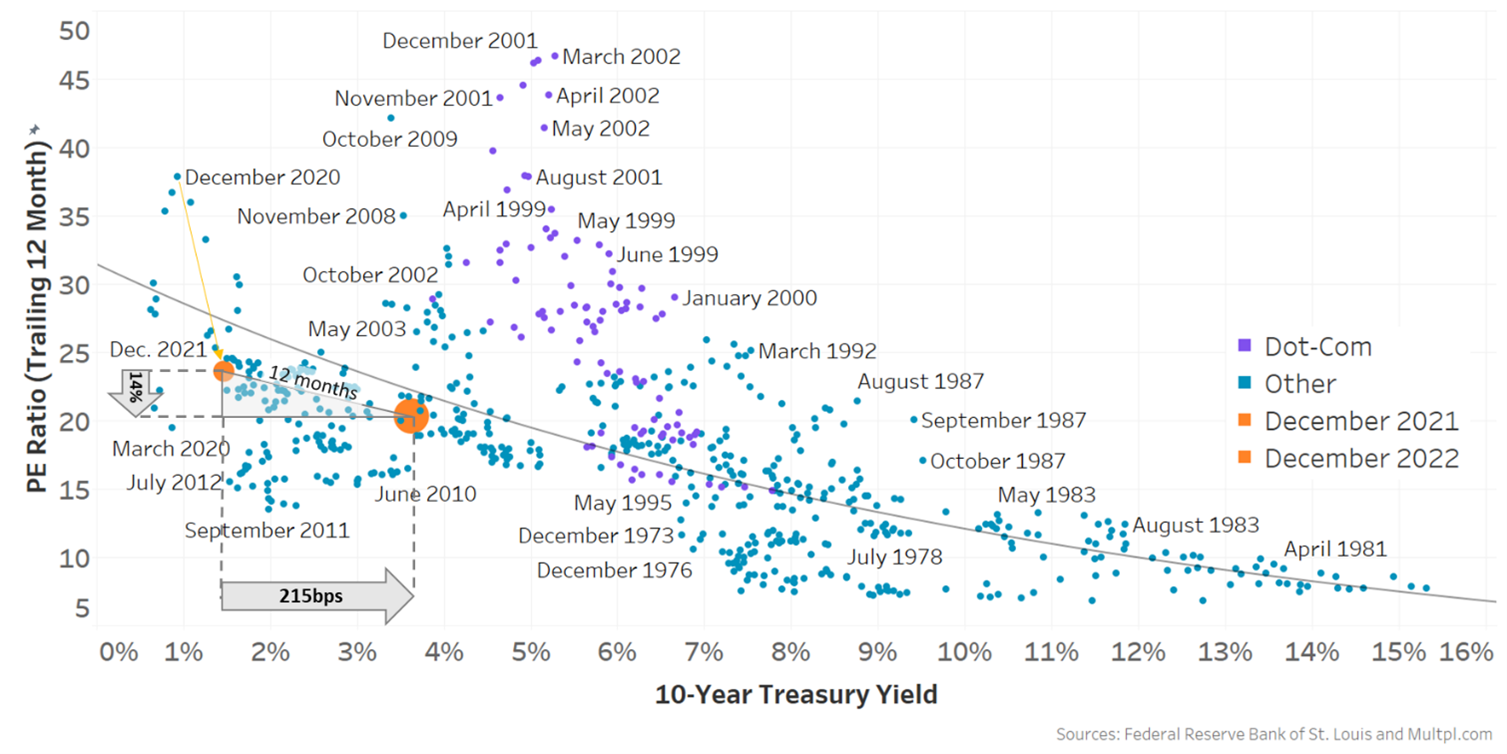
Karsan appears to agree: though green shoots are likely to push better than expected economic performance, the Fed “is in a box” and this rally likely ends in early spring.
Graphic: Retrieved from Nasdaq Inc (NASDAQ: NDAQ). Note that “[h]igher rates act as a headwind for valuations – prices should fall if earnings don’t change [and] increased earnings make PEs (valuations) fall and make stocks look more attractive.” Currently, “the market is currently pricing in a year where rates and earnings don’t change much … inflation could stay elevated [with China reopening and supply chain re-shoring] which means rates should too.”
For now, the break of the 200-day moving average is a significant impetus since it’s a level many watch (i.e., technicals matter if enough people look at them). The chase is manifesting an SPX up, Cboe Volatility Index (INDEX: VIX) up dynamic (i.e., those who fear they may miss a rally bid volatility while the underlying market trades higher).
The Daily Brief for January 13 said “the more depressed technology names to the upside for debits [looked] attractive.”
Accordingly, Tesla Call Ratio Spreads have performed really well.
The 1/2 BACKRATIO TSLA 100 17 FEB 23 160/180 CALL is pricing in excess of a $1.00 credit to close, up about 400% in the span of 14 days or so.
A push likely lasts until mid-February, after which a window for weakness may open, particularly with the liquidity context (see the below video) no longer as supportive. However, if the market consolidates for a period after, this would be bullish.
To end, the median projection puts the S&P 500 at a level above $4,000.00 by year-end with the worst estimate putting the index at $3,000.00.
Joseph Wang explained, also, that there is an “increasing probability of a second bout of inflation, an issue in the 1970s that the Fed is keen to avoid … [by] retighten[ing] financial conditions … through its balance sheet” with an extended quantitative tightening or QT maintained “even if policy rates are cut.”
Given that QT is the flow of capital out of capital markets, this context presents more pressure on the financial economy (not necessarily the real economy).
Technical
As of 6:55 AM ET, Tuesday’s regular session (9:30 AM – 4:00 PM ET), in the S&P 500, is likely to open in the bottom part of a negatively skewed overnight inventory, inside of prior-range and -value, suggesting a limited potential for immediate directional opportunity.
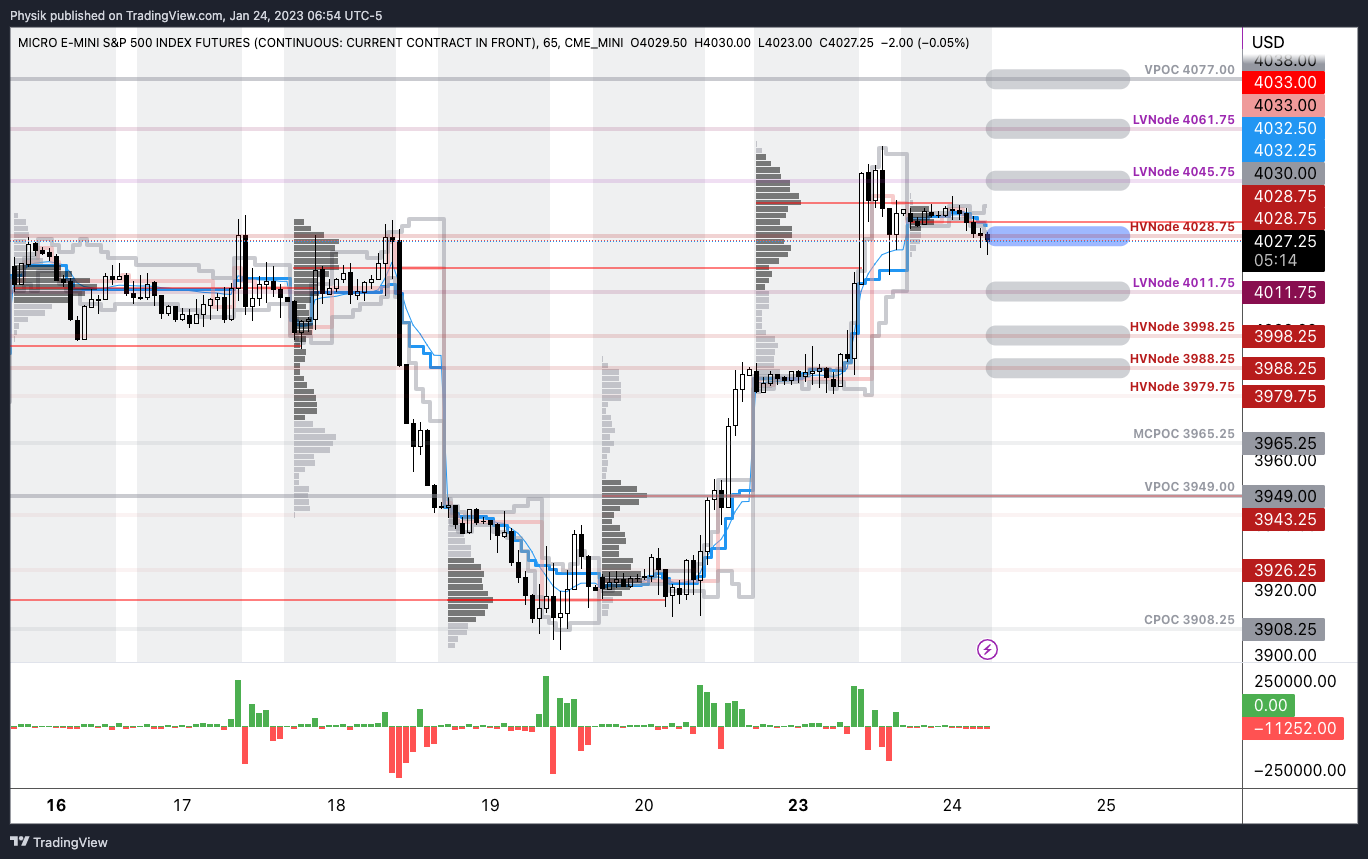
Our S&P 500 pivot for today is $4,028.75.
Key levels to the upside include $4,045.75, $4,061.75, and $4,077.00.
Key levels to the downside include $4,011.75, $3,998.25, and $3,988.25.
Click here to load updated key levels into the web-based TradingView platform. All levels are derived using the 65-minute timeframe. New links are produced, daily.
Graphic: 65-minute profile chart of the Micro E-mini S&P 500 Futures.
Definitions
Volume Areas: Markets will build on areas of high-volume (HVNodes). Should the market trend for long periods of time, it will be identified by low-volume areas (LVNodes). LVNodes denote directional conviction and ought to offer support on any test.
If participants auction and find acceptance in an area of a prior LVNode, then future discovery ought to be volatile and quick as participants look to HVNodes for favorable entry or exit.
Vanna: The rate at which the delta of an option changes with respect to implied volatility.
Charm: The rate at which the delta of an option changes with respect to time.
POCs: Denote areas where two-sided trade was most prevalent in a prior day session. Participants will respond to future tests of value as they offer favorable entry and exit.
Options: Options offer an efficient way to gain directional exposure.
If an option buyer was short (long) stock, he or she could buy a call (put) to hedge upside (downside) exposure. Additionally, one can spread, or buy (+) and sell (-) options together, strategically.
Commonly discussed spreads include credit, debit, ratio, back, and calendar.
Credit: Sell -1 option closer to the money. Buy +1 option farther out of the money.
Debit: Buy +1 option closer to the money. Sell -1 option farther out of the money.
Ratio: Buy +1 option closer to the money. Sell -2 options farther out of the money.
Back: Sell -1 option closer to the money. Buy +2 options farther out of the money.
Calendar: Sell -1 option. Buy +1 option farther out in time, at the same strike.
In the most basic way, if bullish (bearish), sell at-the-money put (call) credit spread and/or buy a call (put) debit/ratio spread structured around target price. Alternatively, if the expected directional move is great (small), opt for a back spread (calendar spread). Also, if credit spread, seek to capture 50-75% of the premium collected. If debit spread, seek to capture 2-300% of the premium paid.
Be cognizant of risk exposure.
Negative (positive) Delta = synthetic short (long).
Negative (positive) Gamma = movement hurts (helps)
Negative (positive) Theta = time decay hurts (helps).
In short, Renato Leonard Capelj is an economics graduate working in finance and journalism.
Capelj spends most of his time as the founder of Physik Invest through which he invests and publishes daily analyses to subscribers, some of whom represent well-known institutions.
Separately, Capelj is an equity options analyst at SpotGamma and an accredited journalist interviewing global leaders in business, government, and finance.
Physik Invest’s Daily Brief is read by thousands of subscribers. You, too, can join this community to learn about the fundamental and technical drivers of markets.
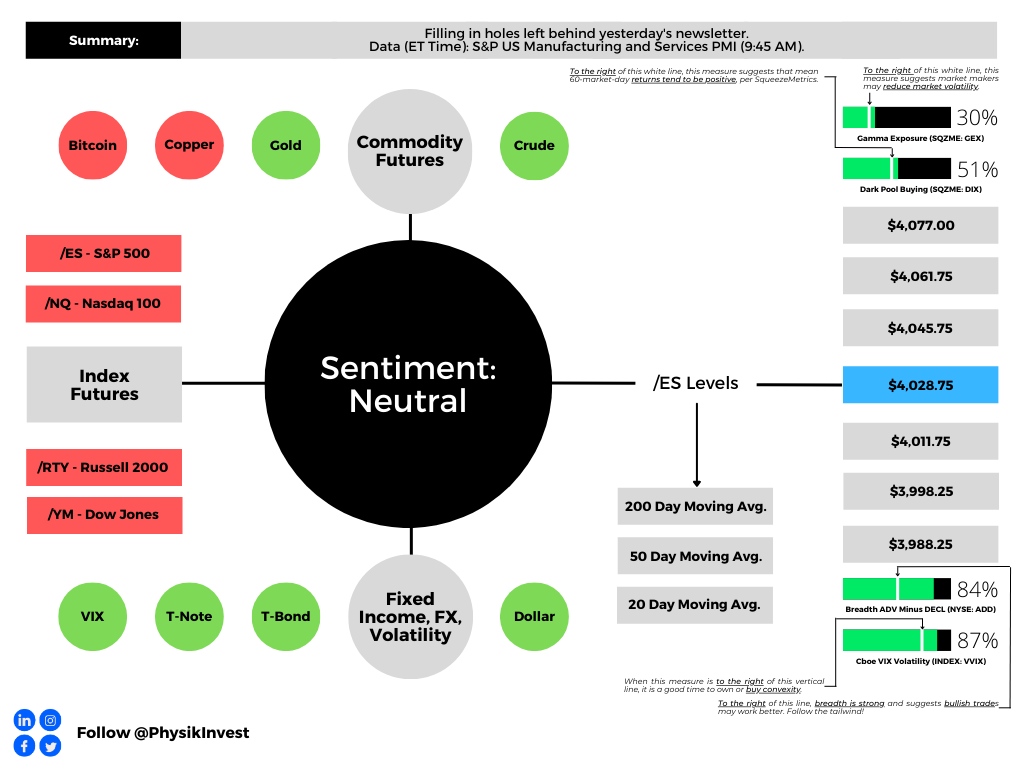
Graphic updated 9:45 AM ET AM ET. Sentiment Neutral if expected /ES open is inside of the prior day’s range. /ES levels are derived from the profile graphic at the bottom of this letter. Levels may have changed since initially quoted; click here for the latest levels. SqueezeMetrics Dark Pool Index (DIX) and Gamma (GEX) with the latter calculated based on where the prior day’s reading falls with respect to the MAX and MIN of all occurrences available. A higher DIX is bullish. At the same time, the lower the GEX, the more (expected) volatility. Click to learn the implications of volatility, direction, and moneyness. Breadth reflects a reading of the prior day’s NYSE Advance/Decline indicator. VIX reflects a current reading of the CBOE Volatility Index (INDEX: VIX) from 0-100.
Fundamental
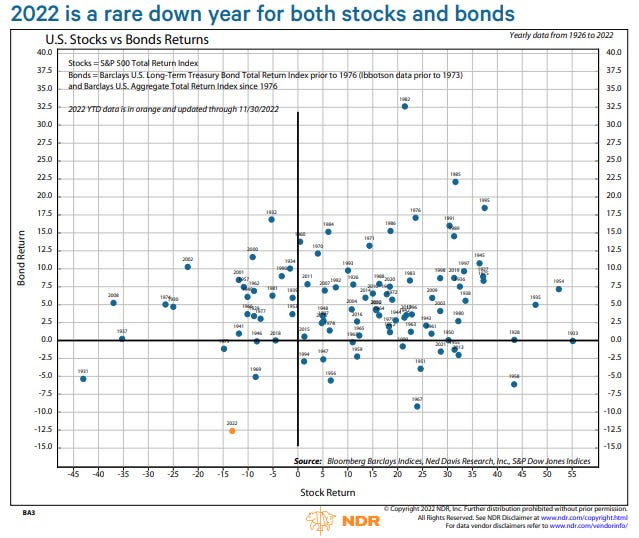
In a well-put statement by Tier1Alpha, “2022 was not a ‘classic’ bear market accompanying an earnings recession and economic slowdown, but rather a ‘rebalancing channel’ bear market.”
Essentially, as the Federal Reserve (Fed) raises interest rates and bond prices fall, equities are sold and “a ‘bear market’ occurs due to portfolio rebalancing,” as Michael Green well explained in a recent interview.
Graphic: Retrieved from Ned Davis Research via Bloomberg.
Further, some of the most sensitive (beaten) stocks have been in the technology and innovation sectors and, according to one article by Bloomberg’s John Authers, that’s not surprising.
Graphic: ARK Innovation ETF (NYSE: ARKK) via TradingView.
“These companies are prone to fears of rising interest rates, especially since many of them are valued based on their projected profits far into the future. As the Federal Reserve presses on with its most aggressive tightening of monetary policy in decades, the future profits of tech firms will be worth far less at these higher interest rates. And with recession calls growing louder, it might just spell more trouble ahead for these firms.”
Moving on, given the rule of thumb – “past inflation spikes have never been vanquished until the federal funds rate exceeds the inflation rate” – in the realm of possibilities is a “crash … signaling to the Fed that they have raised rates enough.”
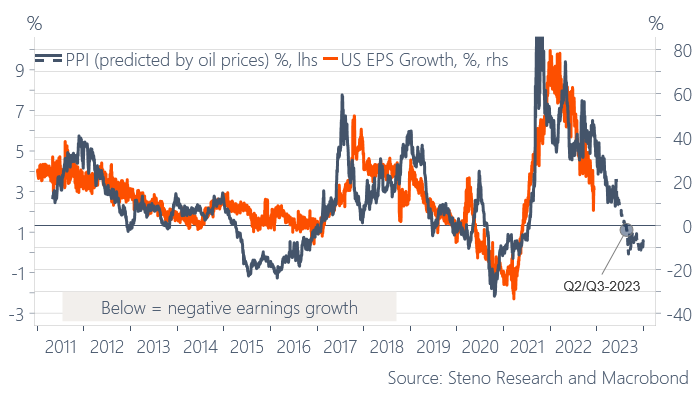
Likewise, per an article by Andreas Steno Larsen making the case for a comeback in deflation, equities have yet to price the negative EPS growth we’re likely to see.
“Those who find a lower inflation print a good opportunity to buy risk assets should look away now,” Steno Larsen said. “Remember that the PPI (and the CPI for that matter) is a leading indicator for EPS … if we allow the oil future to predict PPI, then we are in for negative EPS.”
Graphic: Retrieved from Academy Securities’ Peter Tchir via Bloomberg.
Adding, Steno Larsen is in the camp that thinks “the 1970s playbook is intact.” When “the disinflation in goods spills over to services through the spring of 2023, … the Fed will pivot,” he explained.
Some come off as less pessimistic, though. The Fed is to ease sooner than expected; quantitative tightening (QT) is not likely to run its course, Joseph Wang said.
To explain, “an ideal QT would drain liquidity in the overall financial system while keeping liquidity in the banking sector above a minimum threshold. That is only possible if the bulk of the liquidity drained is sourced from the $2T RRP, which holds funds owned by money market funds. MMFs could facilitate QT by withdrawing funds from the RRP to invest in the growing supply of Treasury bills, but recent data suggests they have lost interest in bills. Households [which include hedge funds] appear to have replaced MMFs as the marginal buyer of bills and are funding their purchases out of funds held in the banking sector. This suggests QT may lower banking sector liquidity below the Fed’s comfort level much earlier than anticipated.”
Hence, the downside that has yet to happen may prove not to be as material. A potential consequence, as Steno Larsen sees, is “double inflation,” bolstered by inflationary deglobalization trends that may accelerate.
For equities, “a revisit of the $3,500.00-$3,600.00 zone should be on the cards for S&P 500,” he said, while other markets, like housing, may see drawdowns reaching “15-20%” in the base case.
We’ll go into more depth on certain points next week. Hope this was a great way to set the stage for future conversations.
Technical
As of 9:25 AM ET, Tuesday’s regular session (9:30 AM – 4:00 PM ET), in the S&P 500, is likely to open in the upper part of a negatively skewed overnight inventory, inside of prior-range and -value, suggesting a limited potential for immediate directional opportunity.
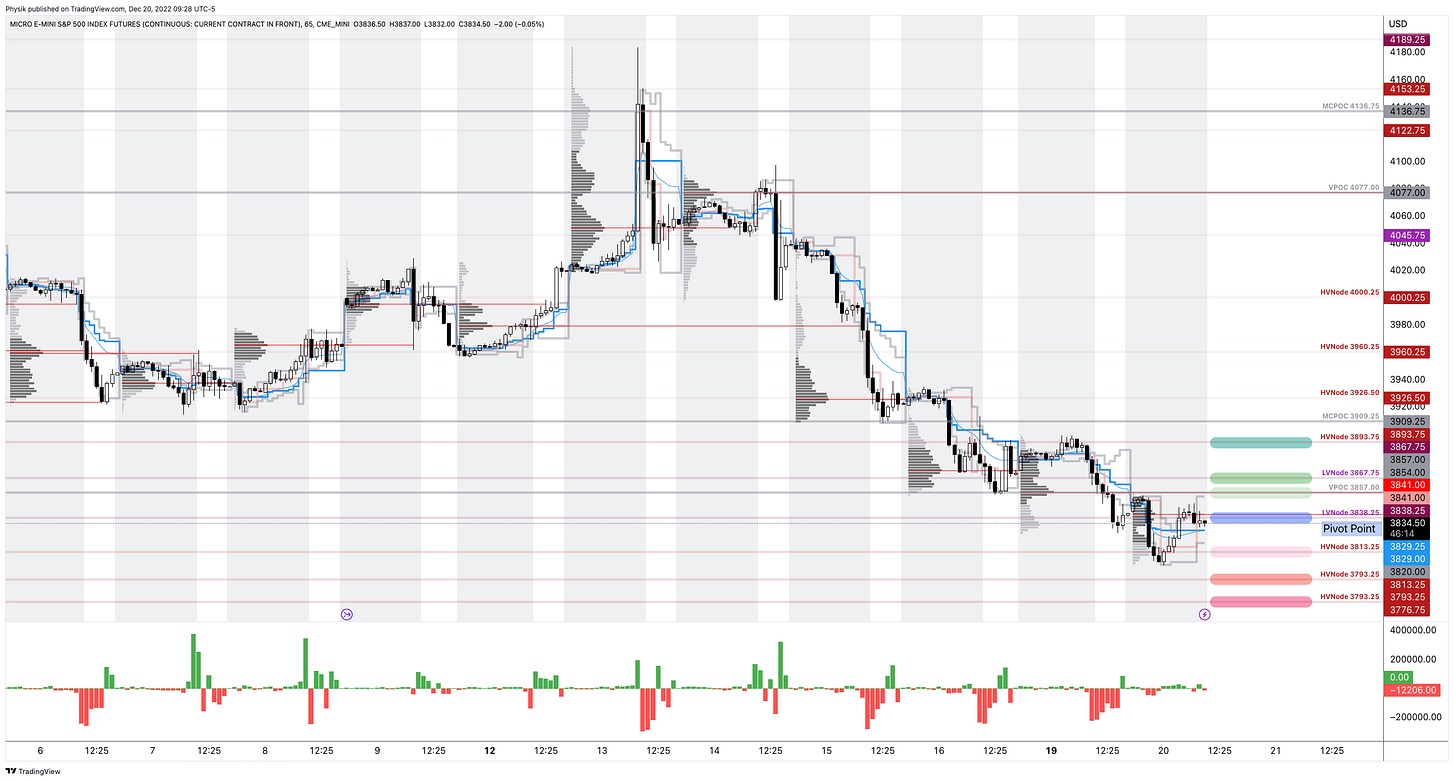
Our S&P 500 pivot for today is $3,838.25.
Key levels to the upside include $3,857.00, $3,867.75, and $3,893.75.
Key levels to the downside include $3,813.25, $3,793.25, and $3,776.75.
Click here to load today’s key levels into the web-based TradingView platform. All levels are derived using the 65-minute timeframe. New links are produced, daily.
Graphic: 65-minute profile chart of the Micro E-mini S&P 500 Futures.
Definitions
Volume Areas: Markets will build on areas of high-volume (HVNodes). Should the market trend for long periods of time, it will be identified by low-volume areas (LVNodes). LVNodes denote directional conviction and ought to offer support on any test.
If participants auction and find acceptance in an area of a prior LVNode, then future discovery ought to be volatile and quick as participants look to HVNodes for favorable entry or exit.
POCs: Denote areas where two-sided trade was most prevalent in a prior day session. Participants will respond to future tests of value as they offer favorable entry and exit.
About
In short, an economics graduate working in finance and journalism.
Capelj spends most of his time as the founder of Physik Invest through which he invests and publishes daily analyses to subscribers, some of whom represent well-known institutions.
Separately, Capelj is an equity options analyst at SpotGamma and an accredited journalist interviewing global leaders in business, government, and finance.
Physik Invest’s Daily Brief is read by thousands of subscribers. You, too, can join this community to learn about the fundamental and technical drivers of markets.
Graphic updated 7:20 AM ET. Sentiment Neutral if expected /ES open is inside of the prior day’s range. /ES levels are derived from the profile graphic at the bottom of this letter. Levels may have changed since initially quoted; click here for the latest levels. SqueezeMetrics Dark Pool Index (DIX) and Gamma (GEX) with the latter calculated based on where the prior day’s reading falls with respect to the MAX and MIN of all occurrences available. A higher DIX is bullish. At the same time, the lower the GEX, the more (expected) volatility. Click to learn the implications of volatility, direction, and moneyness. Breadth reflects a reading of the prior day’s NYSE Advance/Decline indicator. VIX reflects a current reading of the CBOE Volatility Index (INDEX: VIX) from 0-100.
Administrative
For the first time in a while, I am able to catch up to and focus more on active trading, hence the earlier letter, today. What a crazy past few months. Almost back to normal!
We will issue a content calendar, soon, revealing the dates letters are likely to be published and the content that may be covered.
That said, due to the writer’s travel commitments, from 12/6 to 12/9 and 12/12 to 12/16 there will be no commentaries. If any queries, or if you are local to New York City or Paris, ping renato@physikinvest.com or Renato Capelj#8625 on Discord.
Fundamental
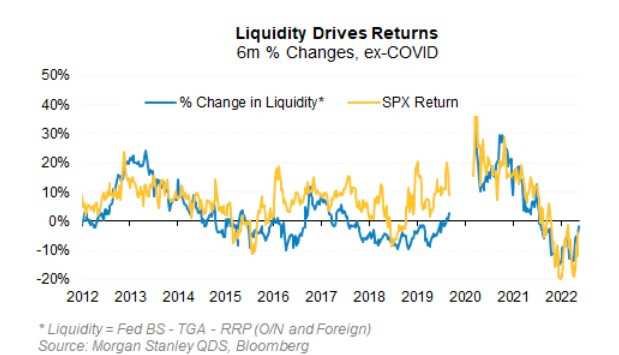
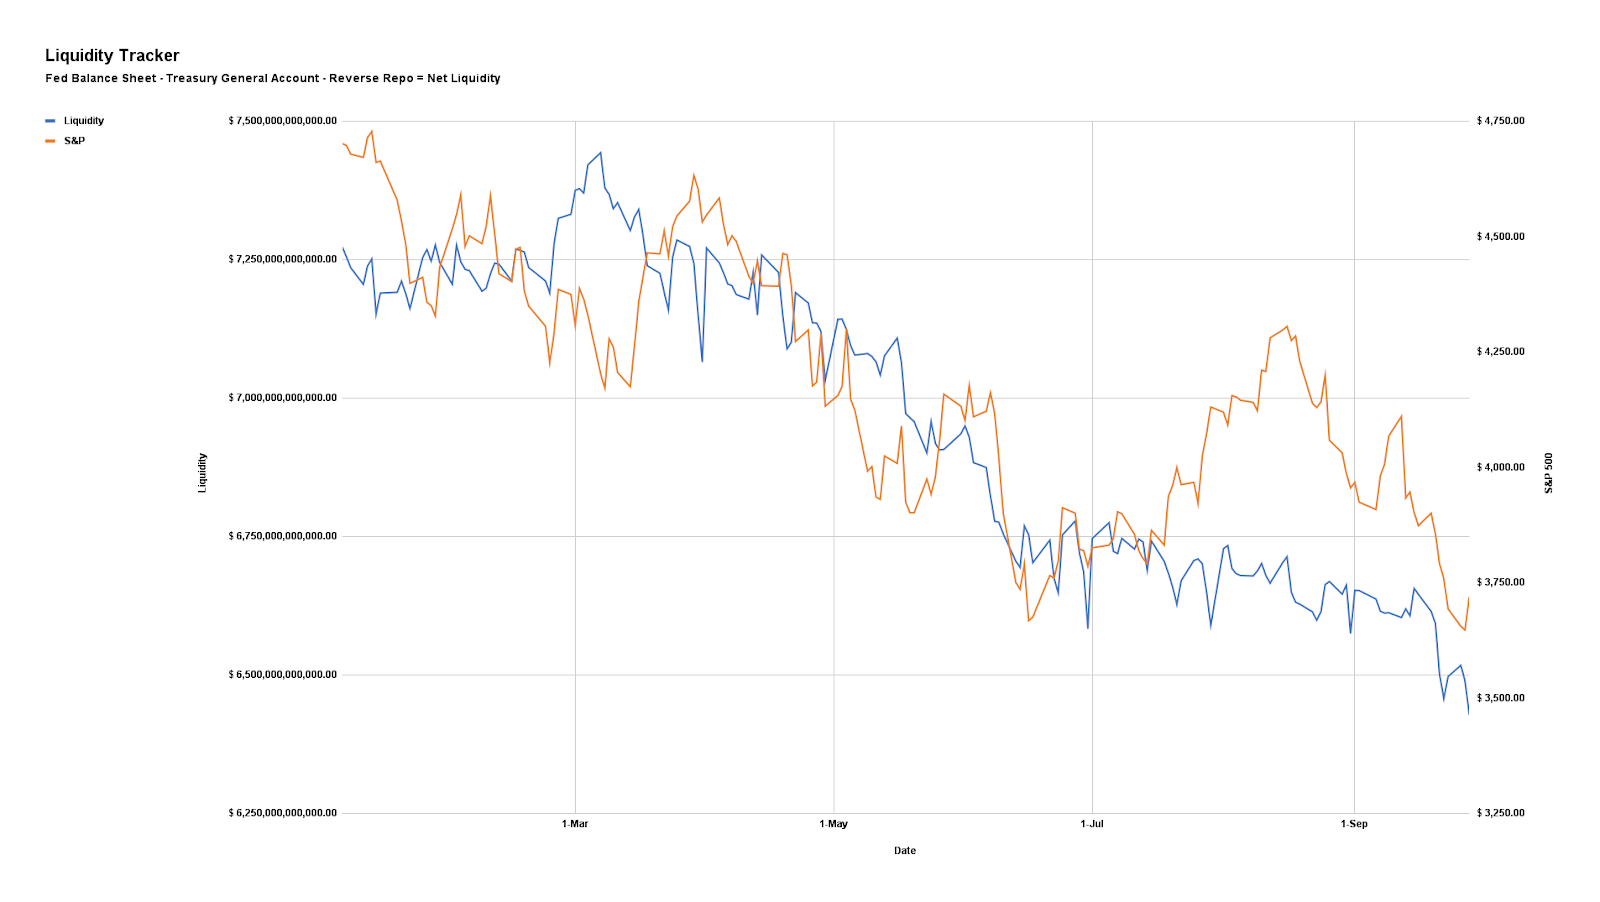
In many ways, the opposite of what happened to bolster a rally across risk assets like equities and crypto is happening, now. As unpacked in detail across letters including our Daily Brief for October 5, 2022, liquidity measures are in a near-lockstep fall with the S&P 500 (INDEX: SPX).
The correlation between so-called net liquidity described further below, and the S&P 500, over the past ten years is about 0.70 and explains more than half of the movement in price-earings multiples over the past decade.
Detailed in previous letters was how processes like quantitative tightening manifest themselves as less demand for assets; per Fabian Wintersberger, central bankers must “recycle bonds into the markets on an unprecedented scale, which could easily lead to lower bond prices/higher yields” causing a “reflux of capital to safe-haven assets, like treasuries.”
Adding, “the Fed has [only] reduced its holdings by 1.5% by letting bonds mature on its balance sheet. If they want to reduce the balance sheet back to the level of 2020, it needs to reduce it by 41%; … [therefore], [i]f history is any guide, the stock market has yet to face its most significant problems in such a scenario.”
Morgan Stanley’s (NYSE: MS) trading team agrees, per a recent Bloomberg article on a looming bear case for the S&P 500.
Though “rate increases get all the blame for this year’s bear market” and a projected “slowdown in the pace of rate hikes” helping “equities emerge from the yearlong bear, … the S&P 500 will drop as much as 15% by March, based on historic patterns and projected money flows,” which major inputs include “changes in the Fed’s balance sheet (BS); the Treasury General Account (TGA), or Treasury cash held at the central bank; and Reverse Repo Facilities (RRP), or cash parked at the Fed by money market funds and others.”
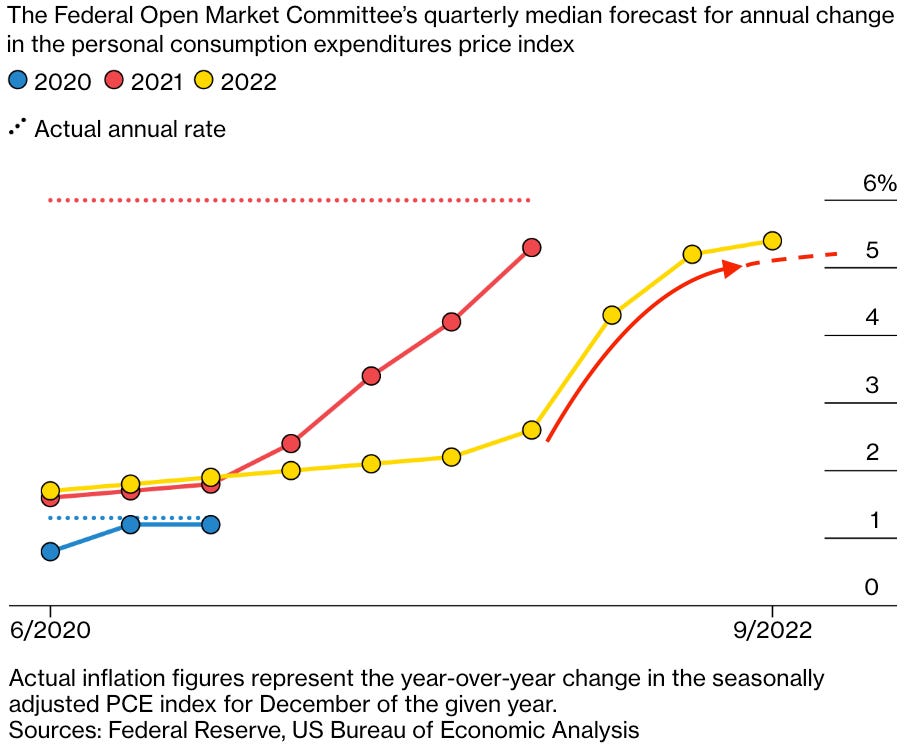
Graphic: Retrieved from Bloomberg. Inflation increases are easing.
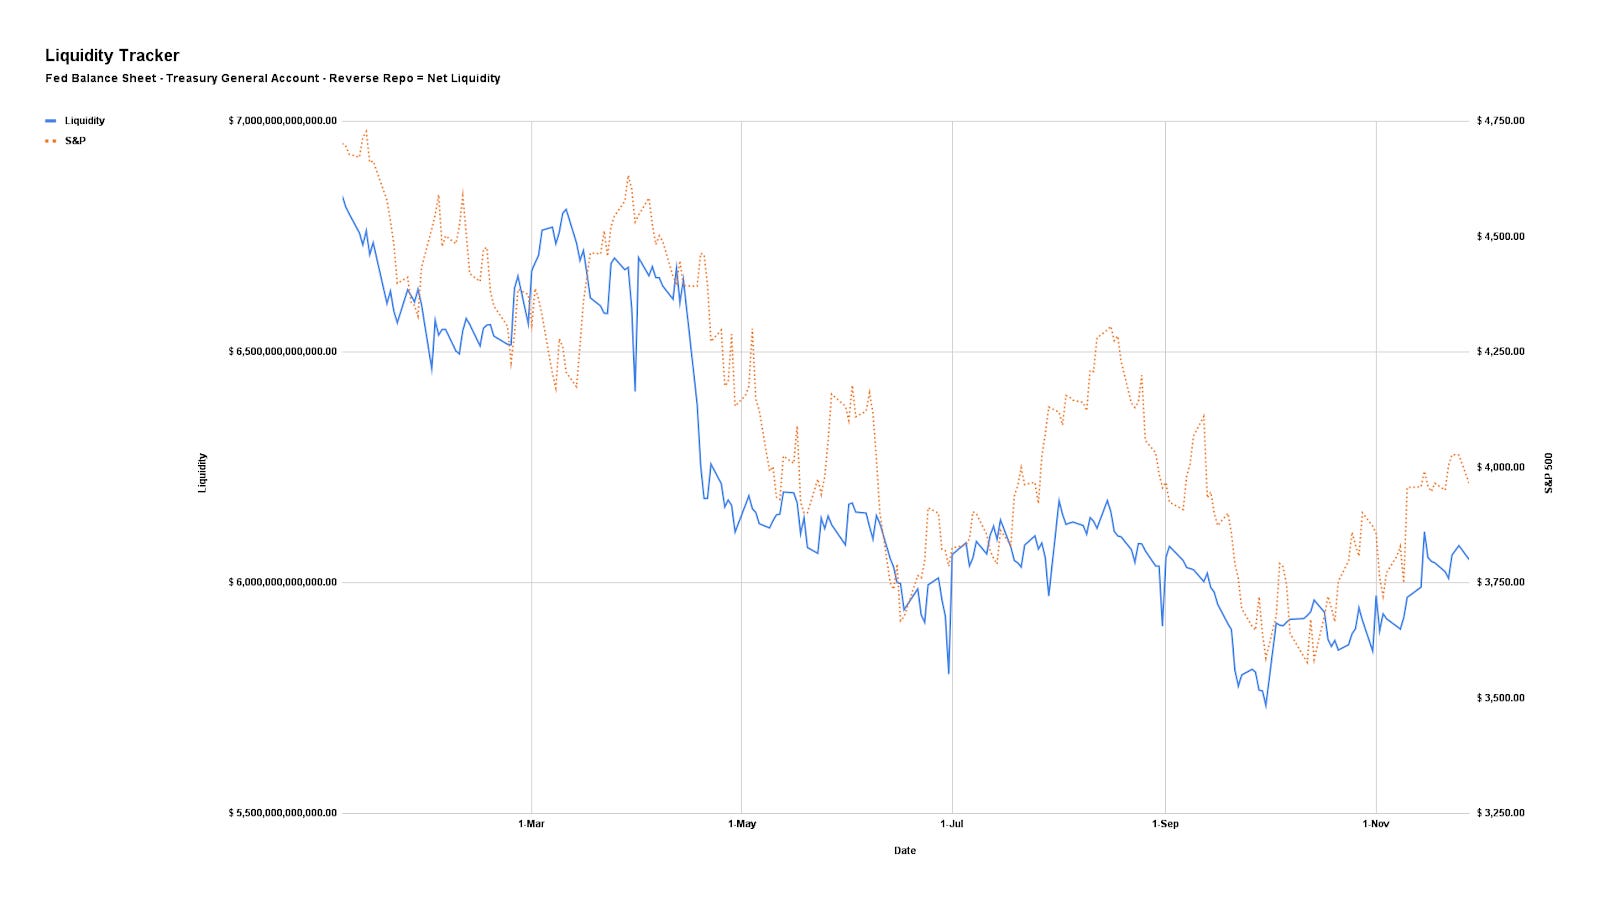
In other words, net liquidity is the Fed’s BS less TGA and RRP. See the below graphic.
Accordingly, “a rise in Fed’s balance sheet means an expansion in liquidity that bodes well for stocks, while an increase in TGA or RRP suggests a contraction in liquidity.”
Based on the QT pace ($95 billion per month) and forecasts the Treasury cash balance will “rise by $200 billion into yearend, … [amounting] to a squeezing of liquidity that alone implies an 8% drop for the S&P 500 by the end of December.”
Graphic: Via Physik Invest. Data compiled by @jkonopas623. Fed Balance Sheet data, here. Treasury General Account Data, here. Reverse Repo data, here. NL = BS – TGA – RRP.
In summary, “there’s no longer enough money to finance [the] production of those goods and to support a stock market that’s still far from cheap.”
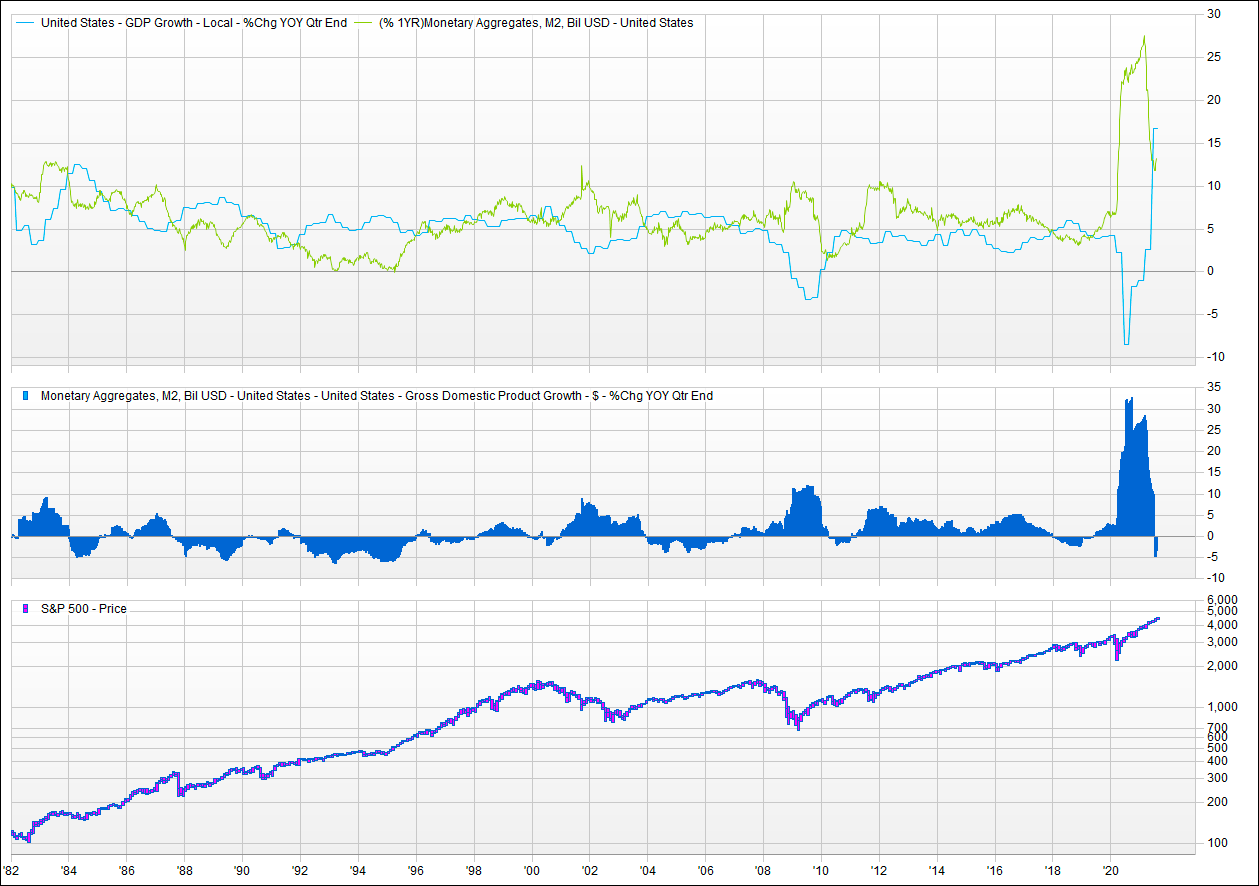
Graphic: Retrieved from VettaFi. “If the supply of money (in aggregate, M2) is higher than the demand for money (represented by nominal GDP), then there is “excess” liquidity that can and will find its way into asset prices. Furthermore, if the growth of money supply exceeds the growth of GDP, that excess liquidity builds, and there is more of it to find its way into more asset prices. In theory, the inverse would also hold true. If the growth of GDP exceeds the growth of money supply, then excess liquidity is being consumed by the demand for money. In this scenario, the real economy is feeding on liquidity that was once flowing into asset prices.”
Positioning
As we said earlier this week (November 29, 2022, and November 28, 2022), it’s not a terrible time to hedge, and selling volatility, blindly, on either side of the market, is not a great trade.
As SpotGamma put well, yesterday, implied volatility (IVOL) is at a low meaning “it makes sense to buy volatility and put on trades that make money if the market moves” but leverage the skew to sell “options to cut down the cost of waiting for that movement to happen.”
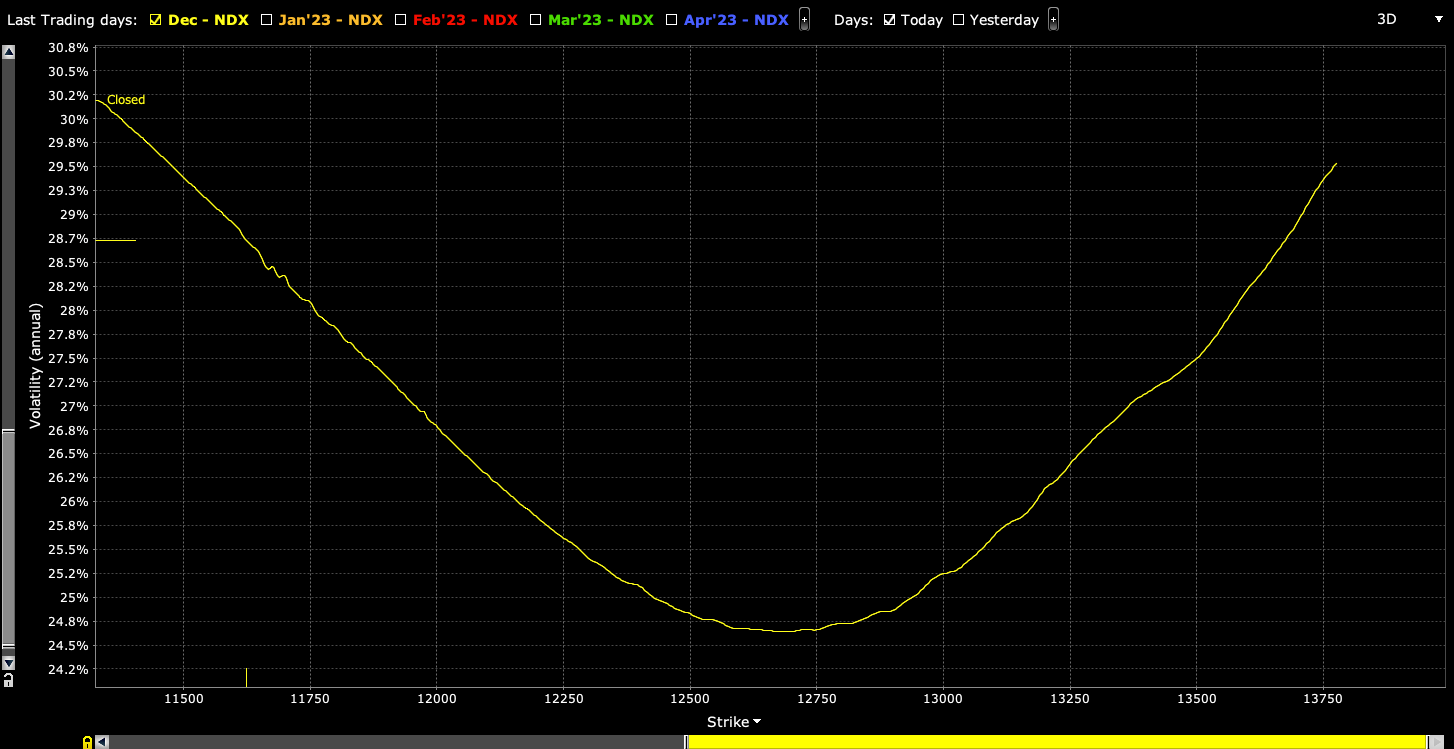
In our letter, yesterday, we highlighted Nasdaq 100 (INDEX: NDX) volatility skew and showed it was smile-shaped, rather than the typical smirk-shaped reverse pattern, making for some great trades to the upside. Through steeper call volatility skew – a result of traders positioning for an upside move – we can use the richness of further away calls to reduce the cost of our bets on the market upside.
Graphic: Updated 11/28/2022. Retrieved from Interactive Brokers (NASDAQ: IBKR). Nasdaq 100 (INDEX: NDX) volatility skew resembles the so-called smile.
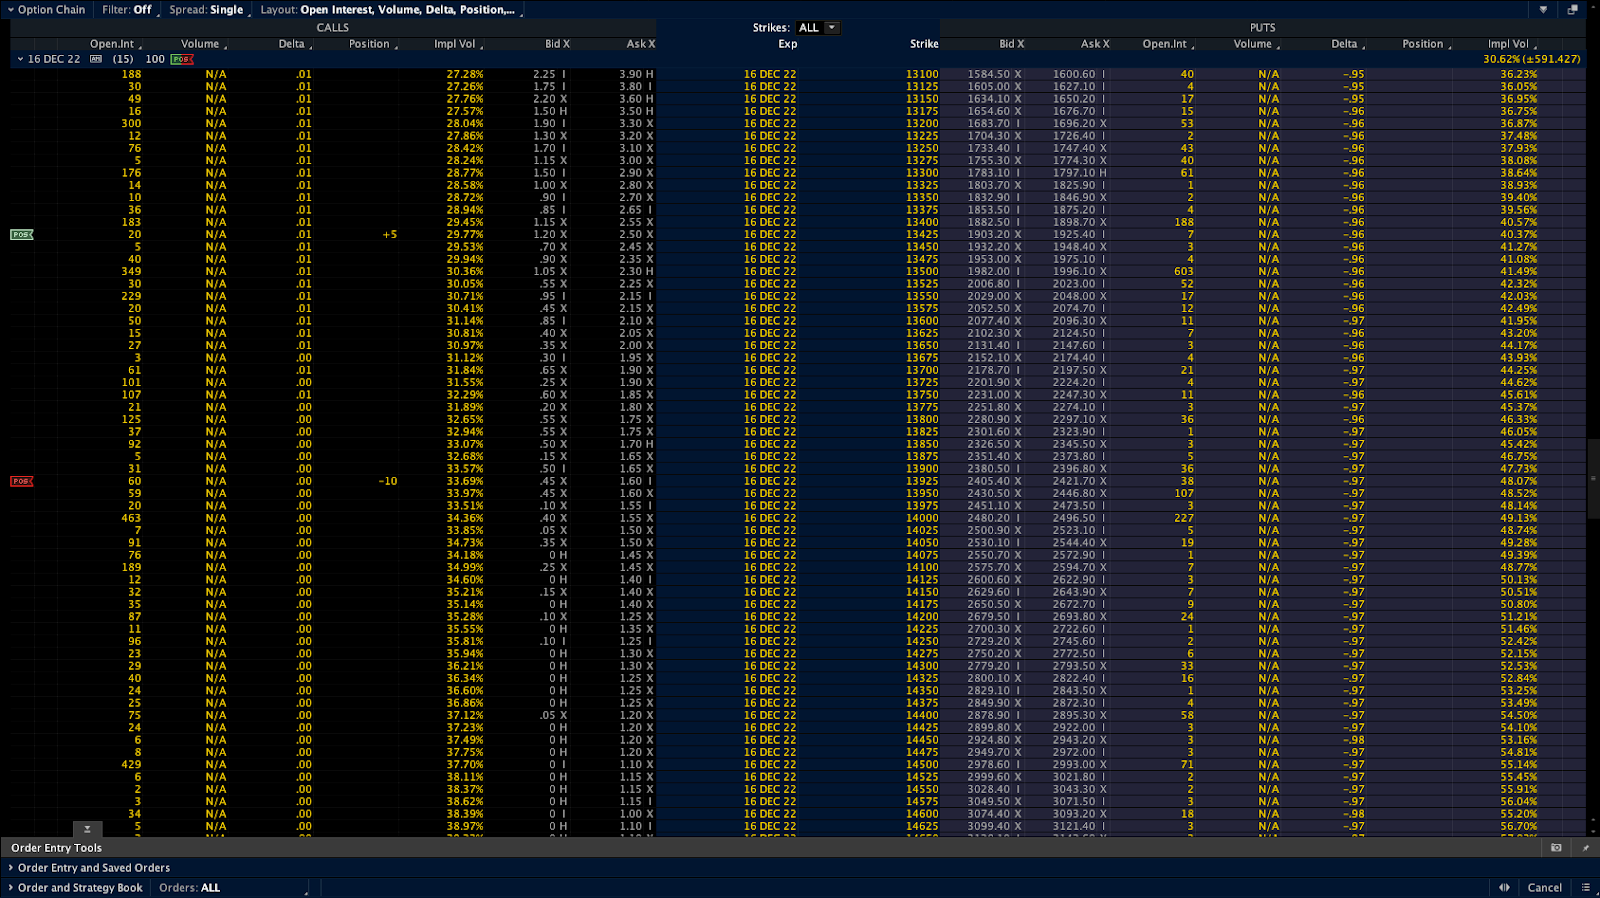
For instance, low-cost 500-1000 points wide call ratio spreads (buy the closer leg, sell two of the farther legs) expiring in fifteen days may work well (e.g., SELL -1 1/2 BACKRATIO NDX 100 16 DEC 22 [AM] 13425/13925 CALL @.20 CR LMT). The immediate concern with these strategies is your exposure to Delta (i.e., direction) and Gamma (i.e., does movement make you money).
Graphic: Retrieved from the Charles Schwab Corporation-owned (NYSE: SCHW) thinkorswim platform. Nasdaq 100 options prices.
If you are exposed to +Delta and +Gamma, your trade makes money in an increasing way as the market rises, barring any other changes (e.g., passage of time, increases in volatility, etc).
If you are exposed to -Delta and -Gamma, your trade loses money in an increasing way as the market rises, barring any other changes. Should the movement happen quickly, and volatility rise, which is not likely, then that worsens the situation.
This is not advice but a framework for how to act on the theory we talk about on a daily basis. In short, don’t sell calls and puts blindly. Adding, the above trade may not provide safe exposure to the market upside or downside. Given the sideways trade and contraction in ranges, we aim to be well-positioned for a move from low to high volatility. Stay safe and watch your risk.
Noting, should you sell IVOL, the market trade lower, and the demand for IVOL rises, you may be left in an awkward position; big market drops statistically add to the likelihood of more drops.
As of 7:15 AM ET, Wednesday’s regular session (9:30 AM – 4:00 PM ET), in the S&P 500, is likely to open in the upper part of a positively skewed overnight inventory, inside of prior-range and -value, suggesting a limited potential for immediate directional opportunity.
Our S&P 500 pivot for today is $3,965.25.
Key levels to the upside include $3,997.00, $4,024.00, and $4,051.00.
Key levels to the downside include $3,923.00, $3,909.25, and $3,871.25.
Click here to load today’s key levels into the web-based TradingView platform. All levels are derived using the 65-minute timeframe. New links are produced, daily.
Graphic: 65-minute profile chart of the Micro E-mini S&P 500 Futures.
Definitions
Volume Areas: Markets will build on areas of high-volume (HVNodes). Should the market trend for long periods of time, it will be identified by low-volume areas (LVNodes). LVNodes denote directional conviction and ought to offer support on any test.
If participants auction and find acceptance in an area of a prior LVNode, then future discovery ought to be volatile and quick as participants look to HVNodes for favorable entry or exit.
Gamma: The sensitivity of an option’s Delta to changes in the underlying asset’s price.
Volga: The sensitivity of an option’s Vega to changes in the underlying’s implied volatility.
POCs: Denote areas where two-sided trade was most prevalent in a prior day session. Participants will respond to future tests of value as they offer favorable entry and exit.
MCPOCs: Denote areas where two-sided trade was most prevalent over numerous sessions. Participants will respond to future tests of value as they offer favorable entry and exit.
Volume-Weighted Average Prices (VWAPs): A metric highly regarded by chief investment officers, among other participants, for quality of trade. Additionally, liquidity algorithms are benchmarked and programmed to buy and sell around VWAPs.
About
In short, an economics graduate working in finance and journalism.
Capelj spends most of his time as the founder of Physik Invest through which he invests and publishes daily analyses to subscribers, some of whom represent well-known institutions.
Separately, Capelj is an equity options analyst at SpotGamma and an accredited journalist interviewing global leaders in business, government, and finance.
The daily brief is a free glimpse into the prevailing fundamental and technical drivers of U.S. equity market products. Join the 1,200+ that read this report daily, below!
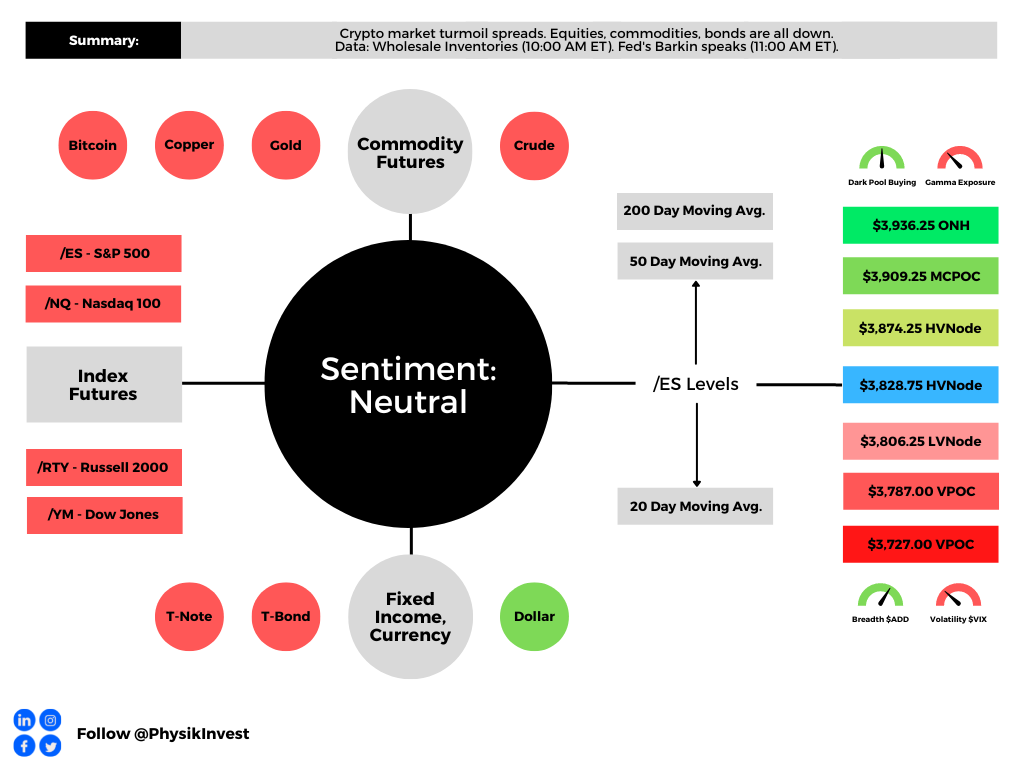
Graphic updated 8:45 AM ET. Sentiment Neutral if expected /ES open is inside of the prior day’s range. /ES levels are derived from the profile graphic at the bottom of the following section. Levels may have changed since initially quoted; click here for the latest levels. SqueezeMetrics Dark Pool Index (DIX) and Gamma (GEX) calculations are based on where the prior day’s reading falls with respect to the MAX and MIN of all occurrences available. A higher DIX is bullish. At the same time, the lower the GEX, the more (expected) volatility. Learn the implications of volatility, direction, and moneyness. Breadth reflects a reading of the prior day’s NYSE Advance/Decline indicator. VIX reflects a current reading of the CBOE Volatility Index (INDEX: VIX) from 0-100.
Fundamental
A crypto-market leader and a lender of last resort – FTX – co-founded by Sam Bankman-Fried (SBF) was little questioned by many. It appears, however, that the company had growing pain points.
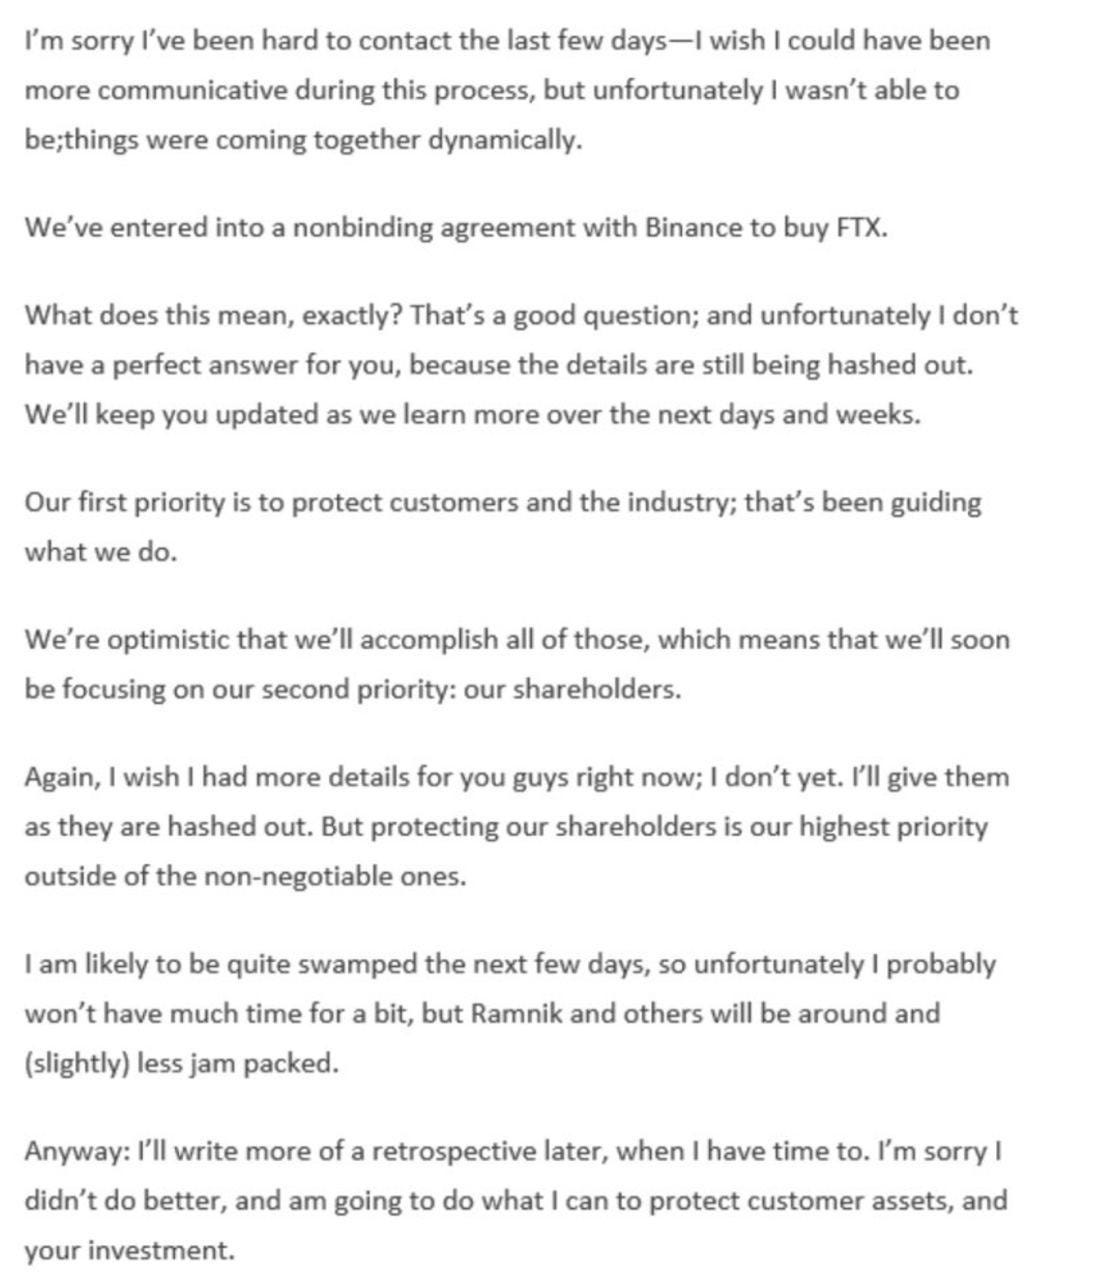
Events are developing quickly, too add. Here is a note that SBF issued to investors after entering into a nonbinding agreement with Binance.
Graphic: Retrieved from @gurgavin on Twitter. Read the story on The Block.
In short, there’s little substance.
Let’s go through the motions and start unpacking this debacle. Should we have loose ends, we’ll address those in the coming days.
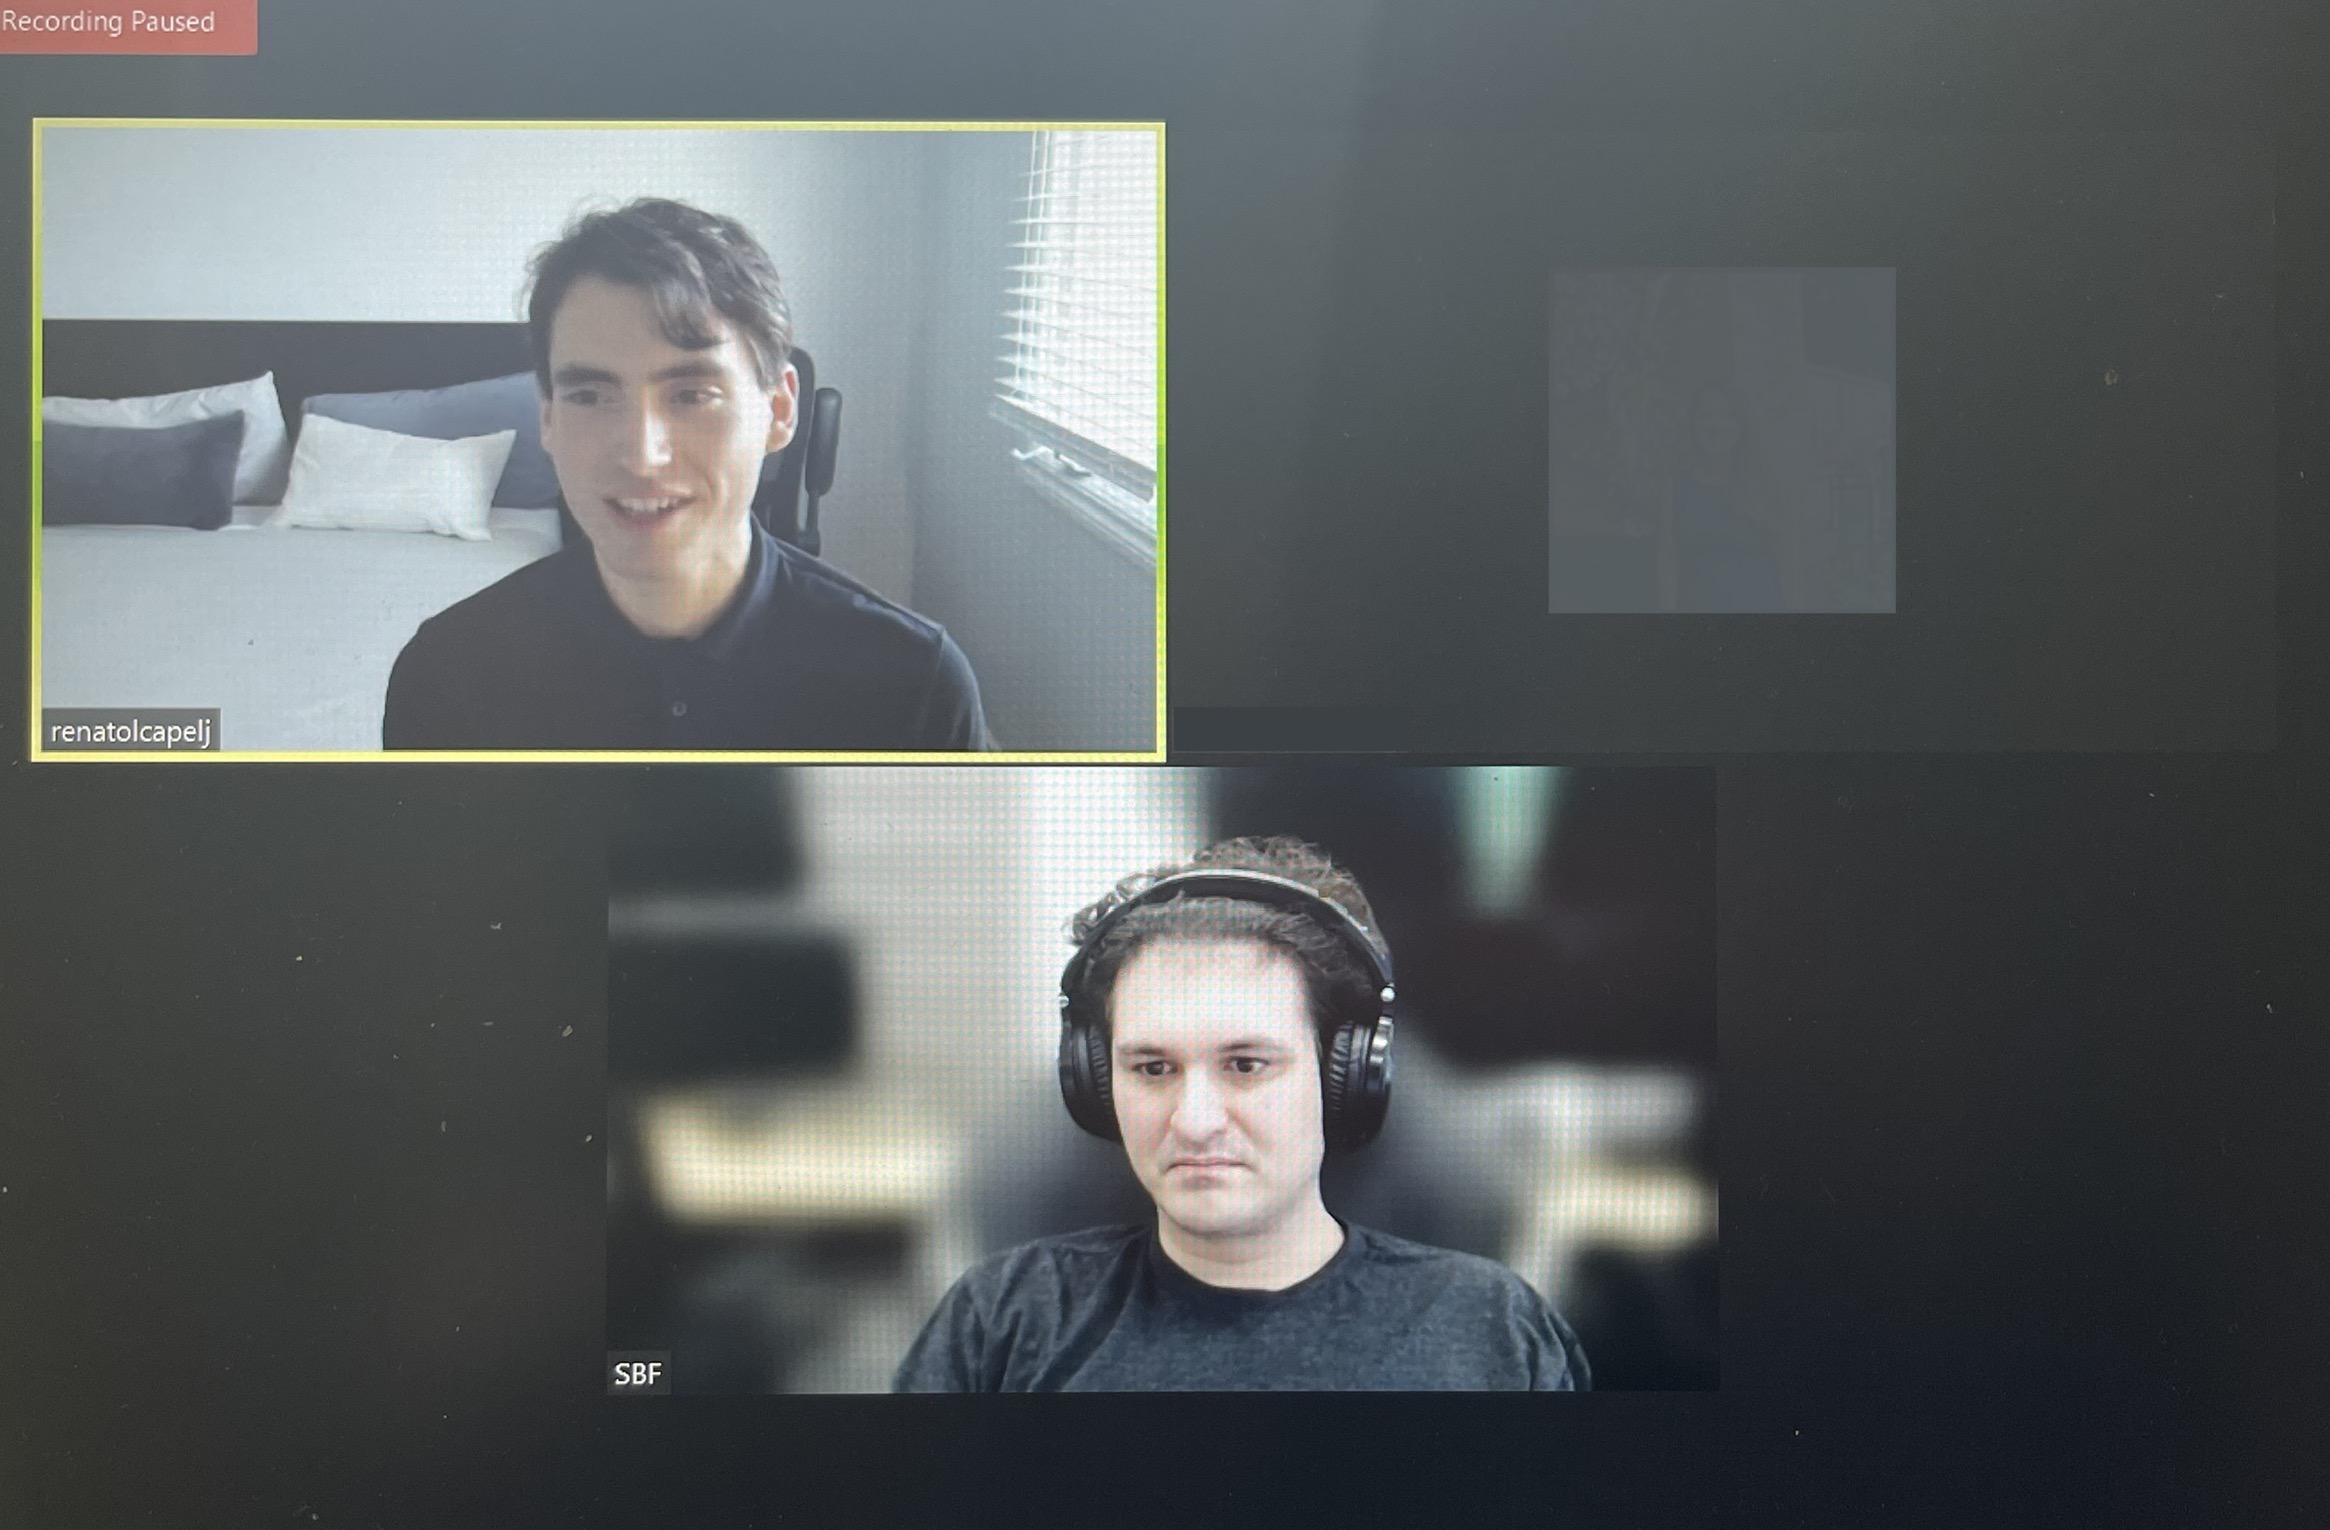
In late December of 2021, I spoke with SBF regarding his background and aims with FTX. The resulting work was published on Benzinga.com, where I continue to work part-time as a writer and project lead.
Graphic: Retrieved from Renato Leonard Capelj. On the top is Renato Leonard Capelj. On the bottom is SBF.
In short, SBF is an MIT alumnus who started in finance at Jane Street, a trading firm and liquidity provider. Eventually, he saw an opportunity elsewhere; there were spot price inconsistencies across cryptocurrency exchanges.
SBF then founded the firm Alameda Research in 2017. A focus, there, was to extract premiums to spot via arbitrage. SBF et al would purchase Bitcoin (CRYPTO: BTC) domestically, send it to foreign exchanges to sell at higher prices, and, then, convert and wire the funds back.
“You do have to put together this incredibly sophisticated global corporate framework in order to be able to actually do this trade,” SBF said in one conversation. “That’s the real task, the real hard part.”
In light of some frustration with existing exchange offers, SBF founded FTX.com and FTX.US parent FTX Trading Ltd. As late as September 2022, FTX was seeking $1 billion at a value of $32 billion. The firm was looking to become a one-stop-shop for retail and institutional market participants such as FTX brand ambassador and spokesperson Kevin O’Leary who I talked to just prior to my interview with SBF.
“If you’re being compliant internally and also with regulators in each jurisdiction you operate in, you don’t have the option to be off-sides,” O’Leary explained to me on FTX building one of the larger infrastructures institutions’ compliance departments could easily “work with and external auditors can audit.”
Eventually, the exchange grew to become a major player.
FTX was a top-five exchange, adding market share through acquisitions of players like Blockfolio and LedgerX, as well as building a reputation of transparency, or so it appeared, through its work with regulators.
Adding, SBF said to me he wanted FTX to cater to other asset classes and “become a global liquidity venue across the board.” In mid-to-late this year, FTX added stock trading via no-fee brokerage accounts, a follow-through on his vision.
The expansion narrative cooled, however. There was the collapse of the TerraUSD stablecoin, Celsius Network, Three Arrows Capital, and Voyager Digital, which FTX’s subsidiary in the US, FTX.US, won assets to in an auction this year.
At the surface, it appeared FTX was “seemingly untouchable,” as Immutable Holdings’ Jordan Fried explained online. Check out my last chat with Jordan Fried, here.
However, “cracks started to appear [and] people in crypto were taking notice”; the CEOs of both Alameda Research and FTX.US stepped down. Fried added that the situation worsened when Alameda Research’s balance sheet was leaked.
The firm had $14.6 billion in assets (nearly $4 billion in FTT, which is FTX’s utility token, and about $2 billion in FTT token collateral) against $8 billion in liabilities.
“Binance owns a bunch of FTT themselves and, two days ago, Changpeng Zhao (CZ) [who is the] founder of Binance, [said] that SBF … could be lobbying to get regulators to help out FTX more than Binance.” In response, CZ was to “dump all $2 billion of FTT” Binance was holding.
This coincided with a large selling pressure on the FTX utility token. With Alameda Research having ~50% of their assets in FTT, Fried says, “they were dead in the water”. A run appeared likely and, with FTX and Alameda Research’s dealings so intertwined, “the failure of one meant the failure of another.”
On the heels of billions in withdrawals, users weren’t “getting their cash” and, ultimately, in SBF seeking to protect users’ assets, FTX entered into a strategic transaction with Binance.
1) Hey all: I have a few announcements to make.
Things have come full circle, and https://t.co/DWPOotRHcX’s first, and last, investors are the same: we have come to an agreement on a strategic transaction with Binance for https://t.co/DWPOotRHcX (pending DD etc.).
The follow-on impacts of this week’s events, during which SBF saw a ~90% wipeout of his wealth, can be speculated on. Apparent losers include SoftBank Group Corporation’s (OTC: SFTBY) Vision Fund, the Ontario Teachers’ Pension Plan, and Tiger Global Management.
Some, including Arthur Breitman of Tezos (CRYPTO: XTZ), mulled the impact of FTX’s potential divestment from Solana (CRYPTO: SOL) which “took a drubbing Tuesday,” along with just about every other crypto token including Bitcoin.
Noteworthy are the impacts of this crypto-market turmoil in equities. As I stated in a note to SpotGamma subscribers yesterday, following “news of a liquidity crunch at FTX, when the selling accelerated in FTT [] and Bitcoin, so did the selling in the S&P 500.”
“The bottom, in all three products, happened at 2:30 PM ET.”
Graphic: Retrieved by Physik Invest from TradingView.
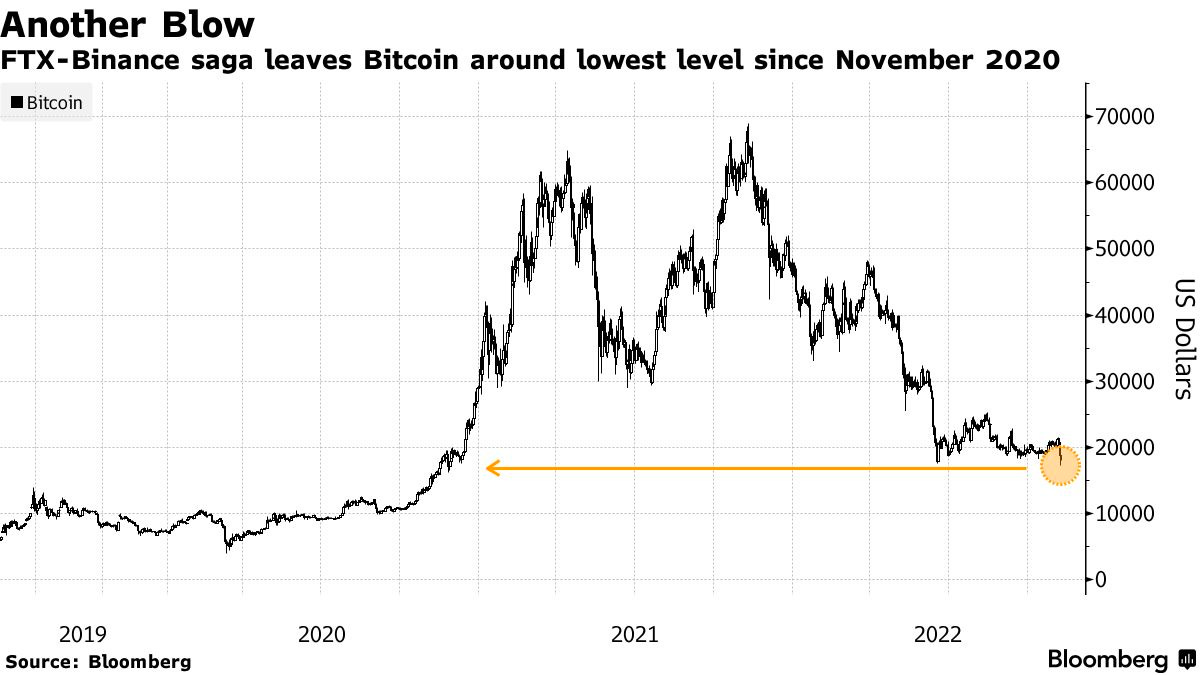
I add that these products – S&P 500 (INDEX: SPX) and Bitcoin – have traded in sync and held positive correlations.
In short, both are recipients of the same risk-on and -off flows. Easy monetary policies cut financial asset volatility and pushed market participants into riskier investments. In short, it was easier to borrow and make longer-duration bets on ideas (e.g., crypto and Ponzi-like DeFi, growth, risky private equity investments) with a lot of promise in the future.
Financial asset investments were more attractive. That’s, in part, why we saw asset inflation early on in 2020 when policymakers embarked on historic interventions.
Monetary authorities cut interest rates and bought bonds, all the while money was sent to people. Risk assets were the first to respond. Then, as the economy reopened, demand picked up, supply chains tightened, and prices in the real economy inflated.
As we added on Monday, de-globalization and persistent supply chokepoints (e.g., Ukraine and Russia) have done little to help. Inflation remains a problem and investors are seeking safety amid Fed intervention.
Financial assets are in less demand while real assets are in more demand. A disruption (or reversal) in these policies puts at risk the prevailing carry regime. A stock and crypto market drop is, in part, the result of an unwind in carry.
The drop is a deflationary shock, precisely what policymakers are seeking, per Credit Suisse Group AG’s (NYSE: CS) Zoltan Pozsar who says inflation is a structural issue, and “we [have] to generate a round of negative wealth effects to lower demand such that it becomes more in line with the new realities of supply.”
As we established on Monday, that invokes “collateral damage to the US economy,” S&P Global Inc (NYSE: SPGI) economists have put forth “as households and businesses pull back spending and investment.”
For example, just announced today, Meta Platforms Inc (NASDAQ: META), which became wrapped up in the speculativeness of the early 2020s reaching beyond the crypto markets, hence the name change from Facebook Inc, is seeking to cut 11,000 jobs.
Per Bloomberg, “the macroeconomic downturn, increased competition, and ads signal loss have caused [] revenue to be much lower than expected.”
Ultimately, a deflationary pulse manifesting disinflation in consumer prices may prompt the policymakers to reverse on rates and efforts like quantitative tightening (QT), the (out)flow of capital from capital markets.
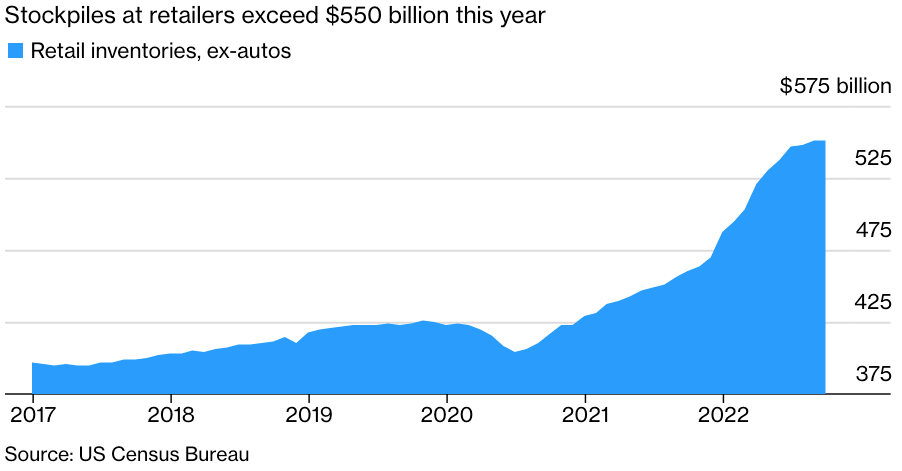
We’re seeing demand erode and many businesses starting to suffer the effects of a switch to “just-in-case” from “just-in-time,” according to S&P Global Inc. Inventories (which are to be sold at a loss) are piling up and workers are needed less.
That’s a recession.
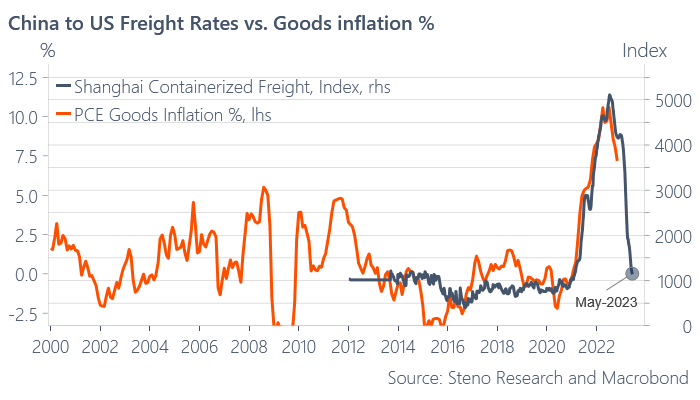
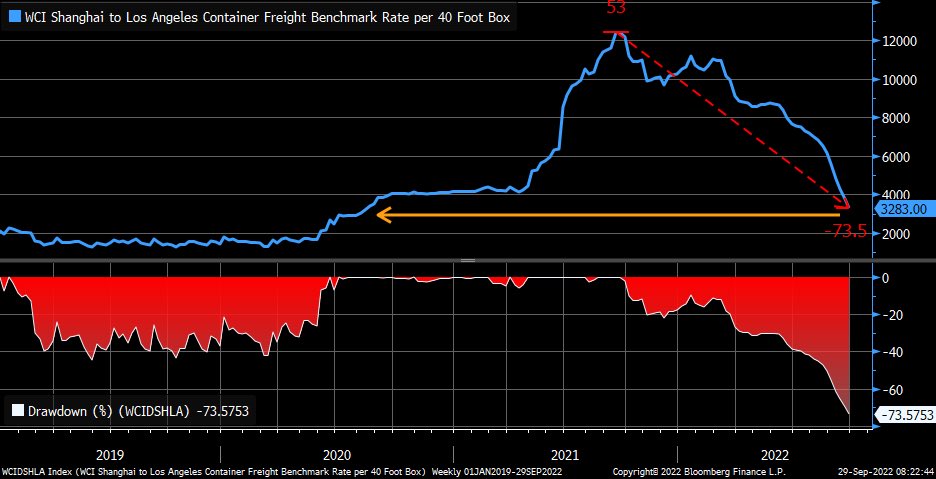
Graphic: Retrieved from Bloomberg. “The overhang is leading to canceled orders, a sharp slowdown in global trade growth and stagnating factory activity. On one hand, it’s good that logistics networks are seeing relief from the logjams that plagued the start of 2022 — ocean-shipping rates have tumbled close to pre-pandemic levels and delivery times are shortening.”
This said, the “risk of recession, whether it is real or merely implied by an inversion of the yield curve, won’t deter the Fed from hiking rates higher faster or from injecting more volatility to build up negative wealth effects.”
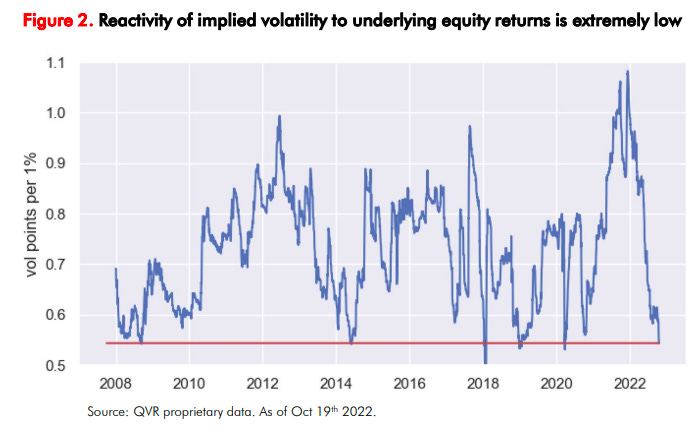
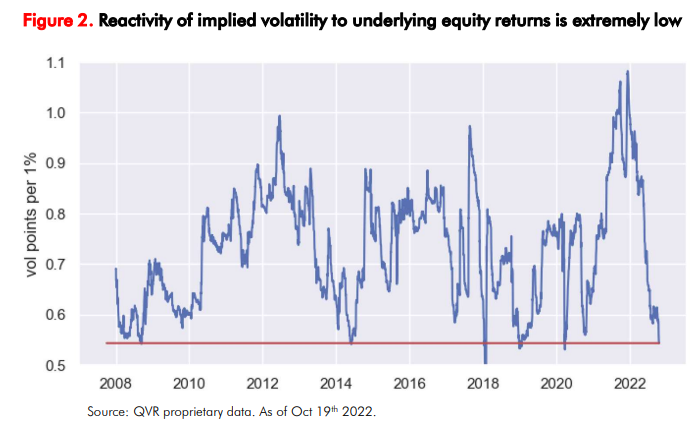
“Rallies could beget more forceful pushback from the Fed,” which is a concern given the poor performance in implied volatility (IVOL) that’s resulted in participants’ disinterest in maintaining their hedges this year; equities’ left tail is growing.
Graphic: Retrieved from Bloomberg. Initially created by QVR Advisors. “When shares drop, demand for fresh protection remains subdued given the unusually thin positioning among big money. At the same time, put owners quickly book profits, often leading to a drop in implied vol.
In summary, there’s no longer “a disinterest and unimportance to cash flows.” The commitment to reducing liquidity and credit has consequences on the real economy and asset prices which rose and kept the deflationary pressure of policies at bay.
It is elevated volatility and persistent declines that are to prompt investors to lower their selling prices in risk(ier) assets (e.g., options bets, metals, cryptocurrency and stablecoins, equities, bonds), and compete for cash.
Positioning
Based on traders’ current positioning, the market, absent exogenous shocks, is more so prone to sharp upside reversals and a slow(er) grind lower.
As the former Bridgewater Associate Andy Constan explained to me once, therefore, you “want Deltas and leverage” via options trades that are defined risk and two-to-four months out in maturity.
We shall go more into this, later.
Technical
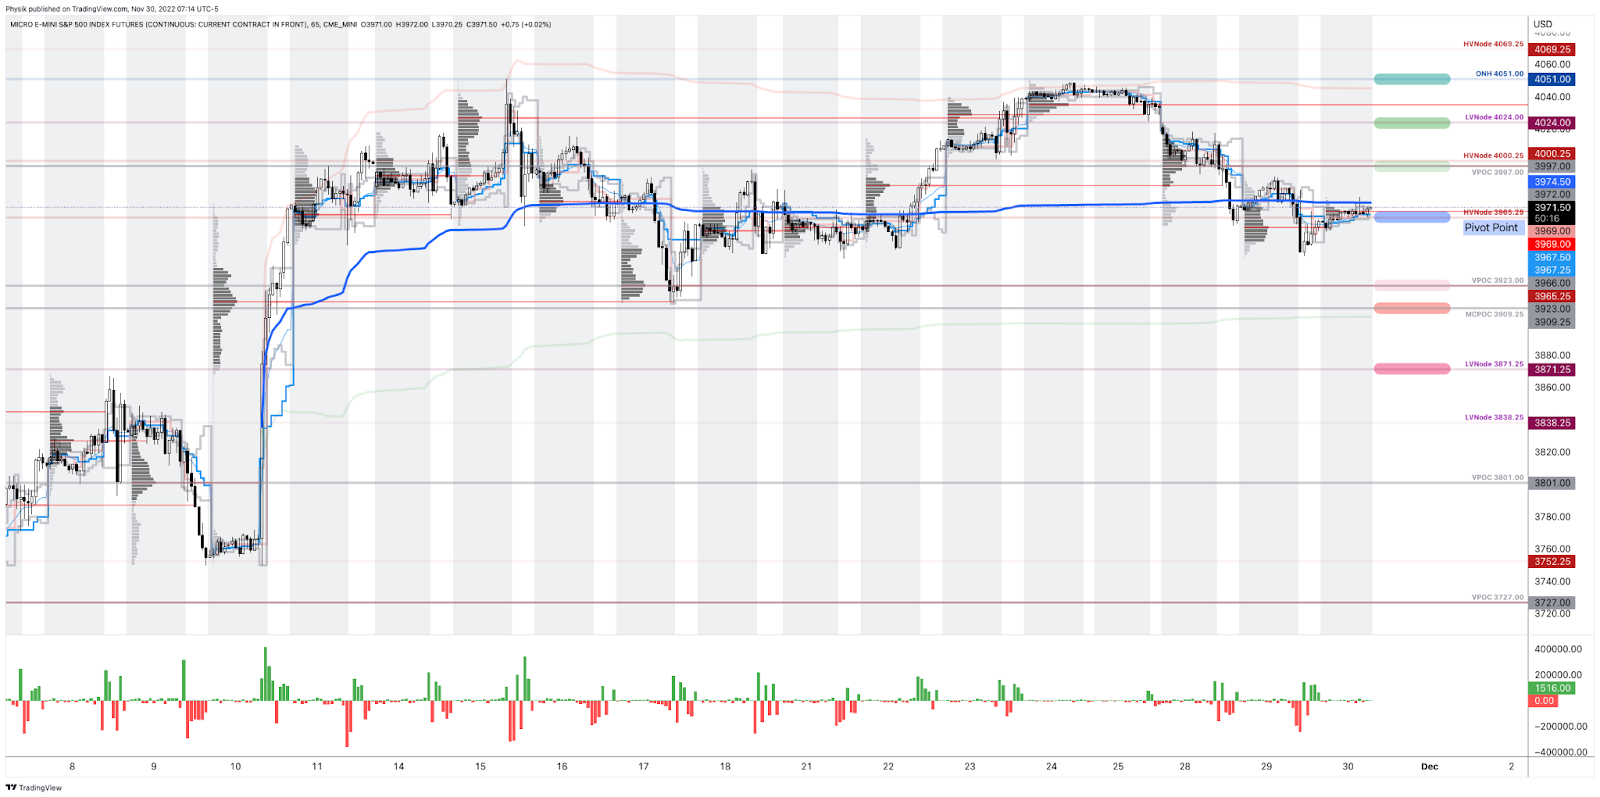
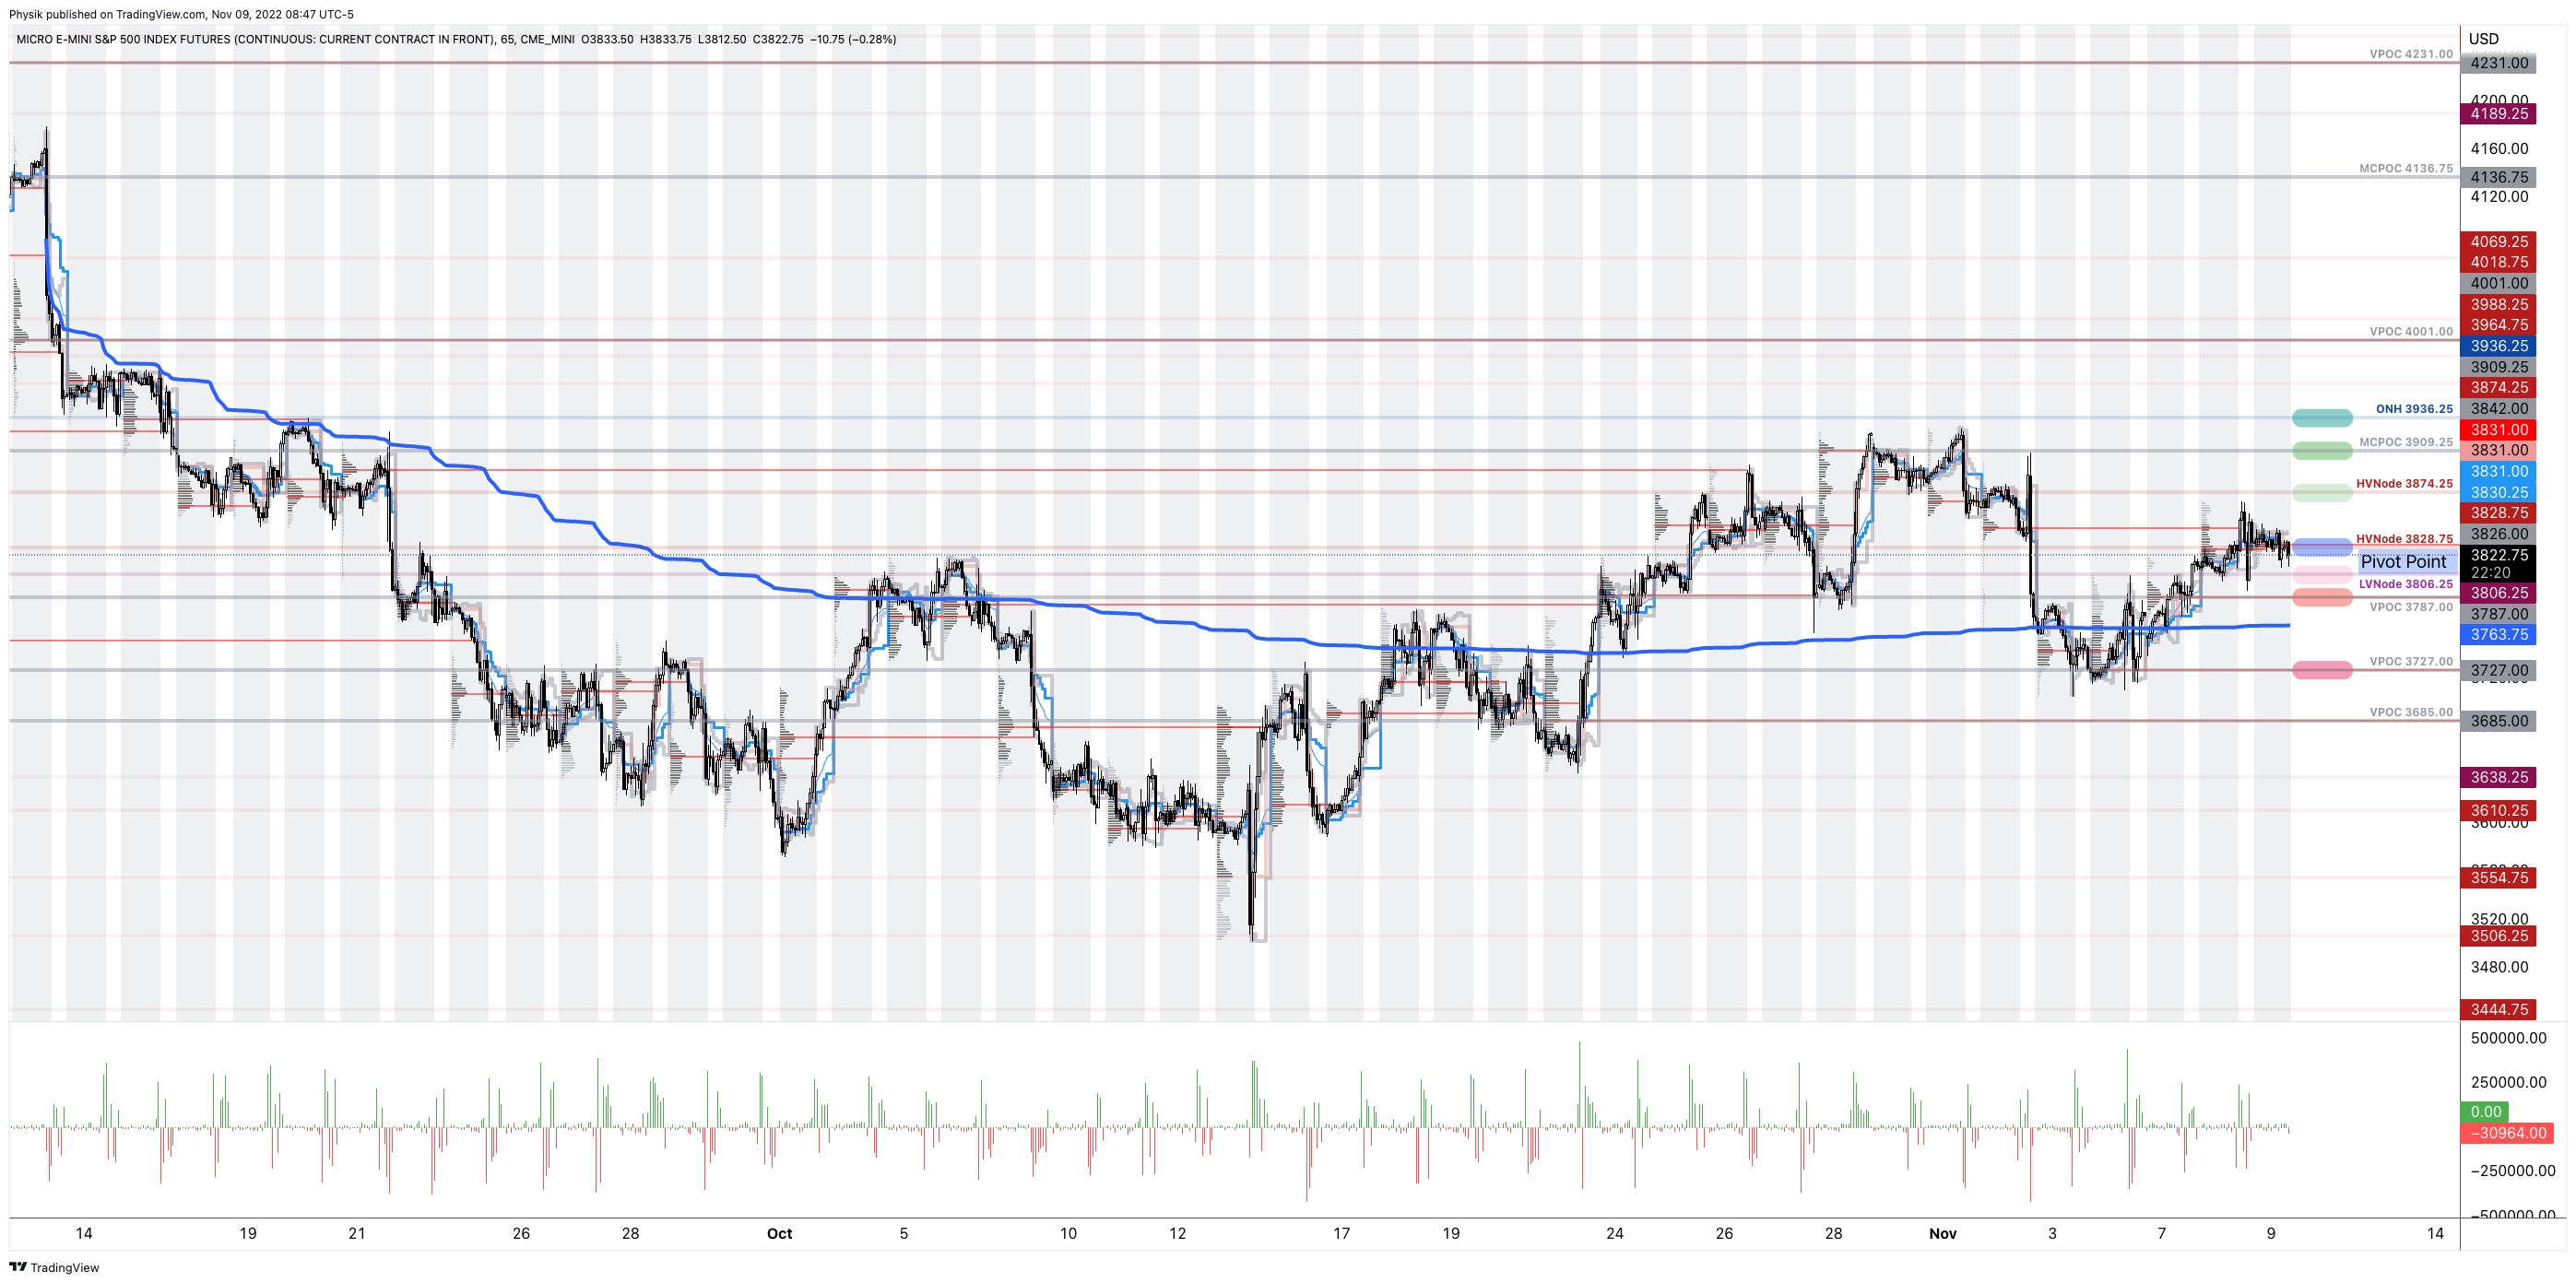
As of 8:45 AM ET, Wednesday’s regular session (9:30 AM – 4:00 PM ET), in the S&P 500, is likely to open in the lower part of a negatively skewed overnight inventory, inside of prior-range and -value, suggesting a limited potential for immediate directional opportunity.
In the best case, the S&P 500 trades higher.
If above the $3,828.75 HVNode, the $3,874.25 HVNode is in play. Initiative trade beyond the latter could reach as high as the $3,909.25 MCPOC and $3,936.25 ONH, or higher.
In the worst case, the S&P 500 trades lower.
If above the $3,828.75 HVNode, the $3,806.25 LVNode is in play. Initiative trade beyond the latter could reach as low as the $3,787.00 VPOC and $3,727.00 VPOC, or lower.
Click here to load today’s key levels into the web-based TradingView charting platform. Note that all levels are derived using the 65-minute timeframe. New links are produced, daily.
Graphic: 65-minute profile chart of the Micro E-mini S&P 500 Futures.
Definitions
Volume Areas: A structurally sound market will build on areas of high volume (HVNodes). Should the market trend for long periods of time, it will lack sound structure, identified as low volume areas (LVNodes). LVNodes denote directional conviction and ought to offer support on any test.
If participants were to auction and find acceptance into areas of prior low volume (LVNodes), then future discovery ought to be volatile and quick as participants look to HVNodes for favorable entry or exit.
POCs: POCs are valuable as they denote areas where two-sided trade was most prevalent in a prior day session. Participants will respond to future tests of value as they offer favorable entry and exit.
MCPOCs: POCs are valuable as they denote areas where two-sided trade was most prevalent over numerous day sessions. Participants will respond to future tests of value as they offer favorable entry and exit.
About
After years of self-education, strategy development, mentorship, and trial-and-error, Renato Leonard Capelj began trading full-time and founded Physik Invest to detail his methods, research, and performance in the markets.
Capelj also develops insights around impactful options market dynamics at SpotGamma and is a Benzinga reporter.
In no way should the materials herein be construed as advice. Derivatives carry a substantial risk of loss. All content is for informational purposes only.
The daily brief is a free glimpse into the prevailing fundamental and technical drivers of U.S. equity market products. Join the 1,190+ that read this report daily, below!
Graphic updated 11:00 AM ET. Sentiment Neutral if expected /ES open is inside of the prior day’s range. /ES levels are derived from the profile graphic at the bottom of the following section. Levels may have changed since initially quoted; click here for the latest levels. SqueezeMetrics Dark Pool Index (DIX) and Gamma (GEX) calculations are based on where the prior day’s reading falls with respect to the MAX and MIN of all occurrences available. A higher DIX is bullish. At the same time, the lower the GEX, the more (expected) volatility. Learn the implications of volatility, direction, and moneyness. Breadth reflects a reading of the prior day’s NYSE Advance/Decline indicator. VIX reflects a current reading of the CBOE Volatility Index (INDEX: VIX) from 0-100.
Administrative
After a one-month hiatus, the Daily Brief by Physik Invest is back, albeit with new inspiration and direction.
Previously, the letter was focused on analyses of secondary and tertiary sources. New for the letter will be the inclusion of primary source information. It will be some time before these changes are most noticeable but that’s the general direction.
For instance, interviewing a country’s economic minister on policy and discussing how that policy impacts markets, at the end of it all, is on the table.
That said, apologies for not being there for the past month. I found a lot happened and I could not rid myself of the desire to unpack. This letter helps me structure trades through which real capital is at risk.
Not having the full picture did me a disservice, in short.
Going forward, I will try to feature a good mix of detail and pointedness. Take care and I look forward to learning and earning together!
Fundamental
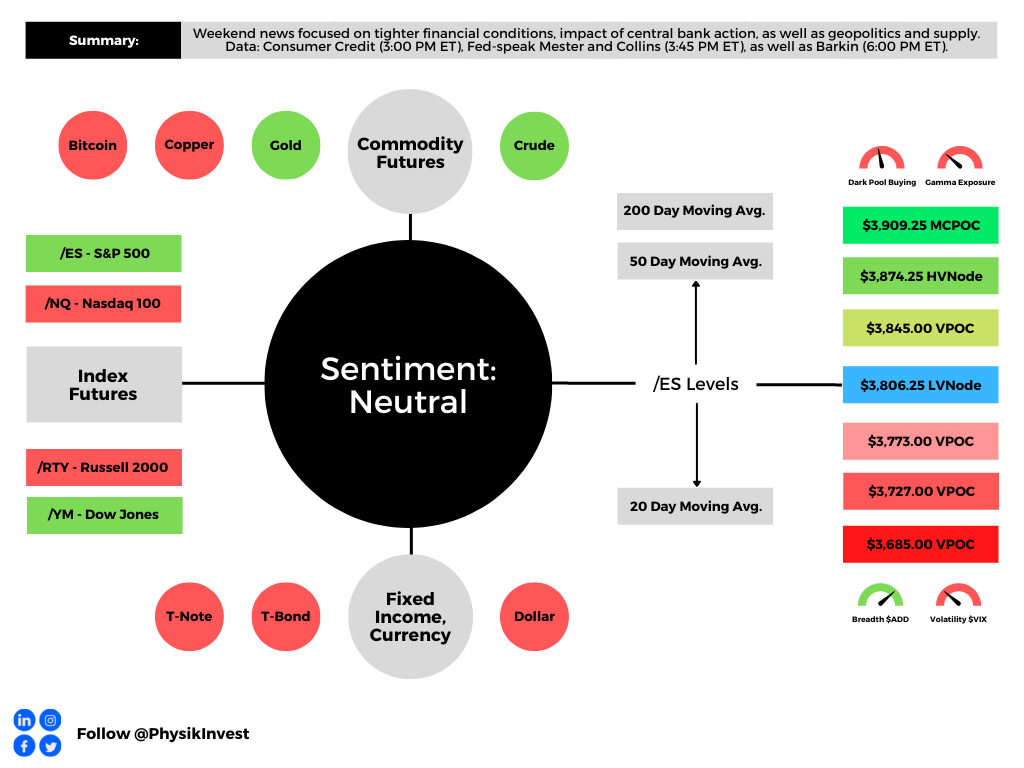
Weekend news was centered around the tightening of financial conditions, the impact of central bank action, as well as geopolitics (e.g., Lithuania opening a trade office in Taiwan), and supply chokepoints.
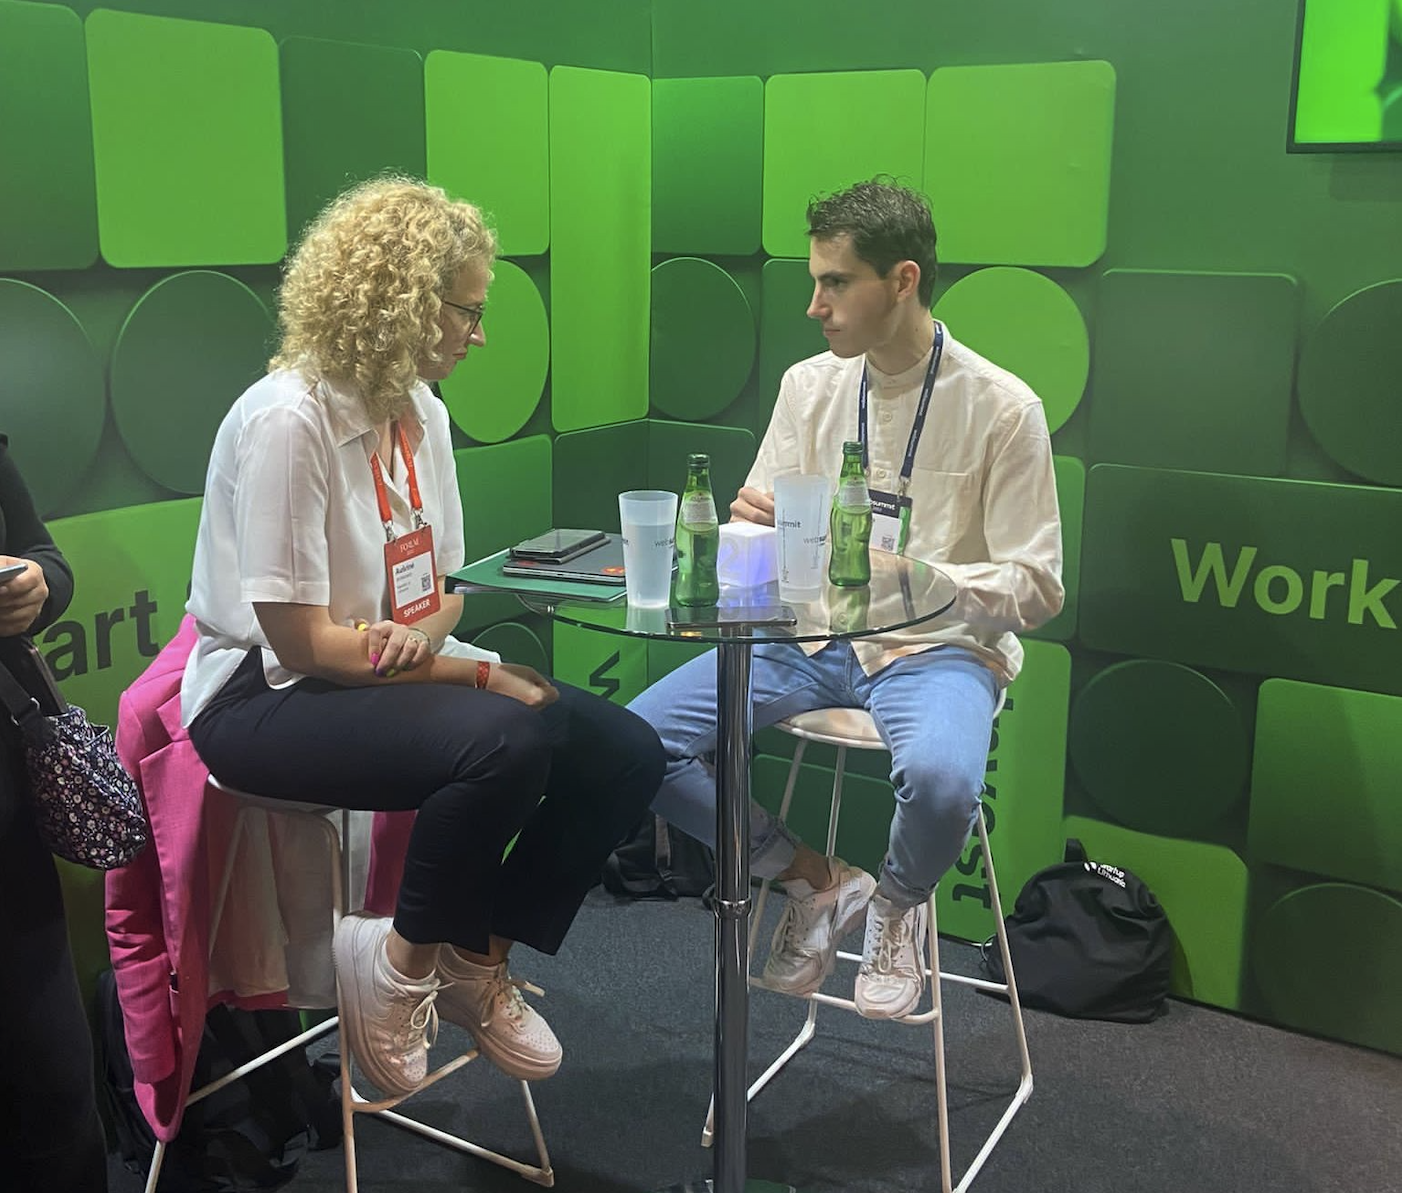
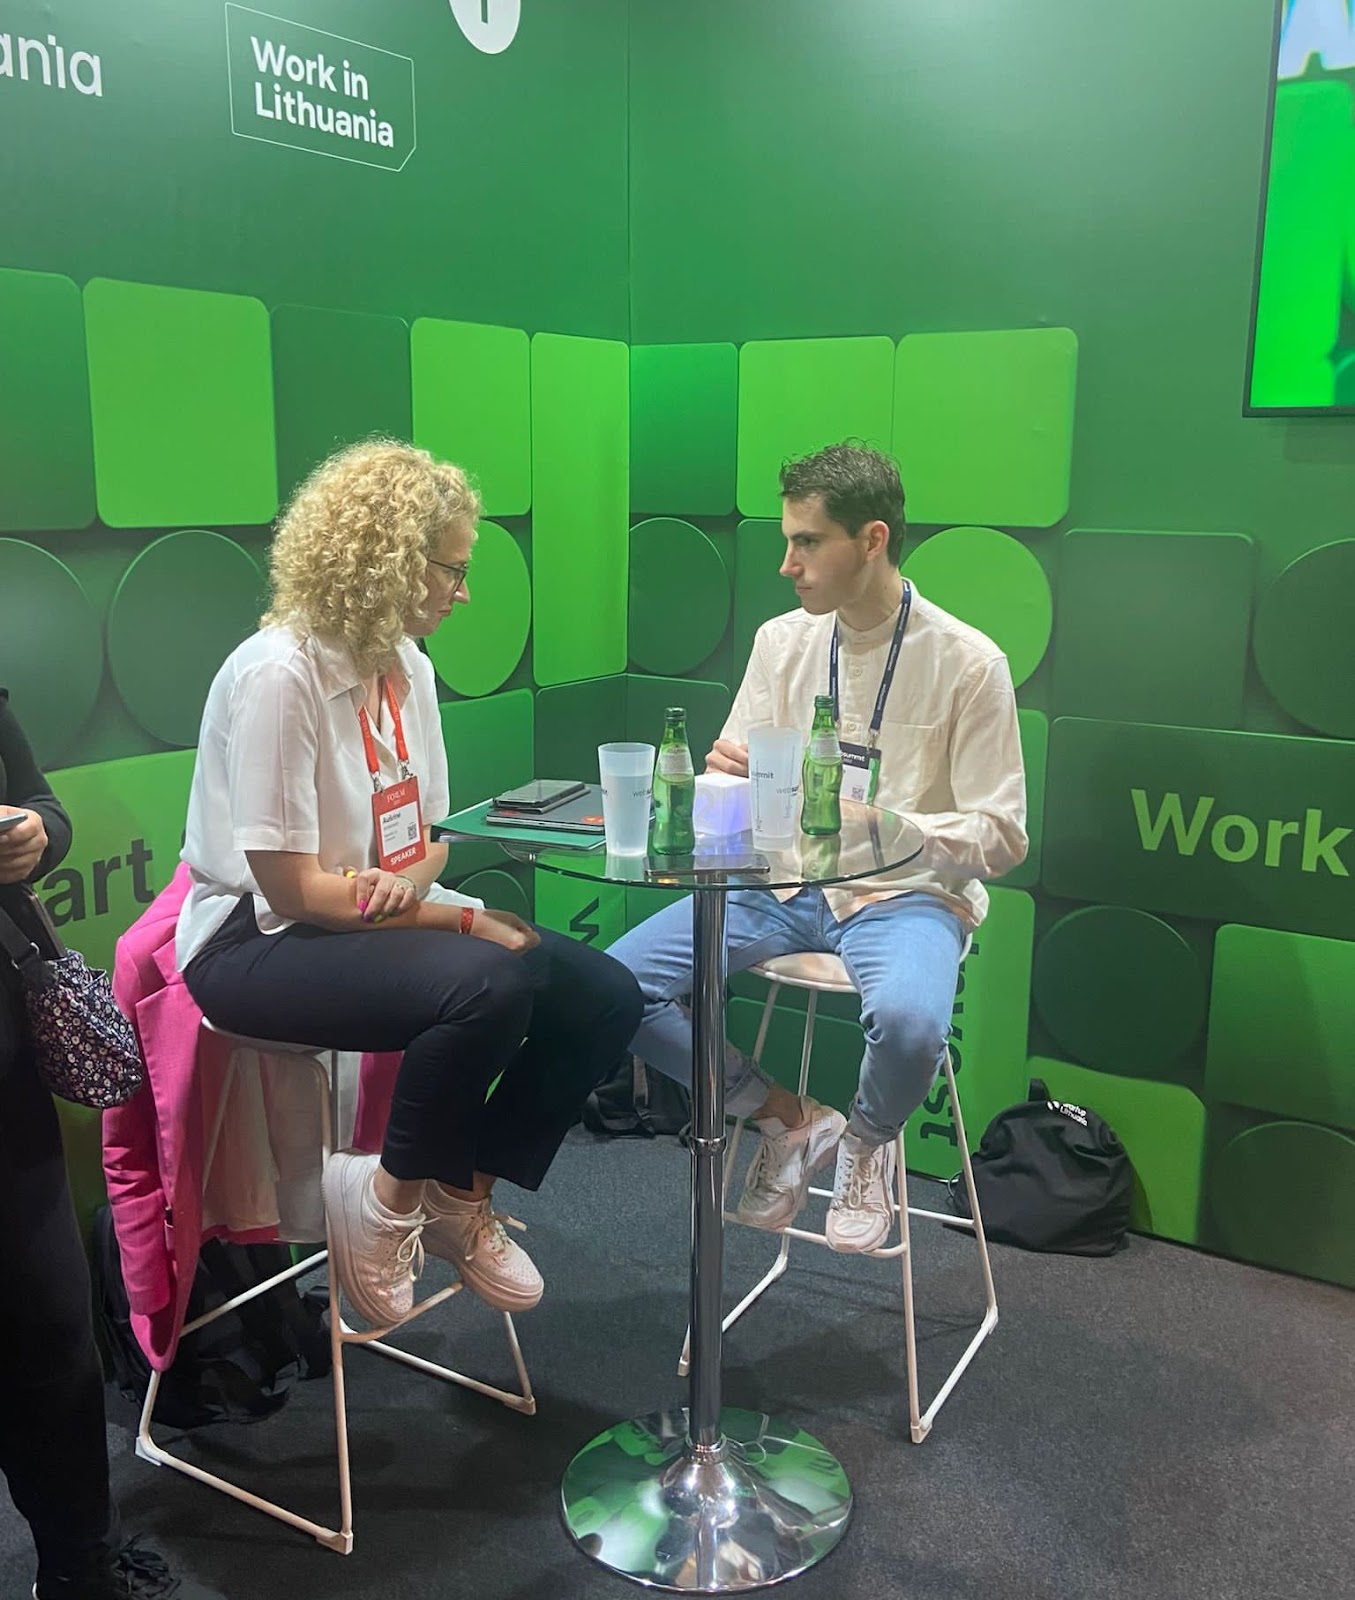
By happenstance, I interviewed the Lithuanian Economy Minister Ausrine Armonaite, quoted by Bloomberg in the above story, last week in Lisbon. More on this, later.
Graphic: Provided by the Lithuanian Delegation. Left, Lithuanian Economy Minister Ausrine Armonaite. Right, Renato Leonard Capelj conducting an interview on behalf of Benzinga.com.
The One Big Thing:
With labor still tight, former New York Fed President Bill Dudley commented that “there’s a lot of work to do … [so] inflation expectations don’t become unanchored” and force “something really, really harsh later.”
Unfortunately, the impact of actions here, in the US, is not isolated.
US tightening pains the rest of the world, too. Stronger dollars pressure emerging-market economies with dollar-denominated debts. This, ultimately, works to upend the dollar’s role as a reserve.
Margin Compression, Dollar Debt:
Dollar strength feeds margin compression (just now filtering through, according to Kai Volatility’s Cem Karsan, and impacting dollar-denominated debt), adding to the “billion[s] less in demand for assets per day” via quantitative tightening (QT).
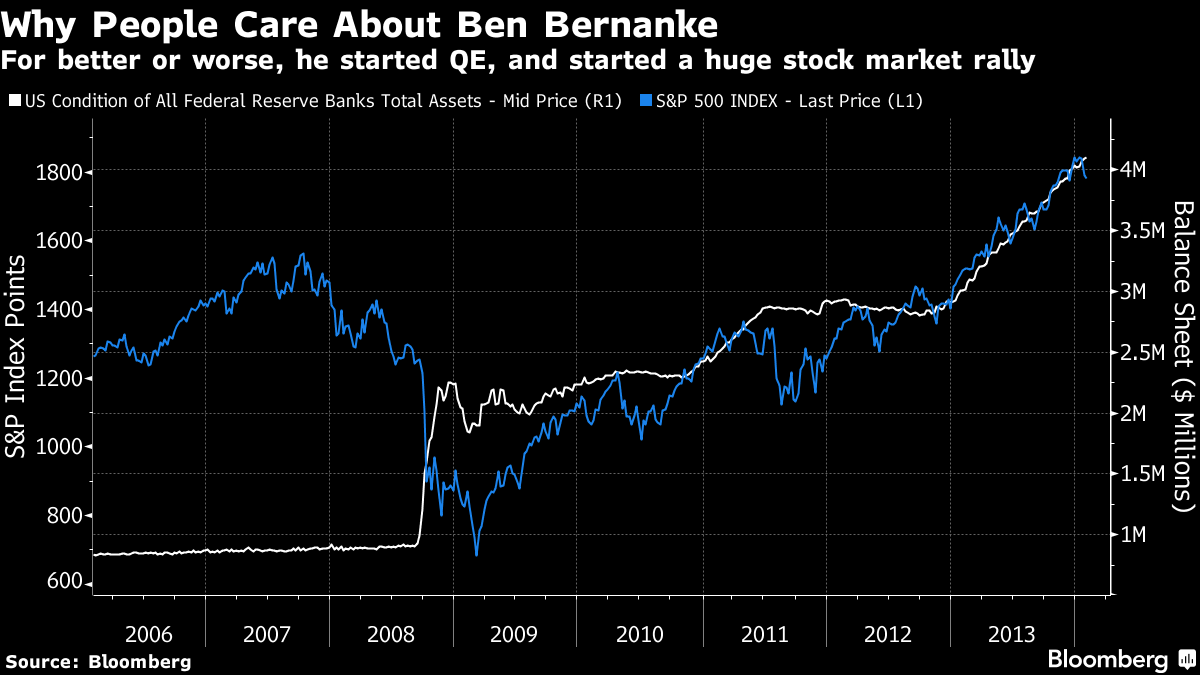
As a refresher, quantitative easing (QE) lowers interest rates and makes investments in financial assets more attractive. This bolsters asset inflation and deflation in the real economy.
Graphic: Retrieved from Bloomberg. The chart is an example showing “money-printing or ‘quantitative easing’ that [Ben Bernanke] pioneered seemed to prop up the stock market.”
QT Compounds Rising Rate Impact:
Moreover, in 2020, policymakers embarked on historic interventions.
Monetary authorities cut interest rates and bought bonds, all the while money was sent to people. Risk assets were the first to respond. Then, as the economy reopened, demand picked up, supply chains (that were slowed) tightened, and prices in the real economy inflated.
Threats to globalization and persistent supply chokepoints (e.g., Ukraine and Russia) have done little to help. Inflation remains a problem and investors are seeking safety amid Fed intervention.
Financial assets are in less demand while real assets are in more demand; sticky inflation and the policymaker reactions are putting in jeopardy dollar carry (mentioned above) and the S&P 500, a focus point for this letter and a center of the global carry regime, among other things.
Responses Invoke Collateral Damage:
As Credit Suisse Group AG’s Zoltan Pozsar summarizes, inflation is a structural issue, and “we [have] to generate a round of negative wealth effects to lower demand such that it becomes more in line with the new realities of supply.”
That invokes “collateral damage to the US economy,” S&P Global Inc (NYSE: SPGI) economists have put forth “as households and businesses pull back spending and investment.”
Ultimately, “[a]s demand erodes, businesses that changed inventory strategy to ‘just-in-case’ from ‘just-in-time’ are left with full shelves to unwind at a loss and less need for workers that were in high demand just a few months ago.” That’s a recession.
Positioning
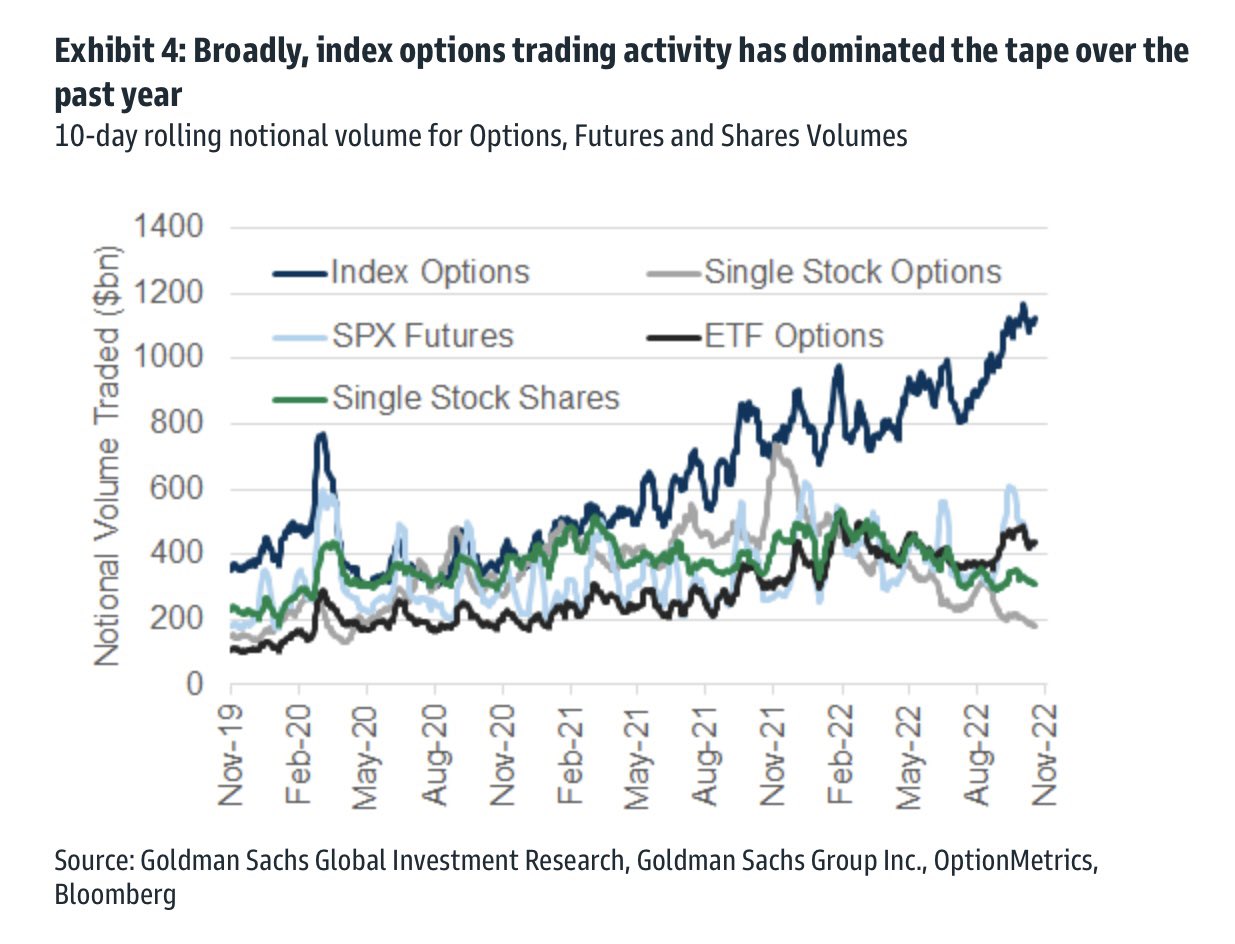
Equity market implied volatility (IVOL) remains subdued and part of the blame rests on the (1) growth of derivatives and …
Graphic: Retrieved from Goldman Sachs Group Inc (NYSE: GS). Reposted by Rob Emrich III.
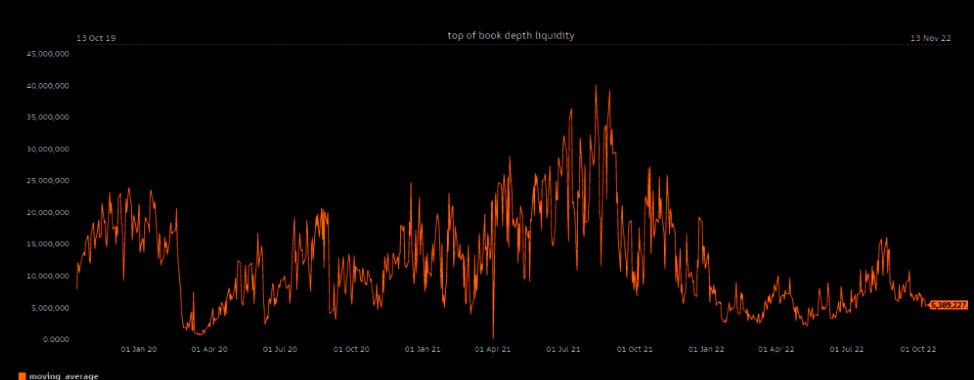
(2) a lower liquidity environment in which the hedging of these derivatives matters more.
Graphic: Retrieved from Goldman Sachs Group Inc (NYSE: GS). Taken from The Market Ear.
To recap, equity IVOL remains subdued, in part, because traders hedged into the 2022 decline.
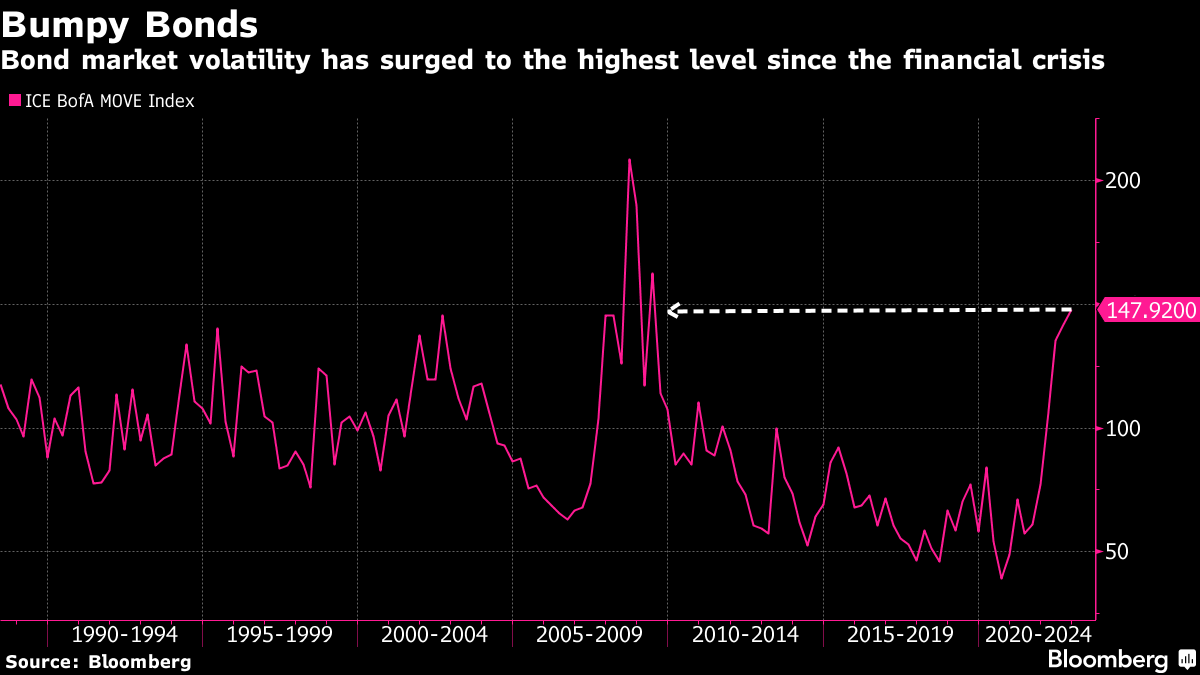
The liquidity providers’ response to the monetization of protection (i.e., trader sell put → liquidity provider buy put and stock and/or futures to hedge), as well as decreases in demand for equity exposure (and new protection), is keeping the Cboe Volatility Index (INDEX: VIX) tame while measures such as the Merrill Lynch Options Volatility Estimate (INDEX: MOVE) are surging.
As well put in a recent Bloomberg article quoting QVR Advisors’ Benn Eifert, “[e]veryone was prepared for another jarring market crash, and that, in essence, is why certain categories of protective options have failed to pay off this year.”
Graphic: Retrieved from Bloomberg. Initially created by QVR Advisors. “When shares drop, demand for fresh protection remains subdued given the unusually thin positioning among big money. At the same time, put owners quickly book profits, often leading to a drop in implied vol.
In support, IPS Strategic Capital’s Pat Hennessy puts forth that equity positioning is light and, “[I]f you have little to no equity exposure to hedge, why would you be buying puts?” That is all the while “[t]he last 5 years is still fresh in PMs heads though. This means that they have been quick to buy calls on any sign of a market bounce.”
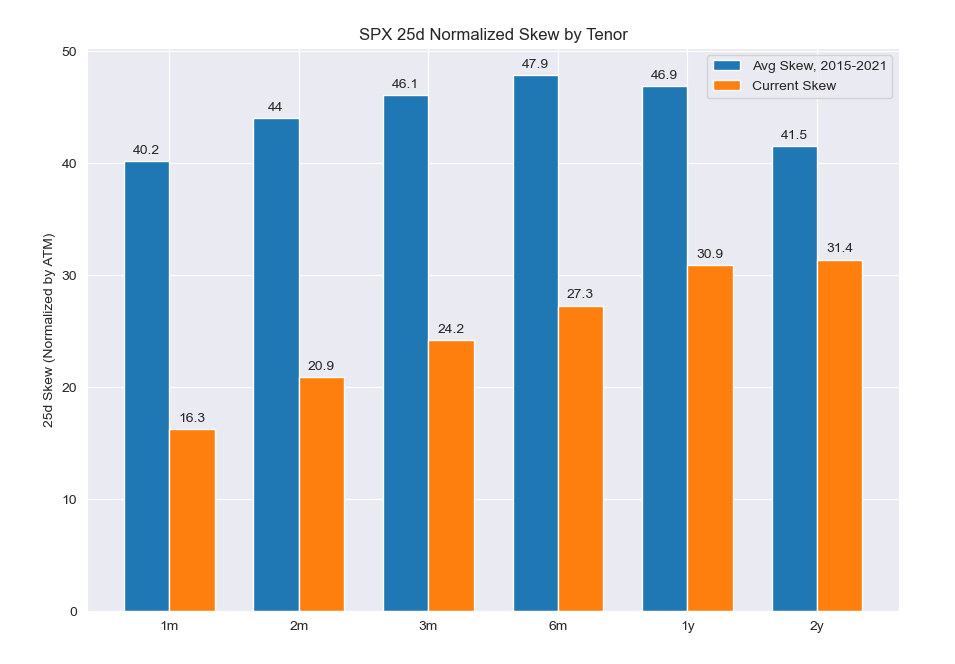
Another takeaway is that with skew at “near all-time lows, … [and] the highest rates we’ve seen in 15 years, [] longer dated collars [are] an attractive trade for those who are worried about the performance of stocks over the next year but do not want to sell or try timing the market.”
Graphic: Retrieved from Pat Hennessy of IPS Strategic Capital.
A last big takeaway includes some loss of structural support from hedging flows.
To explain, often, traders hedge into impactful events such as elections and Fed rate decisions. The demand for protection will pressure markets indirectly. After, however, the decay, as well as the removal of that protection, indirectly supports the market.
Graphic: Retrieved from Bespoke on Twitter. Into Fed days, traders often demand protection. Barring the worst case, traders’ closure of this protection bolsters a price rise, after. The same has been observed after elections (e.g., November 2020 election bottom).
As it sits, traders are hedged into events such as the elections. Per SpotGamma, “[i]f nothing bad happens, and traders close those puts, that would likely bolster a rally.”
This coincides with the market’s entry into a period of lower liquidity (i.e., the holiday season). It’s during this period the effects of decay accelerate and a lack of liquidity, per Karsan, makes markets sensitive to those positive positioning flows.
Ultimately, the very poor hedging that’s going on, heading into the next rally, is going to set the stage for a large tail, Karsan adds. Traders, who aren’t as well hedged, will seek protection and this will pressure markets, adding to any macro-type selling.
More explanation in the coming letters.
Technical
As of 6:30 AM ET, Monday’s regular session (9:30 AM – 4:00 PM ET), in the S&P 500, is likely to open in the upper part of a positively skewed overnight inventory, inside of prior-range and -value, suggesting a limited potential for immediate directional opportunity.
In the best case, the S&P 500 trades higher.
Any activity above the $3,806.25 LVNode puts into play the $3,845.00 VPOC. Initiative trade beyond the VPOC could reach as high as the $3,874.25 HVNode and $3,909.25 MCPOC, or higher.
In the worst case, the S&P 500 trades lower.
Any activity below the $3,806.25 LVNode puts into play the $3,773.00 VPOC. Initiative trade beyond the VPOC could reach as low as the $3,727.00 and $3,685.00 VPOC, or lower.
Click here to load today’s key levels into the web-based TradingView charting platform. Note that all levels are derived using the 65-minute timeframe. New links are produced, daily.
Graphic: 65-minute profile chart of the Micro E-mini S&P 500 Futures.
Considerations: Futures tied to the S&P 500 are trading within close proximity to a blue line in the above graphic. This blue line depicts a volume-weighted average price (VWAP) anchored to price action following the release of consumer price data on September 13, 2022.
The VWAP metric is highly regarded by chief investment officers, among other participants, for the quality of trade. Additionally, liquidity algorithms are benchmarked and programmed to buy and sell around VWAPs.
Should the S&P 500 auction away from this level, and come back to it, a prudent response is to fade. If the price is above the VWAP, and it auctions lower, into the VWAP, traders would buy. On the other hand, if the price is below the VWAP, and it auctions higher, into the VWAP, sell.
At this time, S&P 500 prices are near VWAP offering traders lower (directional) opportunities.
Definitions
Volume Areas: A structurally sound market will build on areas of high volume (HVNodes). Should the market trend for long periods of time, it will lack sound structure, identified as low volume areas (LVNodes). LVNodes denote directional conviction and ought to offer support on any test.
If participants were to auction and find acceptance into areas of prior low volume (LVNodes), then future discovery ought to be volatile and quick as participants look to HVNodes for favorable entry or exit.
POCs: POCs are valuable as they denote areas where two-sided trade was most prevalent in a prior day session. Participants will respond to future tests of value as they offer favorable entry and exit.
MCPOCs: POCs are valuable as they denote areas where two-sided trade was most prevalent over numerous day sessions. Participants will respond to future tests of value as they offer favorable entry and exit.
The daily brief is a free glimpse into the prevailing fundamental and technical drivers of U.S. equity market products. Join the 1000+ that read this report daily, below!
Graphic updated 6:45 AM ET. Sentiment Neutral if expected /ES open is inside of the prior day’s range. /ES levels are derived from the profile graphic at the bottom of the following section. Levels may have changed since initially quoted; click here for the latest levels. SqueezeMetrics Dark Pool Index (DIX) and Gamma (GEX) calculations are based on where the prior day’s reading falls with respect to the MAX and MIN of all occurrences available. A higher DIX is bullish. At the same time, the lower the GEX, the more (expected) volatility. Learn the implications of volatility, direction, and moneyness. Breadth reflects a reading of the prior day’s NYSE Advance/Decline indicator. VIX reflects a current reading of the CBOE Volatility Index (INDEX: VIX) from 0-100.
Administrative
Expect no letter on Friday, October 7, 2022.
Fundamental
Markets printed lower, this morning, ahead of the US cash-open. This bonds, commodities, and equities down phenomenon we’ve unpacked in detail many times before.
At its core, supply chokepoints and a hot labor market are keeping inflation high and sticky. To lessen this inflation, policymakers are seeking to tighten monetary policy.
That means raising interest rates and quantitative tightening (QT).
As we discussed on September 20, the transmission mechanisms of these drivers vary with QT having a very weak transmission “to economic activity but very strong to financial markets.” On the other end are rates that have a stronger transmission to economic activity.
And so, on “the incremental effects on liquidity” these drivers pose, markets are trading more in sync; on the way up, through fiscal stimuli, interest rate decreases, and QE (i.e., buying of US Treasuries and mortgage securities), investors sought more yield elsewhere.
Risk assets like stocks, crypto, and beyond thus enjoyed a boost.
In a way, the opposite is happening now, and selling across risk -on and -off assets is persistent.
Liquidity measures (which we began unpacking months ago, and were covered in Bloomberg by Kevin Muir of TheMacroTourist.com, recently, too) show a near-lockstep decline in the S&P 500 (INDEX: SPX). Please check out Kevin Muir’s Substack, too!
Net liquidity (NL) we calculate by taking the size of the Fed’s balance sheet (BS) and subtracting both the amounts in the reverse repo operation (RRP) and Treasury General Account (TGA).
Muir said that “the liquidity created from QE and fiscal stimulus was so great that commercial banks no longer wanted deposits from large institutional clients because there were not enough safe assets available to purchase.”
This prompted the expansion of RRP (beyond primary dealers to include the mutual funds and non-traditional accounts), a liquidity-draining operation (cash in the system removed through an increase in the number of bonds), through which the Fed would deliver “high-quality collateral with the promise to buy it back in a certain number of days at a higher price,” Muir explained.
Other NL drivers include the TGA which, prior to Covid, was fairly well-balanced by taxes (i.e., money coming in) and the issue of fixed-income securities (i.e., money coming out).
Post-Covid, the TGA increased a lot and this has “the same effect as QT … [as] bonds are issued and cash [is] withdrawn from the financial system, but the money is not distributed into the economy,” Muir elaborated.
Combining the moves of the RRP and TGA, with the BS, provides us a measure of NL (shown below) that well explains stock price movements, as we’ve put forth in letters before.
Graphic: Via Physik Invest. Data compiled by @jkonopas623. Fed Balance Sheet data, here. Treasury General Account Data, here. Reverse Repo data, here. NL = BS – TGA – RRP.
And, despite the far-spreading risk-on and -off context (i.e., stocks, crypto, and bonds down), it is believed that the large amounts in liquidity-draining operations (RRP and TGA), the impacts of QT, from hereon, may be lessened; per Muir, “[i]f the Fed had securities on its balance sheet that matched the maturity profile demanded by the institutions engaging in reverse repos, it could sell an amount equal to the total reverse repo balance to these institutions, reducing the need for reverse repos and elicit no change in the financial or real economy.”
“On top of that, the actual amount of monthly QT [$95 billion per month] is not that large,” Muir added. That’s because, over the span of five months, into the end of 2021 and the beginning of 2022, the TGA was up $816 billion. This equates to ~$163.2 or so billion per month of QT.
At the end of the day, though, the programs outlined above do less to provide market support. One can argue that the market has priced the programs and some economic slowing. It is not likely the market has priced the impacts of a sharply slowing economy and business.
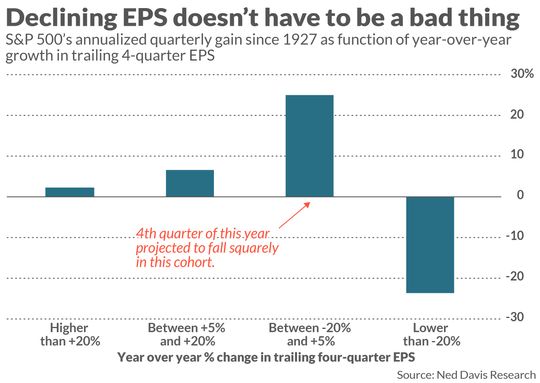
That said, some data – less corporate profits falling out of bed – suggests “the stock market tends to do better when EPS growth rates are negative than when they are hugely positive.”
Graphic: Retrieved from Ned Davis Research via MarketWatch. “[A]n inverse relationship between earnings growth rates and the market’s average return.”
The key to explaining this is to remember markets are a forward-looking mechanism.
“By the time earnings growth rates are extremely high–as they were late last year and early this–they have long since been reflected in stock prices.”
“During such periods, the market has instead shifted its focus to earnings several quarters hence—to factors such as the Fed having to put the brakes on an overheating economy.”
The reverse will happen when the year-over-year growth rate in trailing fourth-quarter EPS is negative; “investors will have shifted their focus to earnings’ likely imminent rebound.”
Positioning
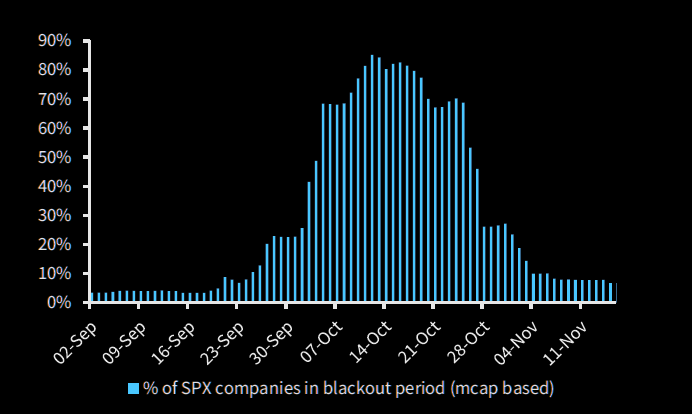
Pending is a final resolution “tied to the incremental effects on liquidity,” (e.g., QT manifesting itself as “$4.5 billion less in demand for assets per day,” and buyback blackout).
Graphic: Retrieved from Barclays PLC (NYSE: BCS) via The Market Ear.
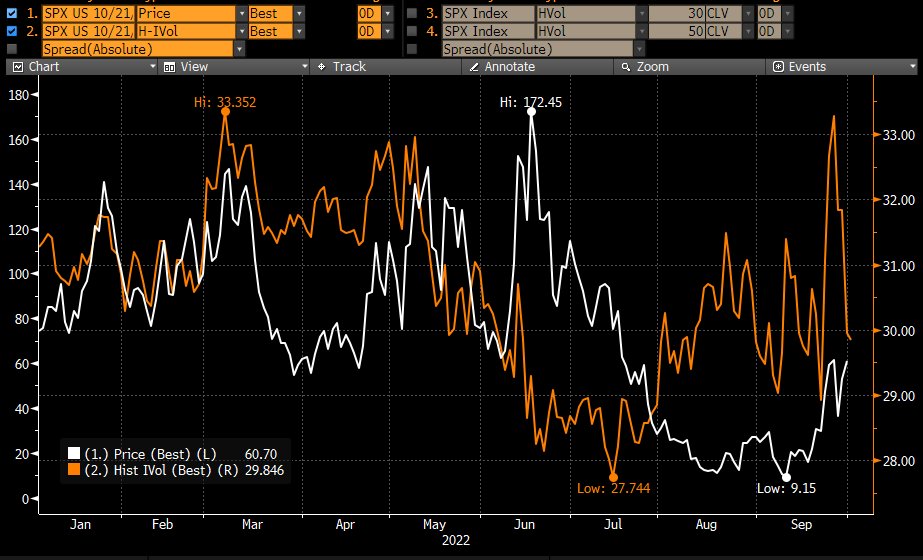
This is all the while options repositioning may actually make the case for increased fragility, as traders’ falling demand for put protection opens the door to less supportive hedging flows and more impact from macro-type flows (talked about above) if we will.
Graphic: Taken from @Alpha_Ex_LLC who retrieved from Bloomberg. S&P 500 (INDEX: SPX) October put option lower in price and volatility.
“As traders realize that options protection is doing little to protect them, there may be a flip; the sale of volatility, which appears to be a good trade (now), could leave markets vulnerable to an event into which traders are no longer well-hedged. Should something bad happen and traders reach for protection, that could result in limit-down type of movement.”
If unsure of what direction to participate, consider pricing some Box Spreads that offer some competitive and guaranteed interest rates, similar to those earned with Treasury bills.
Technical
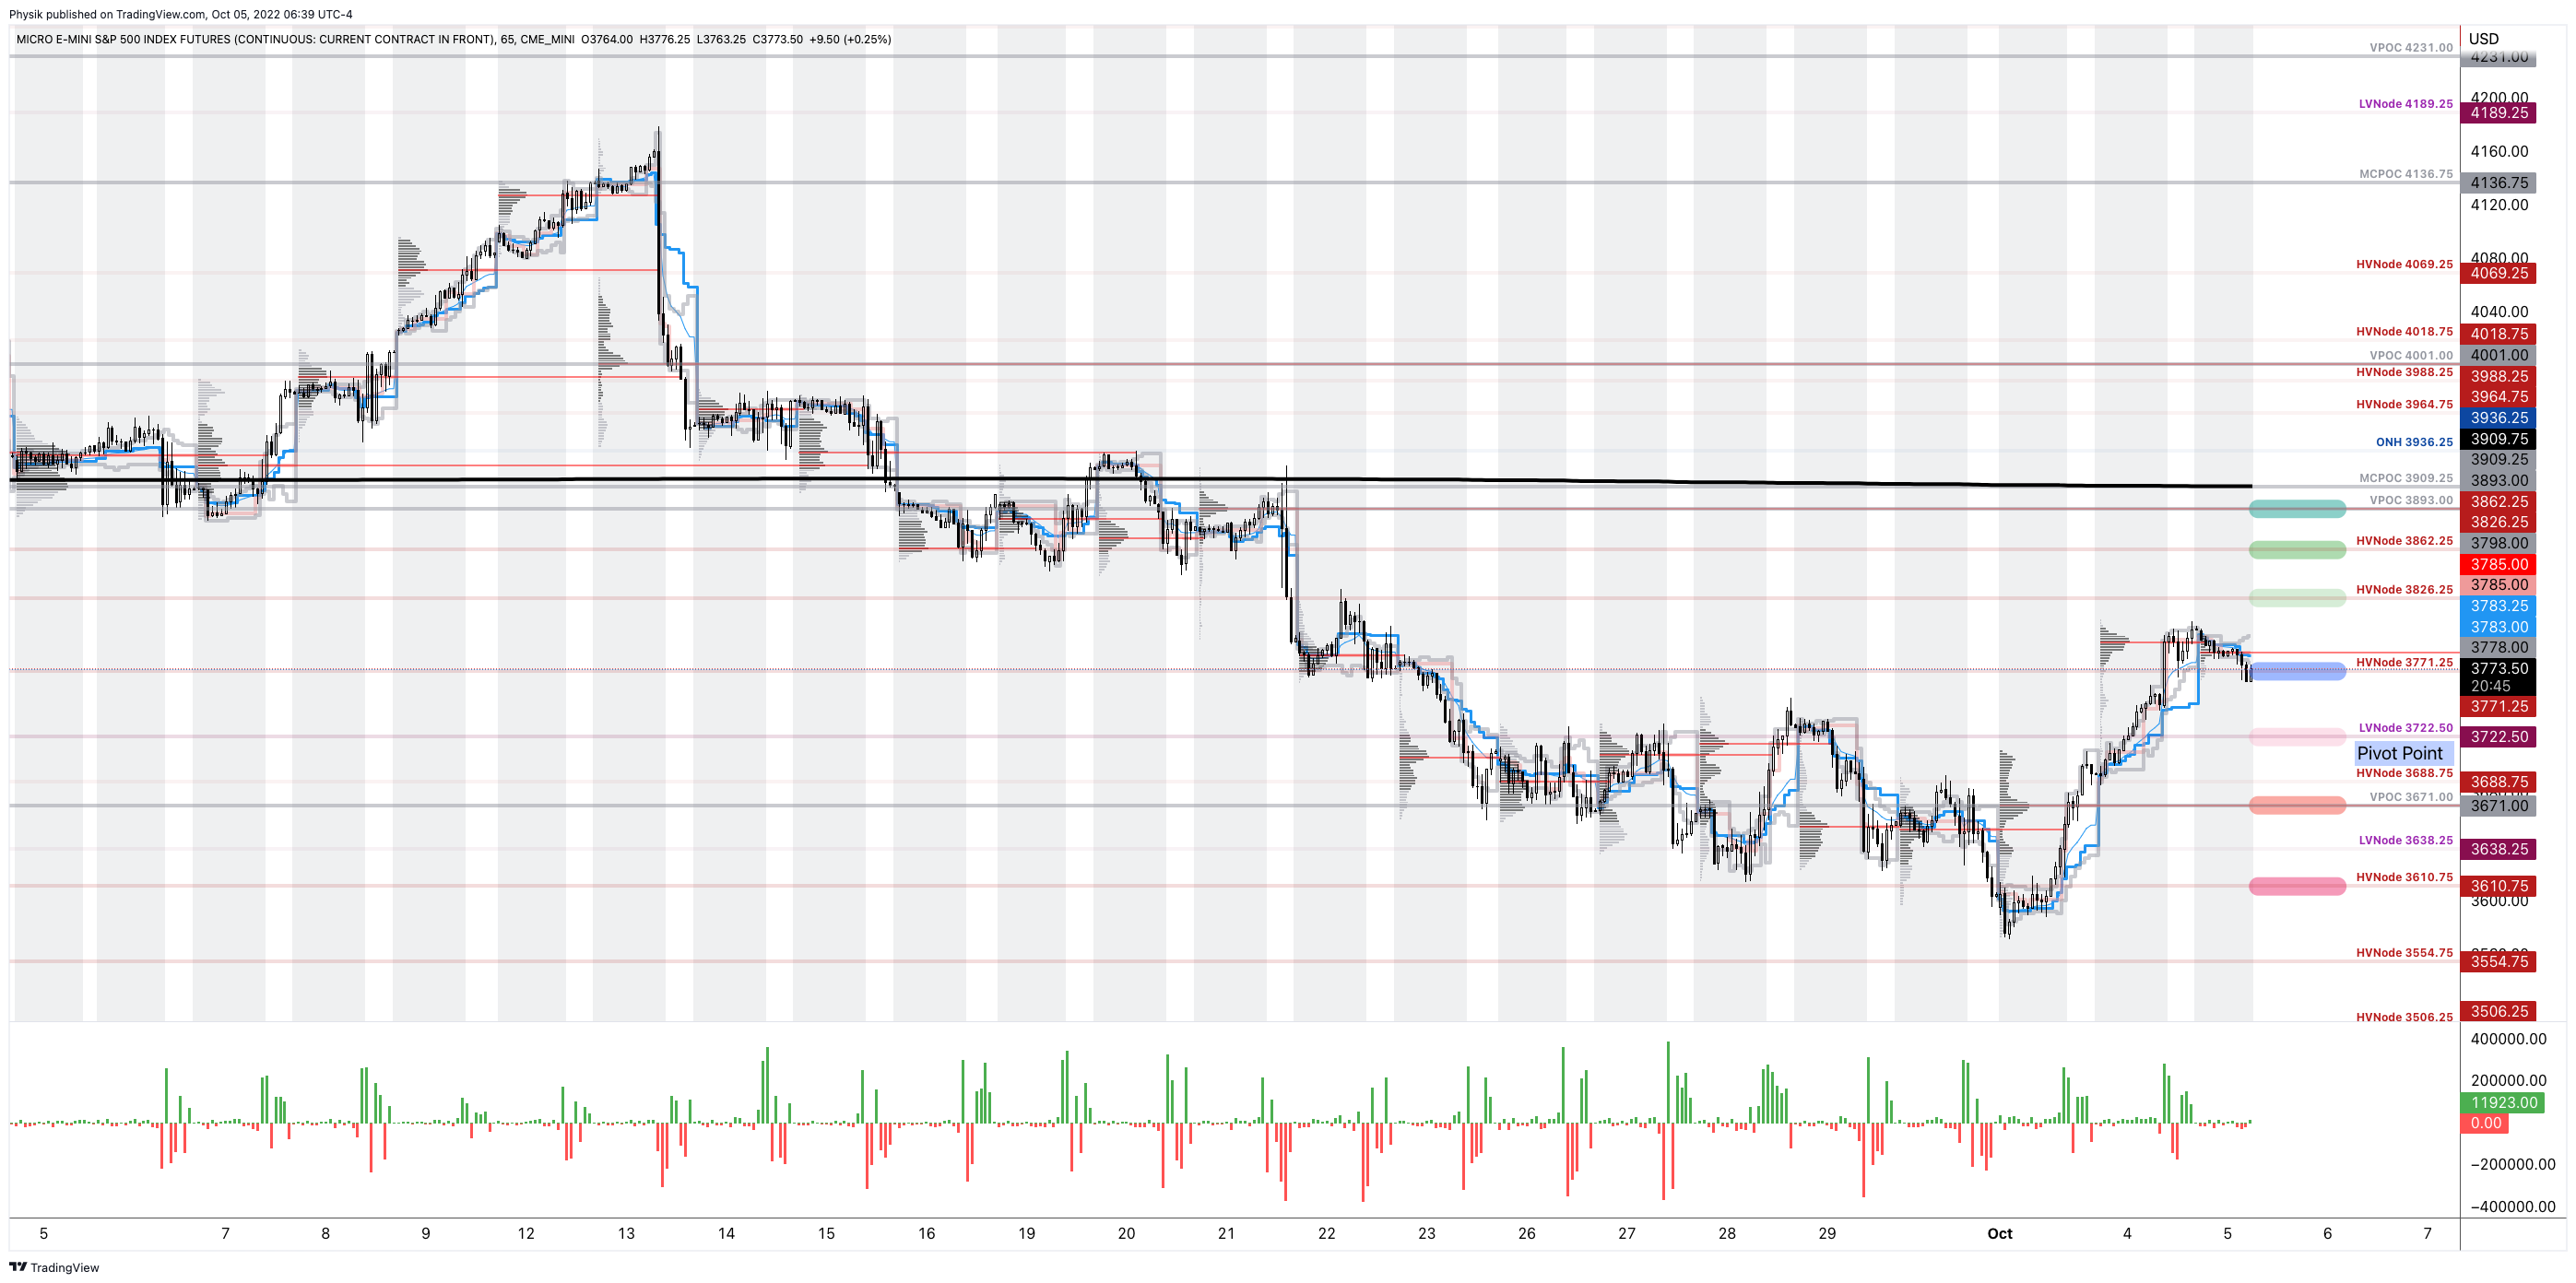
As of 6:40 AM ET, Wednesday’s regular session (9:30 AM – 4:00 PM ET), in the S&P 500, is likely to open in the lower part of a negatively skewed overnight inventory, inside of prior-range and -value, suggesting a limited potential for immediate directional opportunity.
In the best case, the S&P 500 trades higher.
Any activity above the $3,771.25 HVNode puts into play the $3,826.25 HVNode. Initiative trade beyond the last-mentioned could reach as high as the $3,862.25 HVNode and $3,893.00 VPOC, or higher.
In the worst case, the S&P 500 trades lower.
Any activity below the $3,771.25 HVNode puts into play the $3,722.50 LVNode. Initiative trade beyond the LVNode could reach as low as the $3,671.00 VPOC and $3,610.75 HVNode, or lower.
Click here to load today’s key levels into the web-based TradingView charting platform. Note that all levels are derived using the 65-minute timeframe. New links are produced, daily.
Graphic: 65-minute profile chart of the Micro E-mini S&P 500 Futures.
Definitions
Volume Areas: A structurally sound market will build on areas of high volume (HVNodes). Should the market trend for long periods of time, it will lack sound structure, identified as low volume areas (LVNodes). LVNodes denote directional conviction and ought to offer support on any test.
If participants were to auction and find acceptance into areas of prior low volume (LVNodes), then future discovery ought to be volatile and quick as participants look to HVNodes for favorable entry or exit.
POCs: POCs are valuable as they denote areas where two-sided trade was most prevalent in a prior day session. Participants will respond to future tests of value as they offer favorable entry and exit.
About
After years of self-education, strategy development, mentorship, and trial-and-error, Renato Leonard Capelj began trading full-time and founded Physik Invest to detail his methods, research, and performance in the markets.
Capelj also develops insights around impactful options market dynamics at SpotGamma and is a Benzinga reporter.
In no way should the materials herein be construed as advice. Derivatives carry a substantial risk of loss. All content is for informational purposes only.
The daily brief is a free glimpse into the prevailing fundamental and technical drivers of U.S. equity market products. Join the 990+ that read this report daily, below!
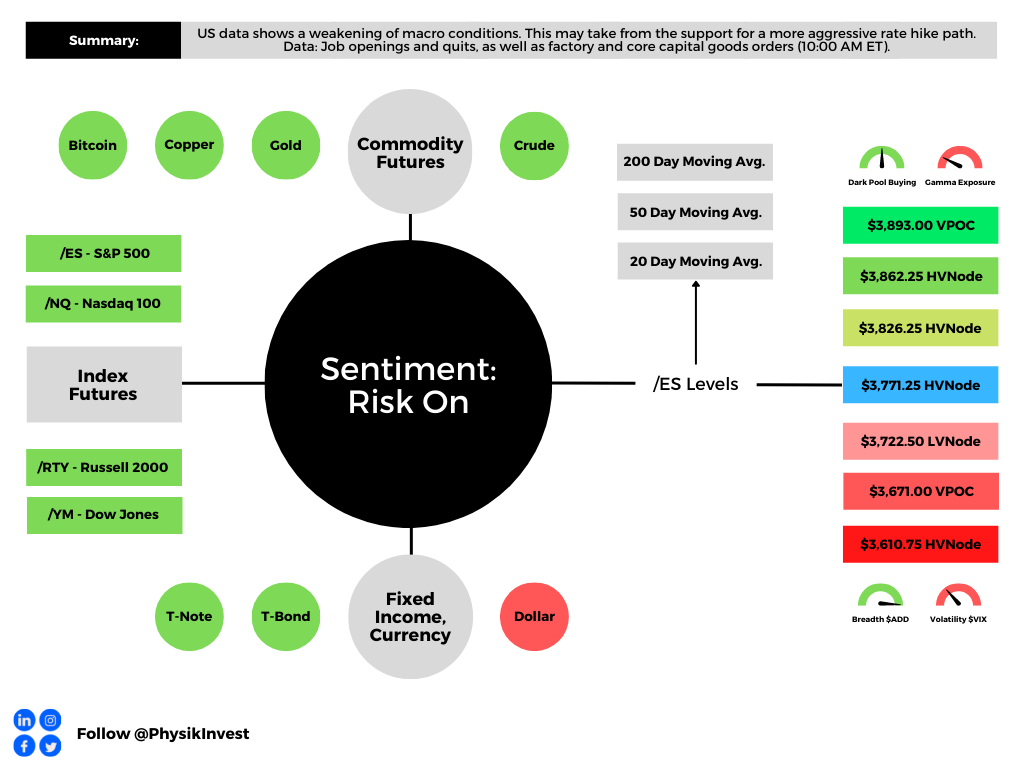
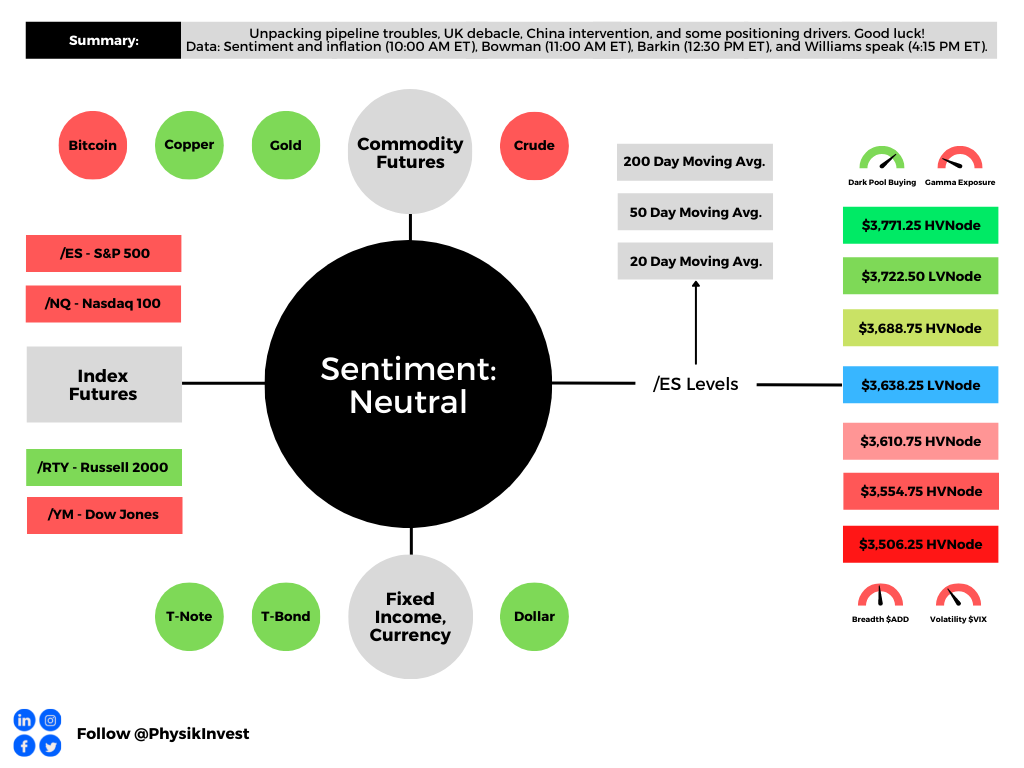
Graphic updated 9:20 AM ET. Sentiment Risk-On if expected /ES open is above the prior day’s range. /ES levels are derived from the profile graphic at the bottom of the following section. Levels may have changed since initially quoted; click here for the latest levels. SqueezeMetrics Dark Pool Index (DIX) and Gamma (GEX) calculations are based on where the prior day’s reading falls with respect to the MAX and MIN of all occurrences available. A higher DIX is bullish. At the same time, the lower the GEX, the more (expected) volatility. Learn the implications of volatility, direction, and moneyness. Breadth reflects a reading of the prior day’s NYSE Advance/Decline indicator. VIX reflects a current reading of the CBOE Volatility Index (INDEX: VIX) from 0-100.
Fundamental
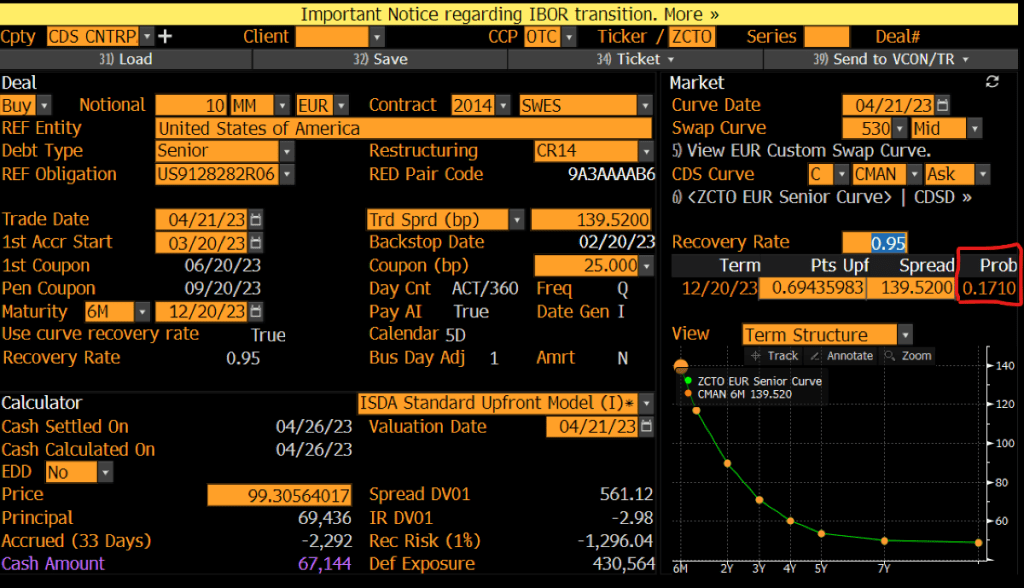
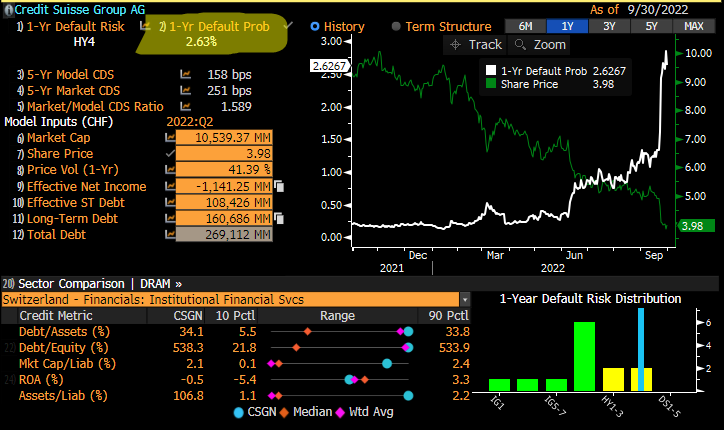
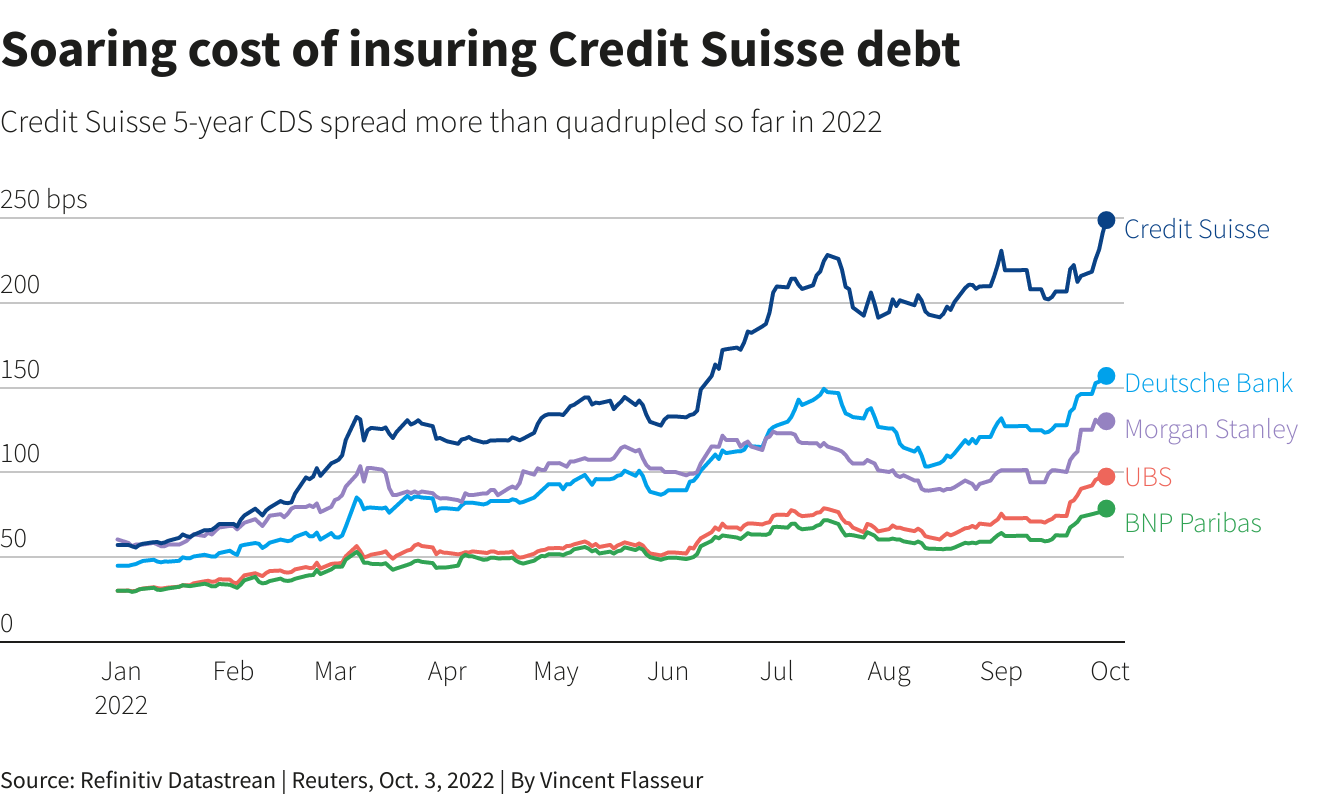
Fresh and top of mind, still, is the Credit Suisse Group AG (NYSE: CS) debacle. However, despite the bank’s “critical moment,” as discussed in yesterday’s letter, credit default swap (CDS) levels, though still rising, are “far from distressed.”
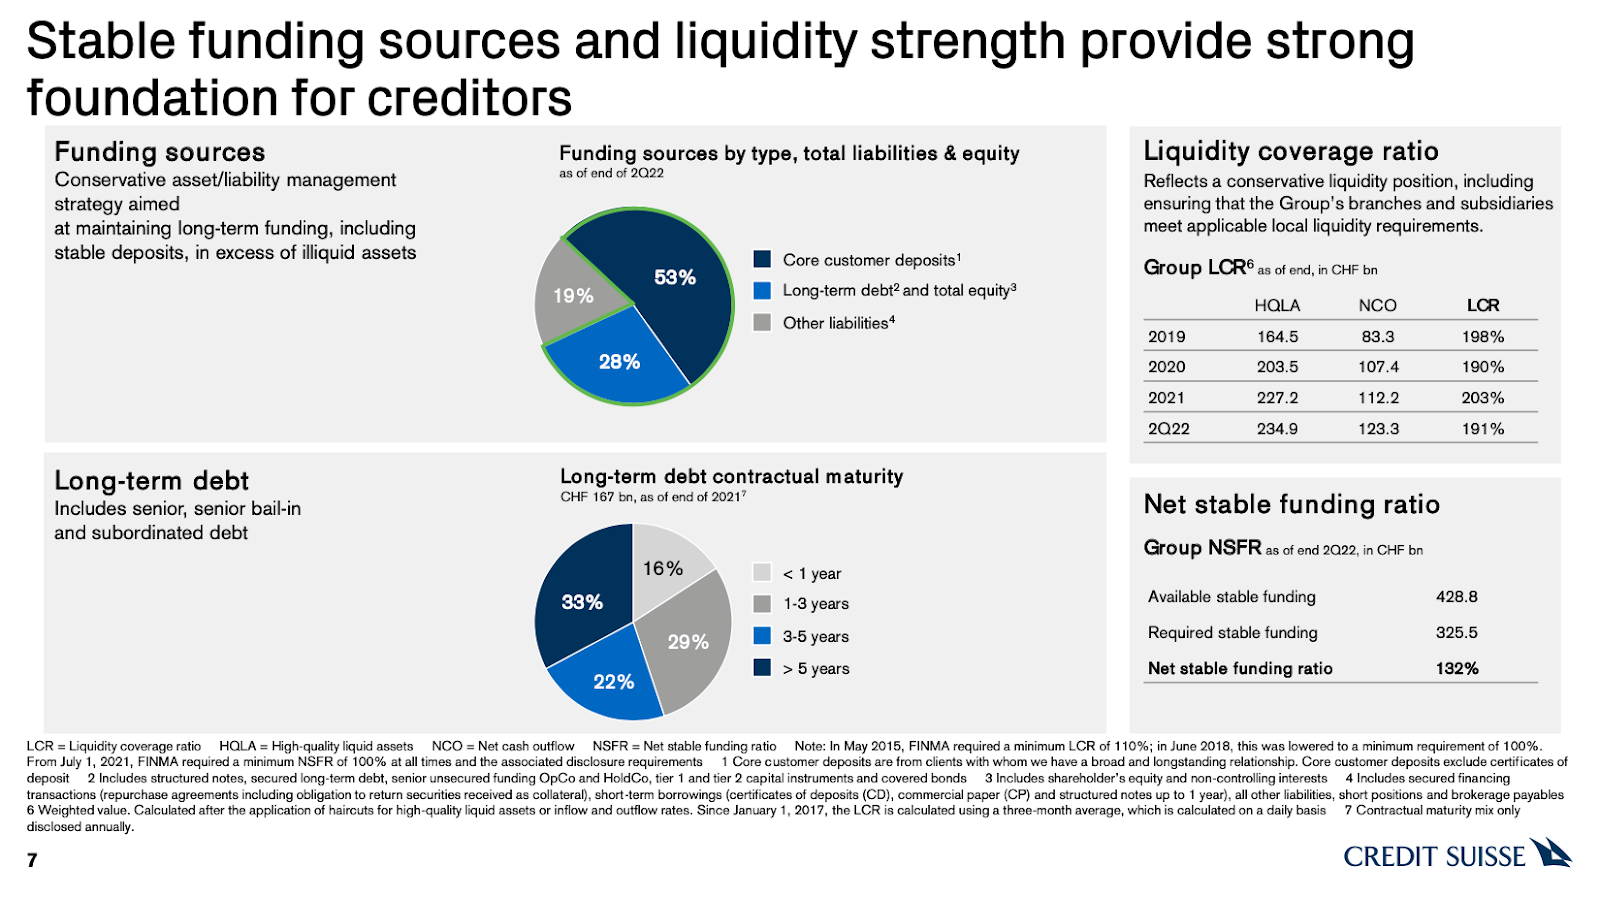
Adding, not reflected by the stock is a “strong capital base and liquidity position,” per CS.
Graphic: Retrieved from Credit Suisse Group AG (NYSE: CS).
A big topic speculated on was CS’ probability of default. At its core, CDS spreads relate to the probability of default in the following way, per Deutsche Bank AG (NYSE: DB) research:
(CDS Spread) / (1 – Recovery Rate) = Implied Probability Of Default.
The recovery rate is basically the (estimated) amount of a loan that will be repaid in the case of a bankruptcy or default. Per European Central Bank research, “the standard recovery rate used by the industry in price calculations is 40%.”
Roughly speaking, below is a quick calculation:
250 basis points / (1 – 0.40) = 416.67 basis points = 4.17% Implied Probability Of Default
In CS’ case, if the spread is 250 basis points, assuming a 40% recovery, that’s a 4.17% default probability implied. If the spread was at 150 basis points, then, assuming a 40% recovery, that’s a 2.5% chance of default.
Graphic: Taken from @EffMktHype who retrieved from Bloomberg. “So many [Bloomberg] screenshots of CS CDS levels and talking about massive default prob numbers. Zero people actually using [the] same terminal to look at default risk screen.”
Taken together, in short, similar to as we put forth, yesterday, “[t]his is not 2008,” per Citigroup Inc’s (NYSE: C) Andrew Coombs. Bloomberg adds that Morgan Stanley (NYSE: MS) faced its own credit spread debacle during 2011 European debt exposure rumors; “it took months for the price of the default swaps to fall as the feared losses never materialized.”
Ahead of an October 27 CS review covering topics including “a large-scale investment banking retreat, … [i]nvestors are worried about how much the bank will [have to] cover” a restructuring.
Bloomberg adds: “A sale of Credit Suisse’s structured-products group, which trades securitized debt, has attracted interest from potential buyers, … [amid] rising interest rates.”
Per UBS Group AG (NYSE: UBS) research, a sale of such businesses, which may be worth more than the market is currently implying, “could help to avoid a dilutive capital increase.”
Positioning
“Month-end portfolio rebalances and [the] expiration of quarterly option strategies [acted] in support of the market,” JPMorgan Chase & Co’s (NYSE: JPM) Marko Kolanovic stated in a September 30, 2022 commentary titled “Throwing rocks in glass houses.”
In that same commentary, Kolanovic eased support for his 2022 price targets on economic volatility led by central banks, the war in Europe, and beyond.
As stated last week, per Kai Volatility’s Cem Karsan, it’s the case that the removal of options strategies and potential supply of protection (as investors further come to the realization that options protection has done little to protect against downside) may provide markets a boost.
Graphic: Taken from @Alpha_Ex_LLC who retrieved from Bloomberg. S&P 500 (INDEX: SPX) October put option lower in price and volatility.
Ultimately, though, a final resolution would be “tied to the incremental effects on liquidity,” (e.g., QT manifesting itself as “$4.5 billion less in demand for assets per day,” and buyback blackout) while options repositioning may make the case for increased fragility, as traders’ falling demand for put protection opens the door to less supportive hedging flows with respect to time (Charm) and volatility (Vanna) changes.
Therefore, trades such as the Short Ratio Put Spread, particularly if narrower, may be far riskier to employ into the end of this year and the middle half of next year. For context, this was a trade to have on this year.
As participants continue to make the aforementioned realizations and supply to the market put (downside protection), tails may “continue to be cheap,” and discount “crash risk,” according to The Ambrus Group’s Kris Sidial.
A lot more to resolve this jumbled mess of a newsletter in the coming days.
Technical
As of 9:10 AM ET, Tuesday’s regular session (9:30 AM – 4:00 PM ET), in the S&P 500, is likely to open in the upper part of a positively skewed overnight inventory, outside of prior-range and -value, suggesting a potential for immediate directional opportunity.
In the best case, the S&P 500 trades higher.
Any activity above the $3,771.25 HVNode puts into play the $3,826.25 HVNode. Initiative trade beyond the last-mentioned could reach as high as the $3,862.25 HVNode and $3,893.00 VPOC, or higher.
In the worst case, the S&P 500 trades lower.
Any activity below the $3,771.25 HVNode puts into play the $3,722.50 LVNode. Initiative trade beyond the LVNode could reach as low as the $3,671.00 VPOC and $3,610.75 HVNode, or lower.
Click here to load today’s key levels into the web-based TradingView charting platform. Note that all levels are derived using the 65-minute timeframe. New links are produced, daily.
Graphic: 65-minute profile chart of the Micro E-mini S&P 500 Futures.
Definitions
Volume Areas: A structurally sound market will build on areas of high volume (HVNodes). Should the market trend for long periods of time, it will lack sound structure, identified as low volume areas (LVNodes). LVNodes denote directional conviction and ought to offer support on any test.
If participants were to auction and find acceptance into areas of prior low volume (LVNodes), then future discovery ought to be volatile and quick as participants look to HVNodes for favorable entry or exit.
POCs: POCs are valuable as they denote areas where two-sided trade was most prevalent in a prior day session. Participants will respond to future tests of value as they offer favorable entry and exit.
Vanna: The rate at which the delta of an option changes with respect to volatility.
Charm: The rate at which the delta of an option changes with respect to time.
About
After years of self-education, strategy development, mentorship, and trial-and-error, Renato Leonard Capelj began trading full-time and founded Physik Invest to detail his methods, research, and performance in the markets.
Capelj also develops insights around impactful options market dynamics at SpotGamma and is a Benzinga reporter.
In no way should the materials herein be construed as advice. Derivatives carry a substantial risk of loss. All content is for informational purposes only.
The daily brief is a free glimpse into the prevailing fundamental and technical drivers of U.S. equity market products. Join the 980+ that read this report daily, below!
Graphic updated 9:50 AM ET. Sentiment Neutral if expected /ES open is inside of the prior day’s range. /ES levels are derived from the profile graphic at the bottom of the following section. Levels may have changed since initially quoted; click here for the latest levels. SqueezeMetrics Dark Pool Index (DIX) and Gamma (GEX) calculations are based on where the prior day’s reading falls with respect to the MAX and MIN of all occurrences available. A higher DIX is bullish. At the same time, the lower the GEX, the more (expected) volatility. Learn the implications of volatility, direction, and moneyness. Breadth reflects a reading of the prior day’s NYSE Advance/Decline indicator. VIX reflects a current reading of the CBOE Volatility Index (INDEX: VIX) from 0-100.
Administrative
Apologies for the delay. Hectic end-of-week! A little heavy on the fundamental side of things and light on the positioning. More to unpack next week. Have a great weekend!
Fundamental
As an update to our September 29, 2022 letter, Russia responded to the Nord Stream attack suggesting the incident spoke of state-sponsored “terrorism”, all the while “an EU official said the incident had fundamentally changed the nature of the conflict in Ukraine,” per Refinitiv.
Graphic: Retrieved from Bloomberg. Updated September 28, 2022.
In short, Russia’s throwing blame on the US, among others, suggesting it was likely to benefit through a boost in liquefied natural gas (LNG) sales. Russia previously said the leaks were in areas “fully under the control” of US intelligence agencies.
It’s the case that in February 2022, Joe Biden commented that if Russia invaded Ukraine, there would “no longer be a Nord Stream 2,” also.
In response, Nord Stream 1 leaks will be stopped on Monday with no forecasts yet on the future of the pipeline’s operation.
To note, the pipelines were not “supplying gas to Europe when the leaks were first detected, … [but] both had gas in them.” Regardless, the EU will be assessing the application of sanctions.
Moving on, as a recap, this week there was tons of volatility in overseas fixed income and FX markets. In short, the announcement of new fiscal policies coincided with market volatility that prompted reflexive feedback responses, which we dissected in our September 29, 2022 letter.
A cascade of margin calls, during the route to 7-8% yields, would have put in jeopardy 90% of UK pension funds.
To explain, per Reuters, there are schemes “that pay pensioners a fixed annual amount, often a portion of the final salary they earned as employees.” The schemes invest about 50% of assets in bonds, in order to have cash on hand and pay pension liabilities.
To reduce the effects of market volatility, positions are hedged through derivatives “managed by so-called liability-driven investment (LDI) funds,” Reuters well explained. “For example, pension schemes might pay the floating rate leg of an interest rate swap and receive fixed rates.”
Due to the leverage, market moves have an amplified effect on the funds. Therefore, if bonds fall too much, too fast, more cash must be sent to these LDIs.
“[P]ositions become loss-making – they are paying out more money in the transaction than they are receiving.”
In some cases, schemes were to have “cash reserves to cope with a 200 bps rise in swap rates over a year. However, 30-year gilt interest rate swaps … rose 360 bps this year and 120 bps in the last few days before the BoE stepped in” and bought bonds, boosting inflation expectations, the thing that monetary tightening was, in part, intended to reduce.
Accordingly, pensions sold gilts to “ready cash to meet those collateral calls, or they were kicked out of their derivatives positions because they could not pay up in time and had to sell gilts to avoid having a naked exposure to further sharp moves.”
The BoE’s actions calm the market allowing for the more orderly processing of transactions.
Still, the UK is seen “out-hiking the Fed in the wake of Kwarteng tax cuts,” while “schemes are running out of cash.”
The risks don’t just stop there, though, we added.
For one, there’s damage to be had if FX hedges go awry, which we said would likely prompt a call for collateral, too; investors will “buy overseas assets and hedge away the currency risk,” Jim Leaviss explained. “[I]f you had bought a dollar bond and hedged it, the dollars that you have effectively sold ‘short’ against sterling as the hedge have rallied, and the counterparty to the FX hedge will call for a collateral payment.”
The actions of the recent days likely put investors in a position of less liquid assets to meet the (potential) collateral calls, and this is part of the aforementioned technical factors that are likely to have a bearing on the direction of bonds and yields “over coming months.”
Additionally, some participants speculate the US may run into similar issues as the UK. A single (unconfirmed) participant explained pensions may be “selling equities and other asset classes to meet their swap obligations.”
Separately, another topic of discussion was the People’s Bank of China (PBOC) telling state-run banks to prepare for the shedding of dollar holdings to buy and assist in propping up the yuan.
Graphic: Retrieved from Reuters’ John Kemp.
This is all the while the Federal Reserve (Fed), to address problems of its own (e.g., real estate affordability) is implementing aggressive monetary tightening (prompting a rise in the dollar and triggering a “reverse currency war”).
Graphic: Retrieved from Bloomberg. “So if you want to spend $2,500 a month, you can now buy a house that costs $476,425. For that same monthly payment, you could have purchased a $758,572 house in early 2021.”
As an aside, US mortgage rates hit a 15-year high and home prices are falling.
Graphic: Retrieved via Bloomberg. To note, housing wealth regressions indicate “that every dollar of changes in housing wealth leads to a 38-cent change in consumption.”
China is looking to do less of the same and “spark growth in an economy that’s been dragged down by COVID-19 lockdowns, a real estate crash, and supply chain snags,” which have hurt some US firms including Apple Inc (NASDAQ: AAPL).
Graphic: Retrieved from Bloomberg. Apple’s manufacturing exposure to China.
That’s the mismatch (i.e., China easy, US uneasy) that’s going on and, per some, the Fed may be acting on a set of lagging indicators; monetary policy action may do more harm than good.
Graphic: Retrieved from Bloomberg. Via Liz Ann Sonders. “Unbelievable decline in shipping rates … cost to send a 40-ft container from Shanghai to Los Angeles has fallen by 74% from peak and is back to August 2020 levels.”
But, for now, a robust labor market and continued spending by American consumers have some feeling there’s far more room to go before US monetary policy does more harm than good.
Graphic: Retrieved from Bloomberg. An end of an era is approaching, however, as companies that grew largely over the past years, including Meta Platforms Inc (NASDAQ: META), seek to reduce headcount and reorganize.
Positioning
All that was said yesterday, and earlier this week, remains valid. In short, the decline prompted traders to demand downside protection, and this wound measures of implied volatility (IVOL).
Graphic: Retrieved from Interactive Brokers Group Inc (NASDAQ: IBKR). Read, here, to understand backwardation and contango in futures markets.
For IVOL measures to remain wound, something bad needs to happen, in short. Otherwise, as seen yesterday, slightly, the S&P 500 drifted lower while certain IVOL measures, such as the Cboe Volatility Index (INDEX: VIX) printed a lower high than that observed on Wednesday.
Per SpotGamma, “If the decline in IVOL is very pronounced, relative to the decline in the S&P, that too can aid in a push-and-pull that actually serves to … resist far-reaching weakness.”
Graphic: Retrieved from SpotGamma. SPX prices X-axis. Option delta Y-axis. When the factors of implied volatility (Vanna) and time change (Charm), hedging ratios change. The graphic is for illustrational purposes, only.
From hereon, the decay and/or removal of the protection that’s been demanded in the past days and weeks may place a like on IVOL and boost markets over a very short term. In the long term, however, weakness is here to stay, says Kai Volatility’s Cem Karsan.
That’s amid impacts of quantitative tightening (QT) which is manifesting itself as “$4.5 billion less in demand for assets per day,” as well as the blackout period for buybacks (which were consistently “supporting the market”) and options repositioning bolstering the weakness.
Graphic: Via Physik Invest. Data compiled by @jkonopas623. Fed Balance Sheet data, here. Treasury General Account Data, here. Reverse Repo data, here. NL = BS – TGA – RRP.
A lot more on this positioning, and the rollover of some large fund exposures, which have grasped the attention of many online, in some coming letters.
Technical
As of 9:50 AM ET, Friday’s regular session (9:30 AM – 4:00 PM ET), in the S&P 500, is likely to open in the middle part of a balanced overnight inventory, inside of prior-range and -value, suggesting a limited potential for immediate directional opportunity.
In the best case, the S&P 500 trades higher.
Any activity above the $3,638.25 LVNode puts into play the $3,688.75 HVNode. Initiative trade beyond the HVNode could reach as high as the $3,722.50 LVNode and $3,771.25 HVNode, or higher.
In the worst case, the S&P 500 trades lower.
Any activity below the $3,638.25 LVNode puts into play the $3,610.75 HVNode. Initiative trade beyond the latter could reach as low as the $3,554.75 and $3,506.25 HVNode, or lower.
Click here to load today’s key levels into the web-based TradingView charting platform. Note that all levels are derived using the 65-minute timeframe. New links are produced, daily.
Graphic: 65-minute profile chart of the Micro E-mini S&P 500 Futures.
Definitions
Volume Areas: A structurally sound market will build on areas of high volume (HVNodes). Should the market trend for long periods of time, it will lack sound structure, identified as low volume areas (LVNodes). LVNodes denote directional conviction and ought to offer support on any test.
If participants were to auction and find acceptance into areas of prior low volume (LVNodes), then future discovery ought to be volatile and quick as participants look to HVNodes for favorable entry or exit.
About
After years of self-education, strategy development, mentorship, and trial-and-error, Renato Leonard Capelj began trading full-time and founded Physik Invest to detail his methods, research, and performance in the markets.
Capelj also develops insights around impactful options market dynamics at SpotGamma and is a Benzinga reporter.
In no way should the materials herein be construed as advice. Derivatives carry a substantial risk of loss. All content is for informational purposes only.