The Daily Brief is a free glimpse into the prevailing fundamental and technical drivers of U.S. equity market products. Join the 200+ that read this report daily, below!
What Happened
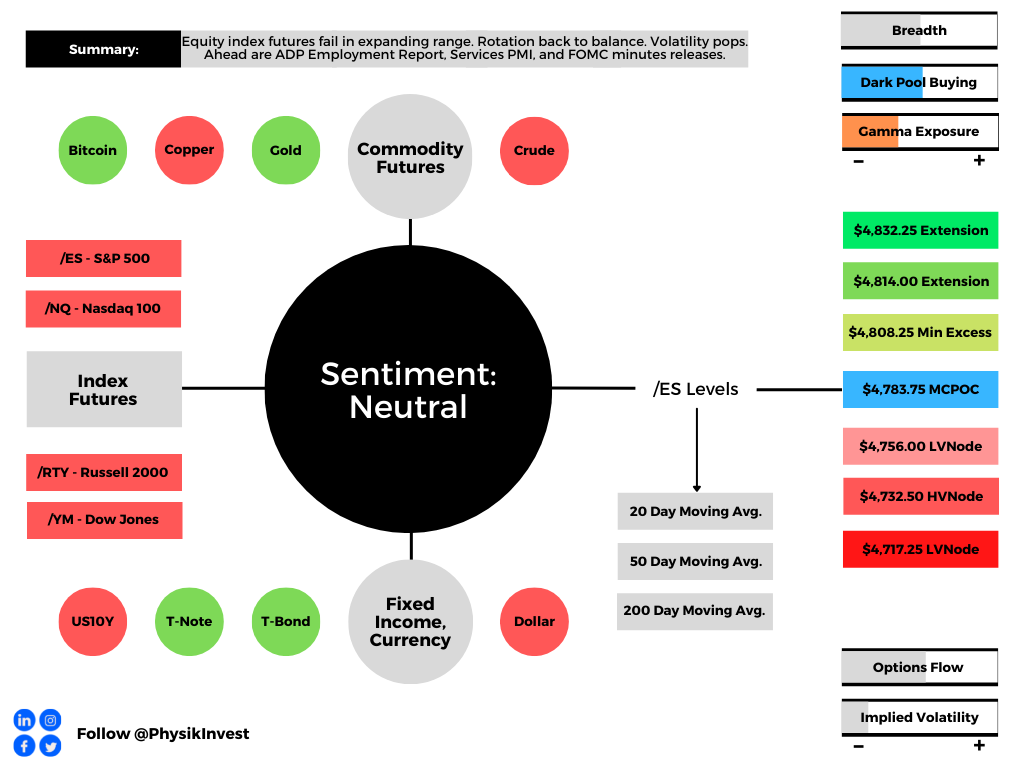
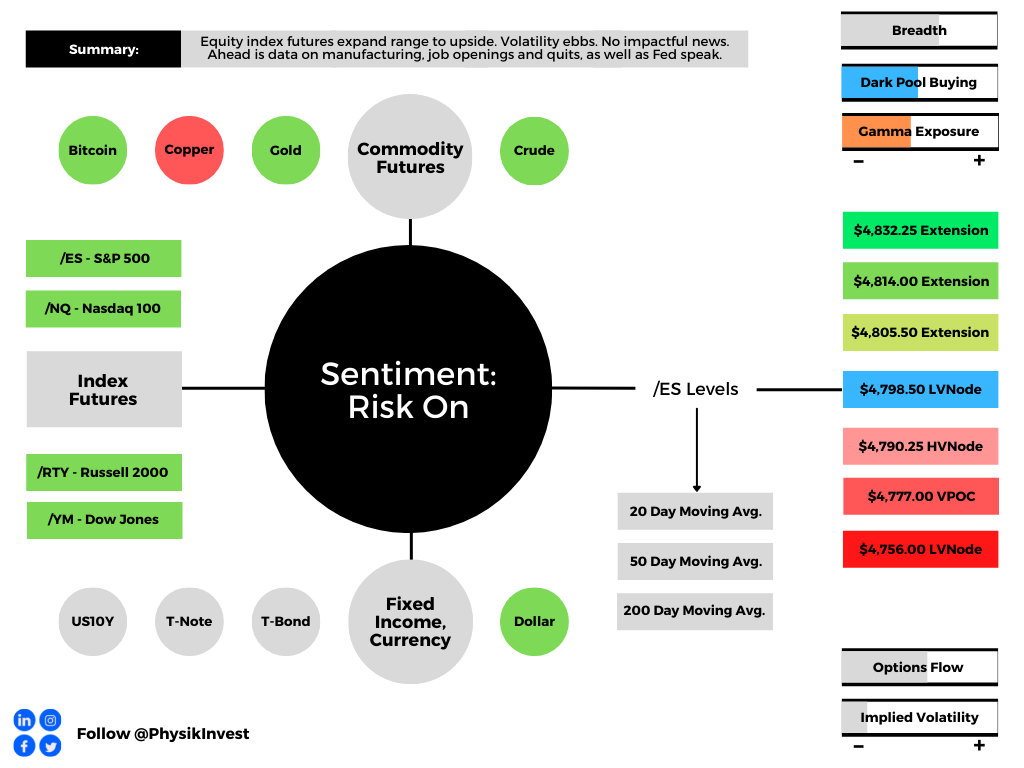
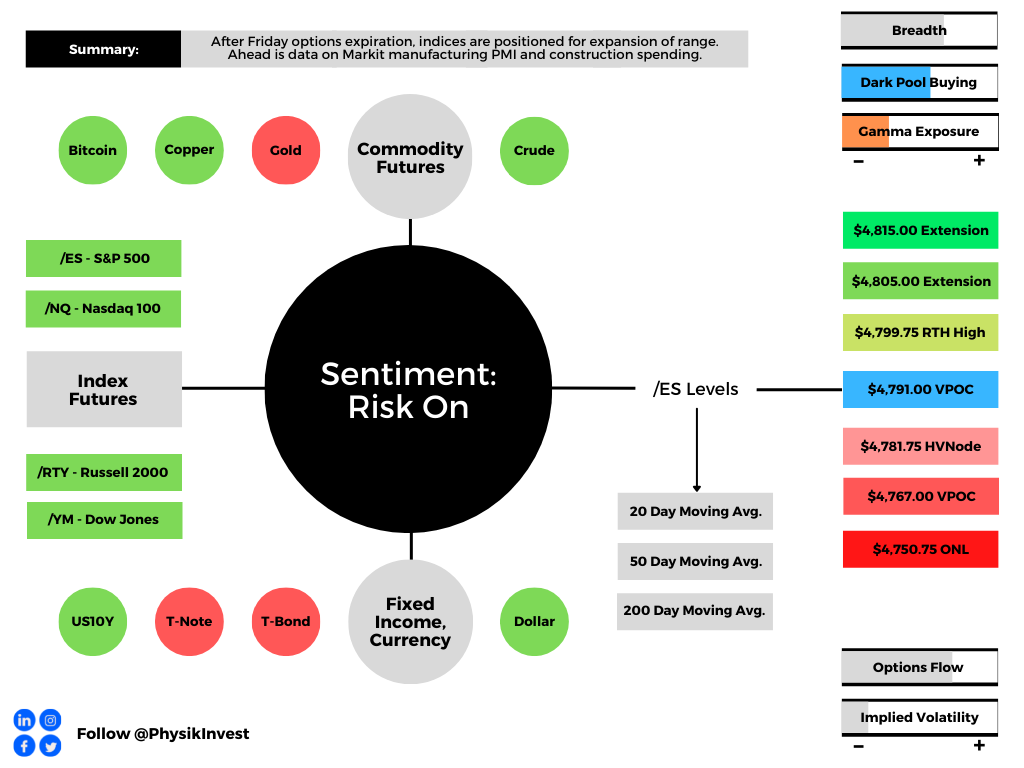
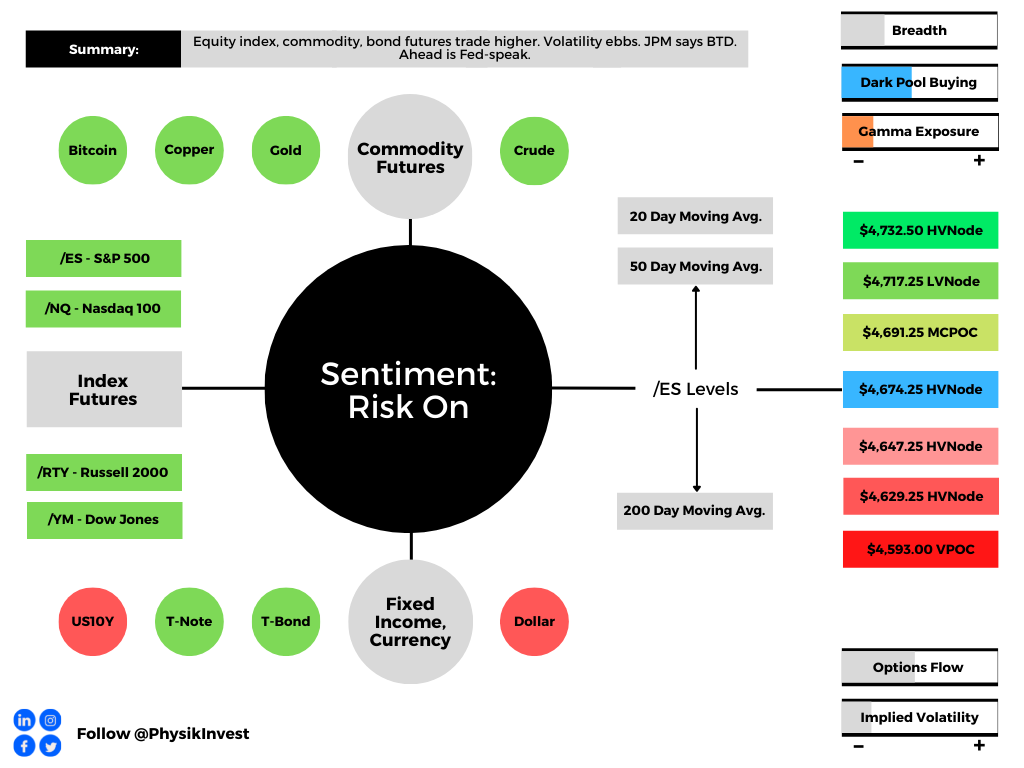
Overnight, equity index, commodity, and bond futures were sideways to higher. This is ahead of important Fed-speak; Federal Reserve Chair Jerome Powell speaks at 10:00 AM ET.
What To Expect
Fundamental: JPMorgan Chase & Co (NYSE: JPM) strategists led by Marko Kolanovic noted, yesterday, that the selloff is overdone, arguing higher rates would not derail the bull market.
“The pullback in risk assets in reaction to the Fed minutes is arguably overdone,” Kolanovic said. “Policy tightening is likely to be gradual and at a pace, that risk assets should be able to handle, and is occurring in an environment of strong cyclical recovery.”
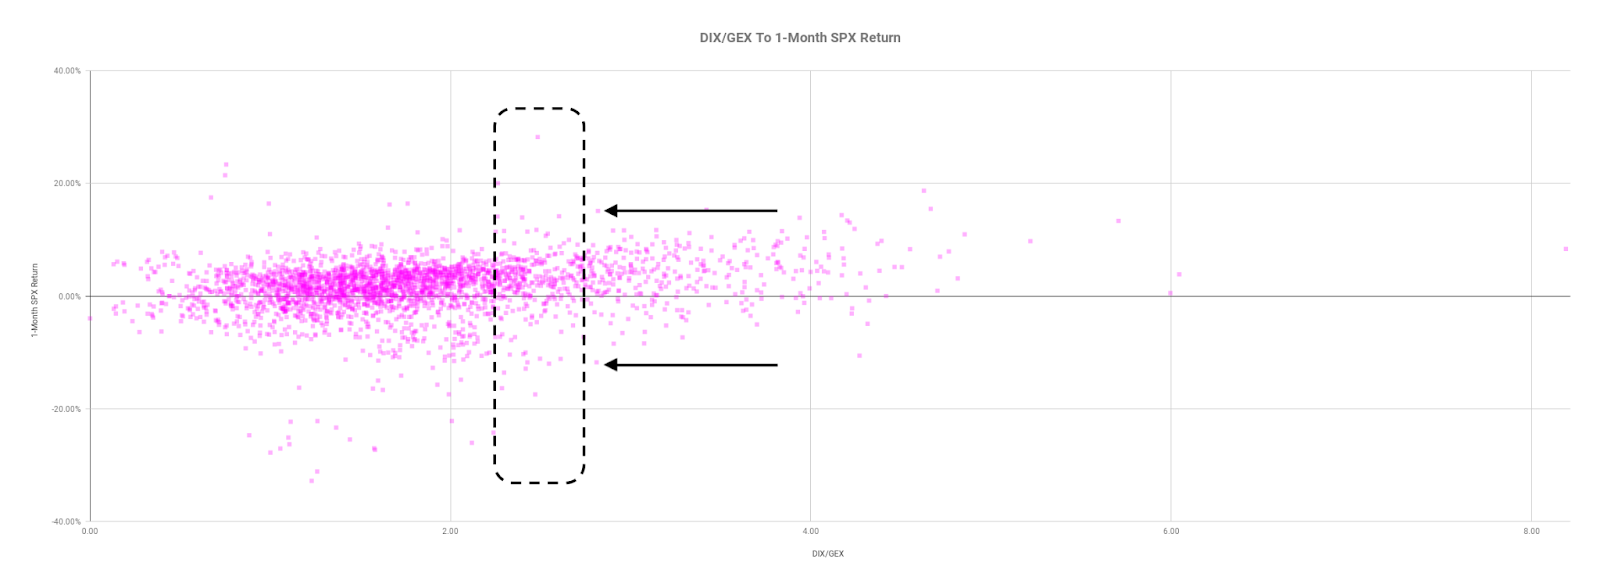
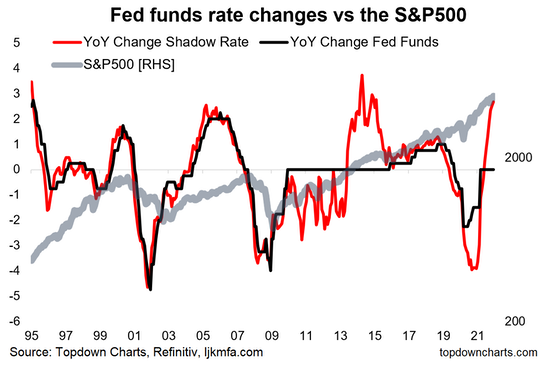
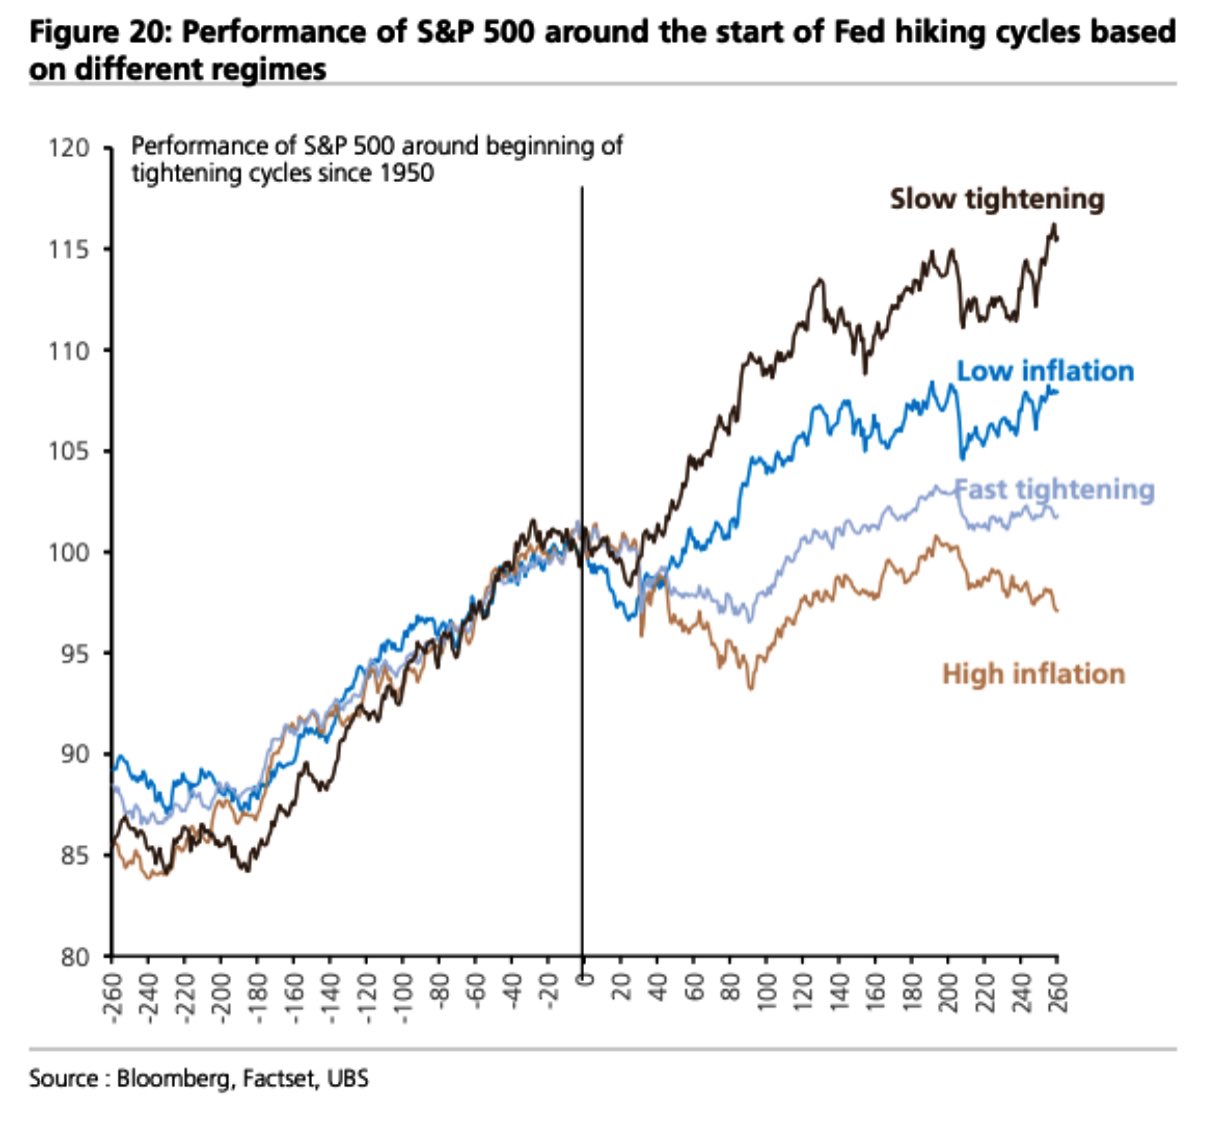
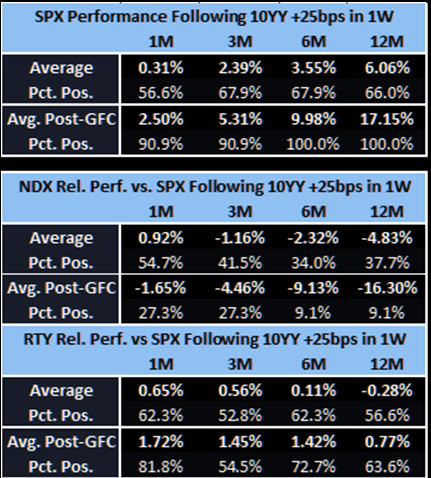
An analysis of equity market performance in the face of past rate spikes, suggests Kolanovic’s comments aren’t out of line.
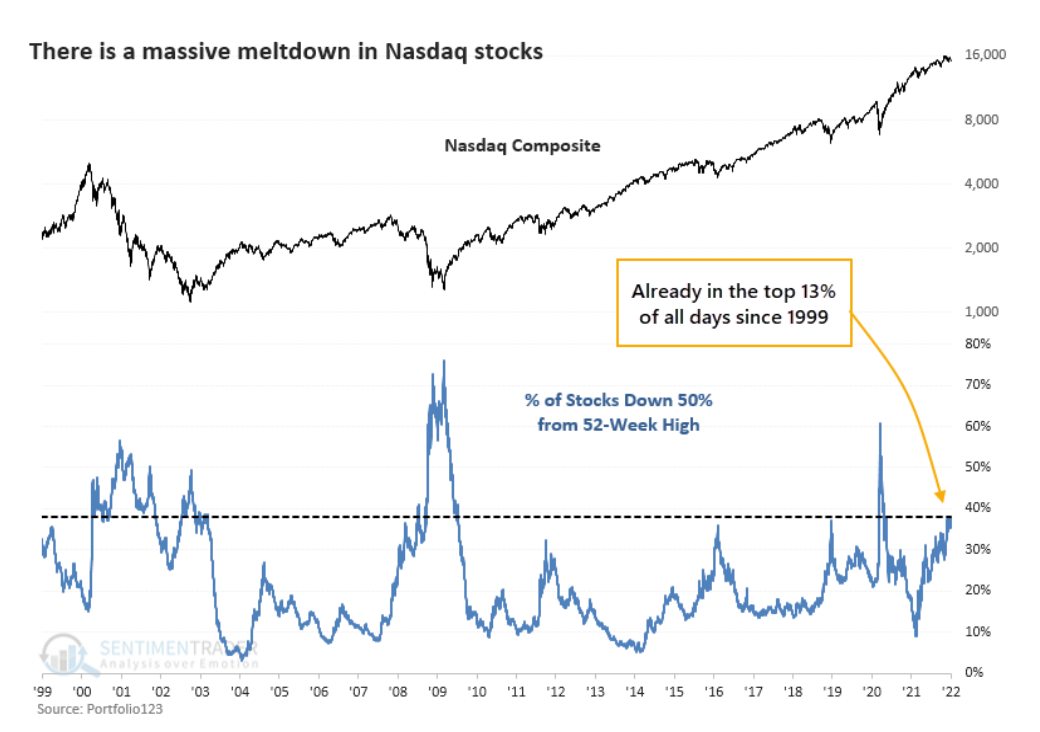
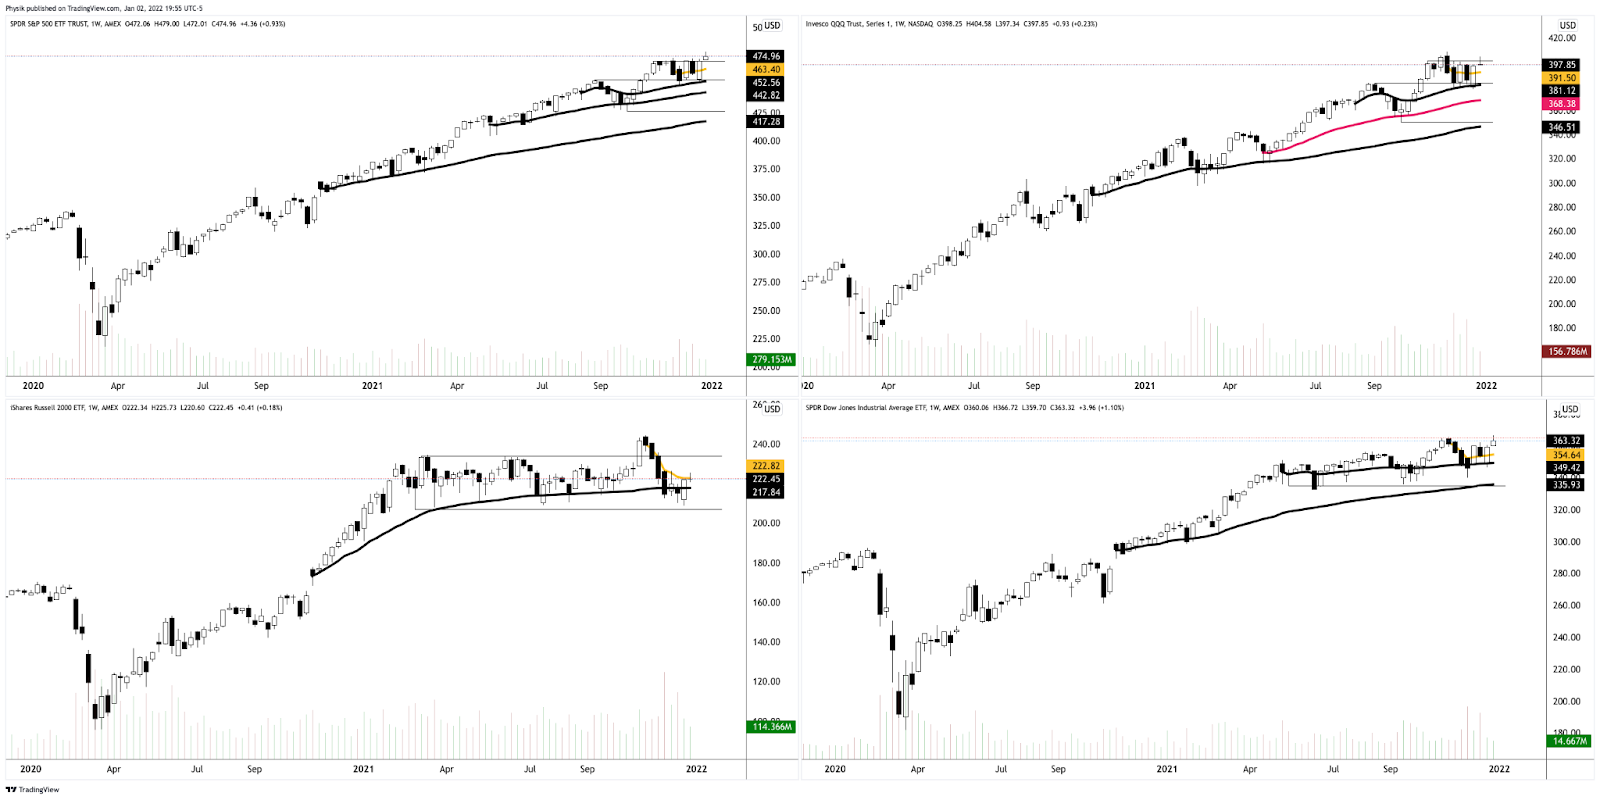
“We found that while SPX tends to see returns slow in the short term, the NDX and RTY actually tend to outperform on a 1M basis,” Jefferies Group says on S&P 500 (SPX), Nasdaq 100 (NDX), and Russell 2000 (RTY) performance post major rate spikes.
“Looking further out, the NDX (naturally) is the only of the three that flags. The SPX trends back toward its historical return profile and the RTY actually tends to beat the SPX in the intermediate to longer-term”.
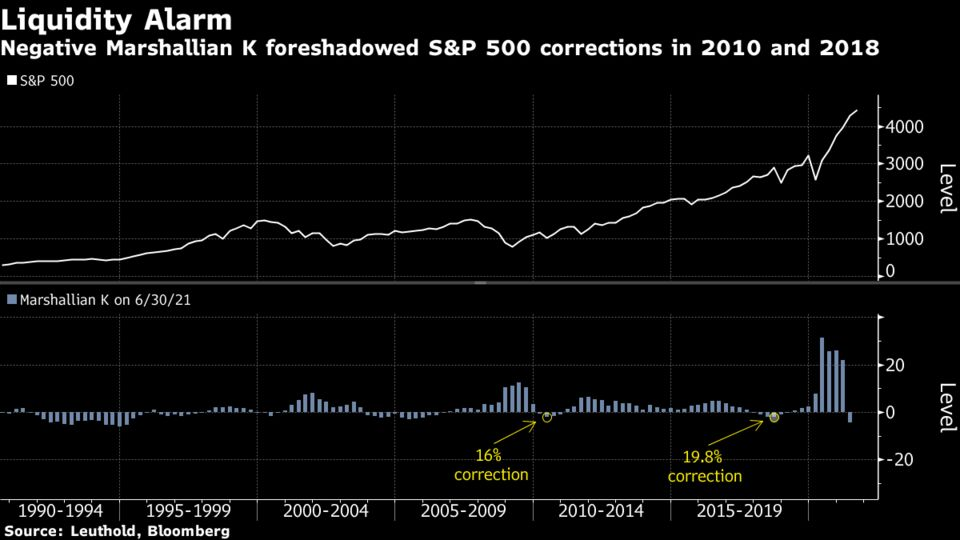
Beyond asset price support from a recovering economy, strong growth in business profits, rents, and other income, Moody’s Corporation (NYSE: MCO) believes another reason “financial markets are brushing off QT is that there will still be a lot of excess liquidity—a little less than $1 trillion— when the central bank’s balance sheet does begin to decline.”
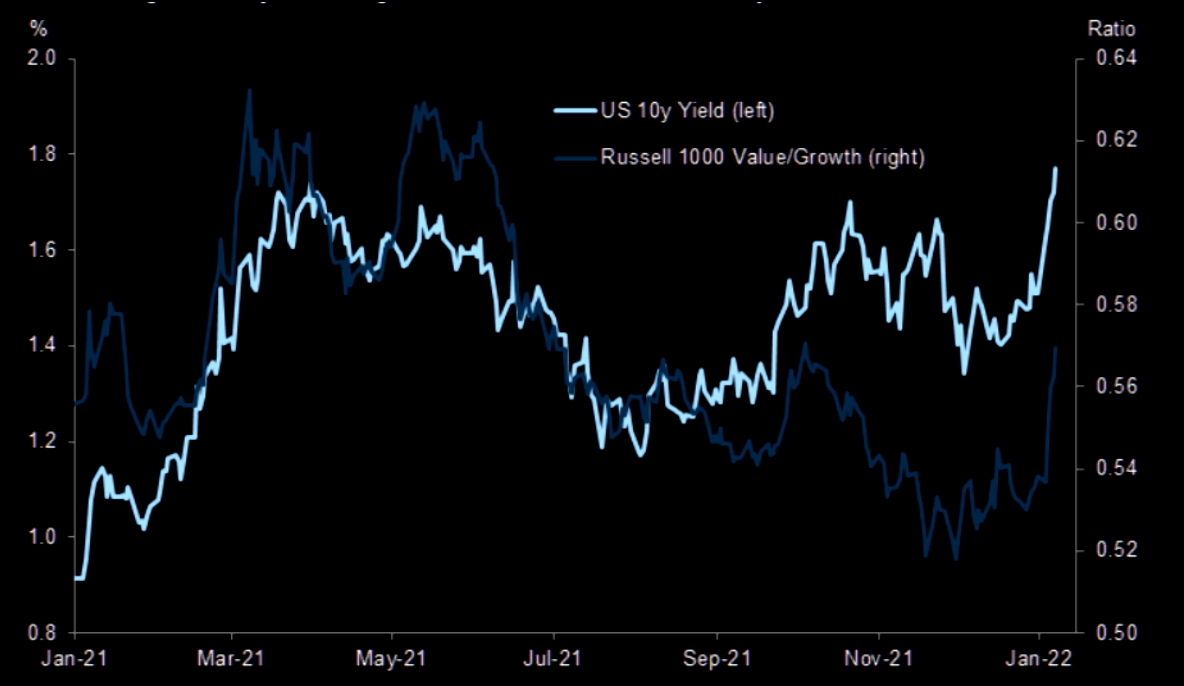
This excess liquidity is to shrink, naturally, as the economy grows quicker than the M2 money supply; the Marshallian K – the difference between year-over-year growth in M2 money supply and GDP – which had turned negative late last year (and prompted concerns around liquidity and its impact on the equity market) is now positive.
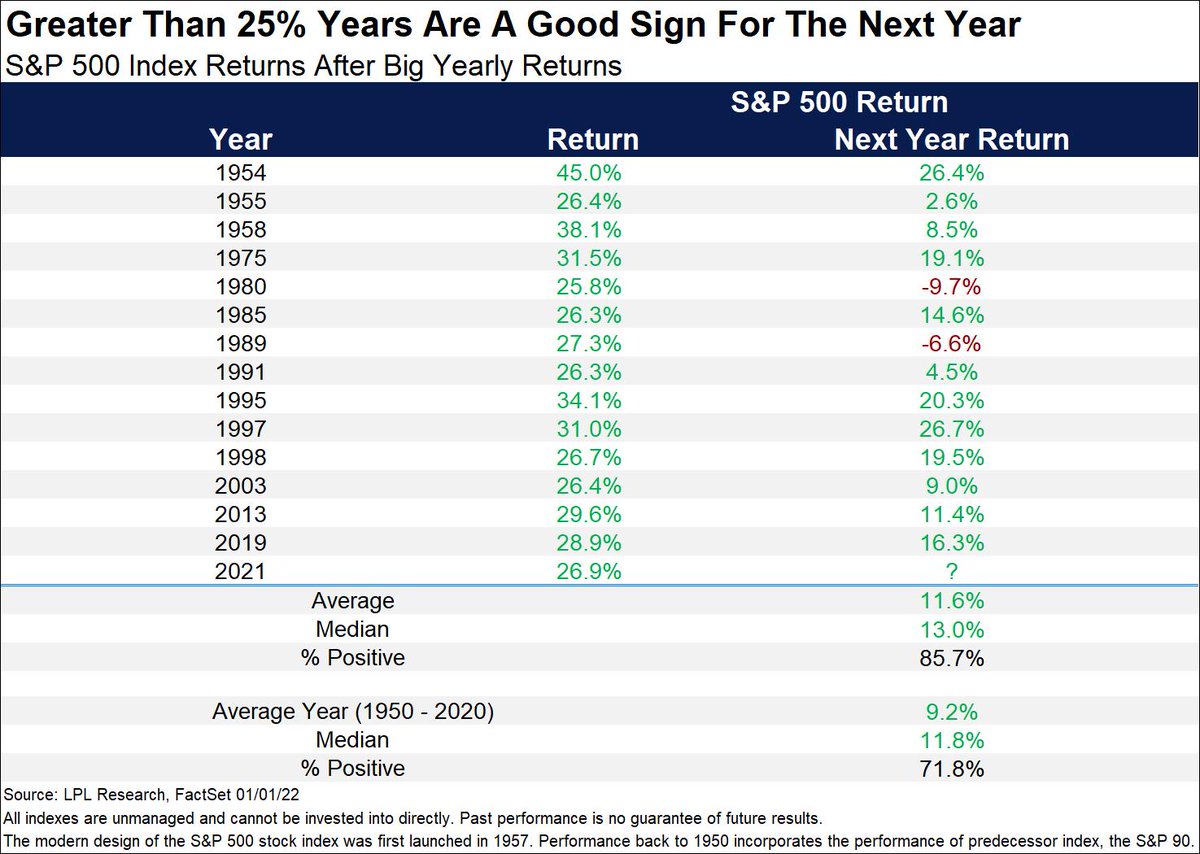
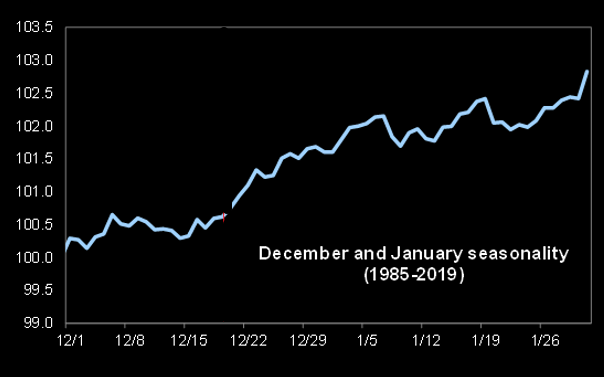
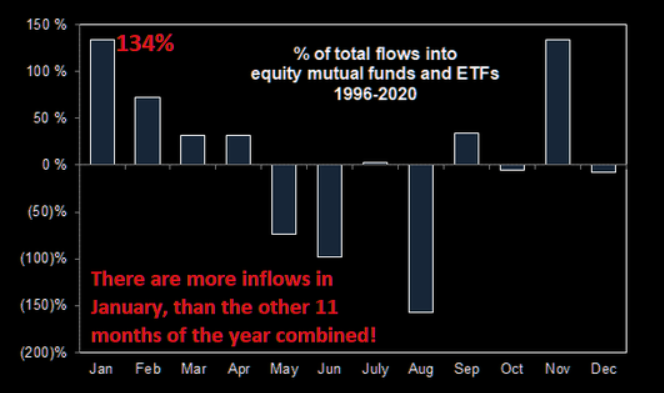
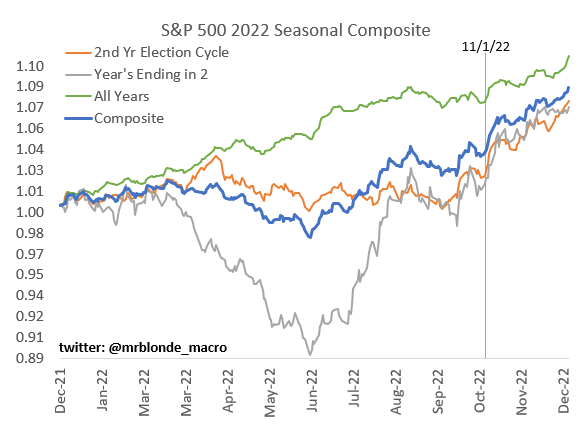
Notwithstanding, according to Callum Thomas, “[t]he election cycle + decennial cycle (i.e. that ‘years ending in 2’ line) suggest some challenging months ahead… (as opposed to the usual unconditional seasonal pattern).”
Positioning: Heading into Monday’s session, the broader market was set to experience increased two-way volatility.
That happened. The S&P 500 and Nasdaq 100 explored lower but ended higher yesterday.
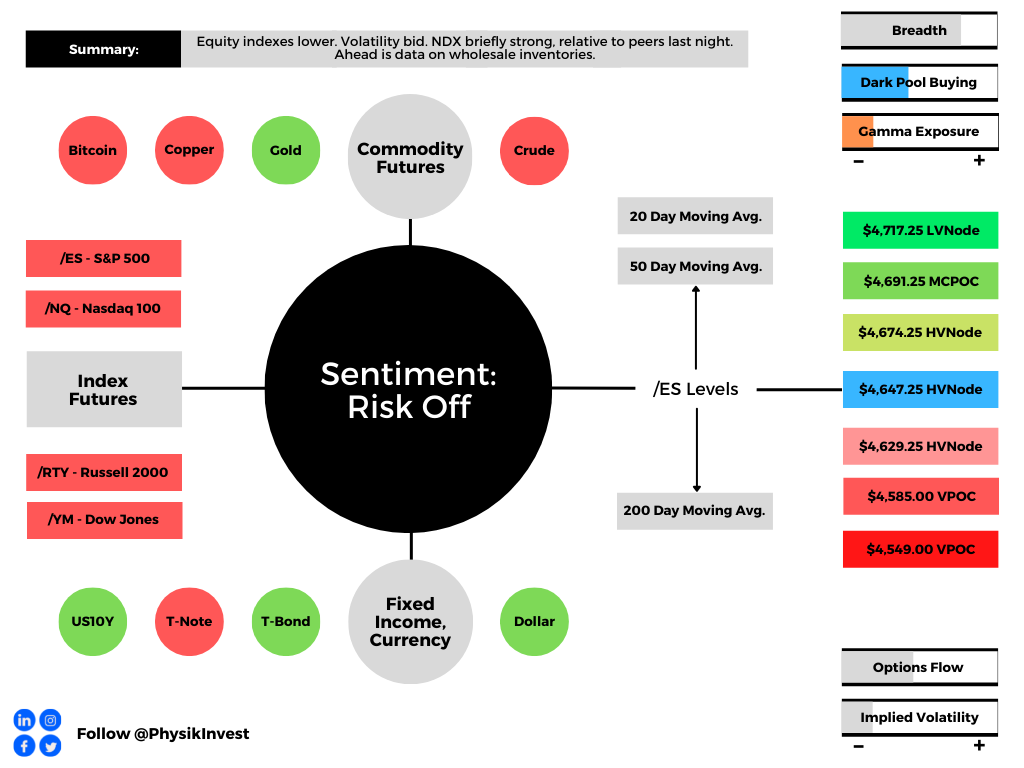
What’s next? There’s been a noticeable shift in relative strength. The Nasdaq 100 has firmed, relative to its counterparts, and overnight activity built on yesterday’s end-of-day advance.
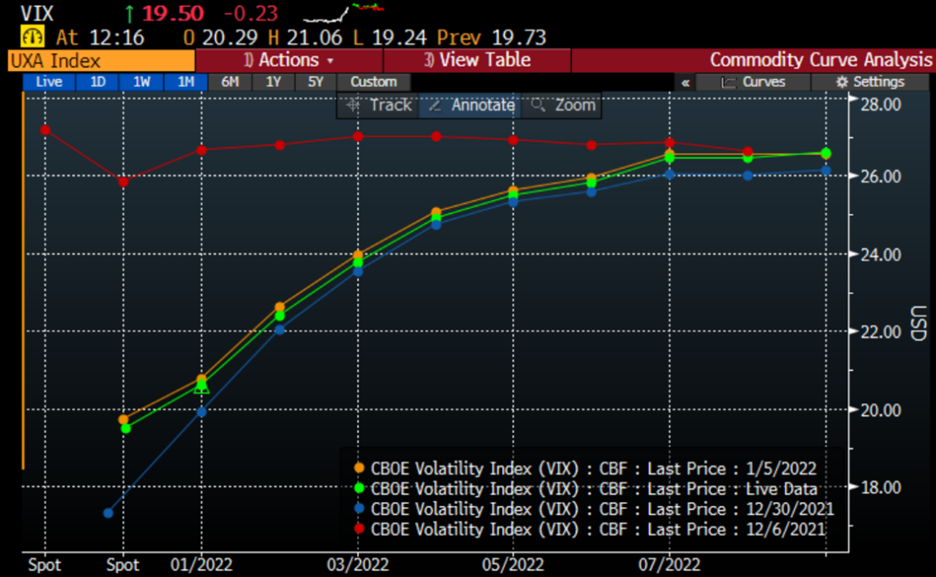
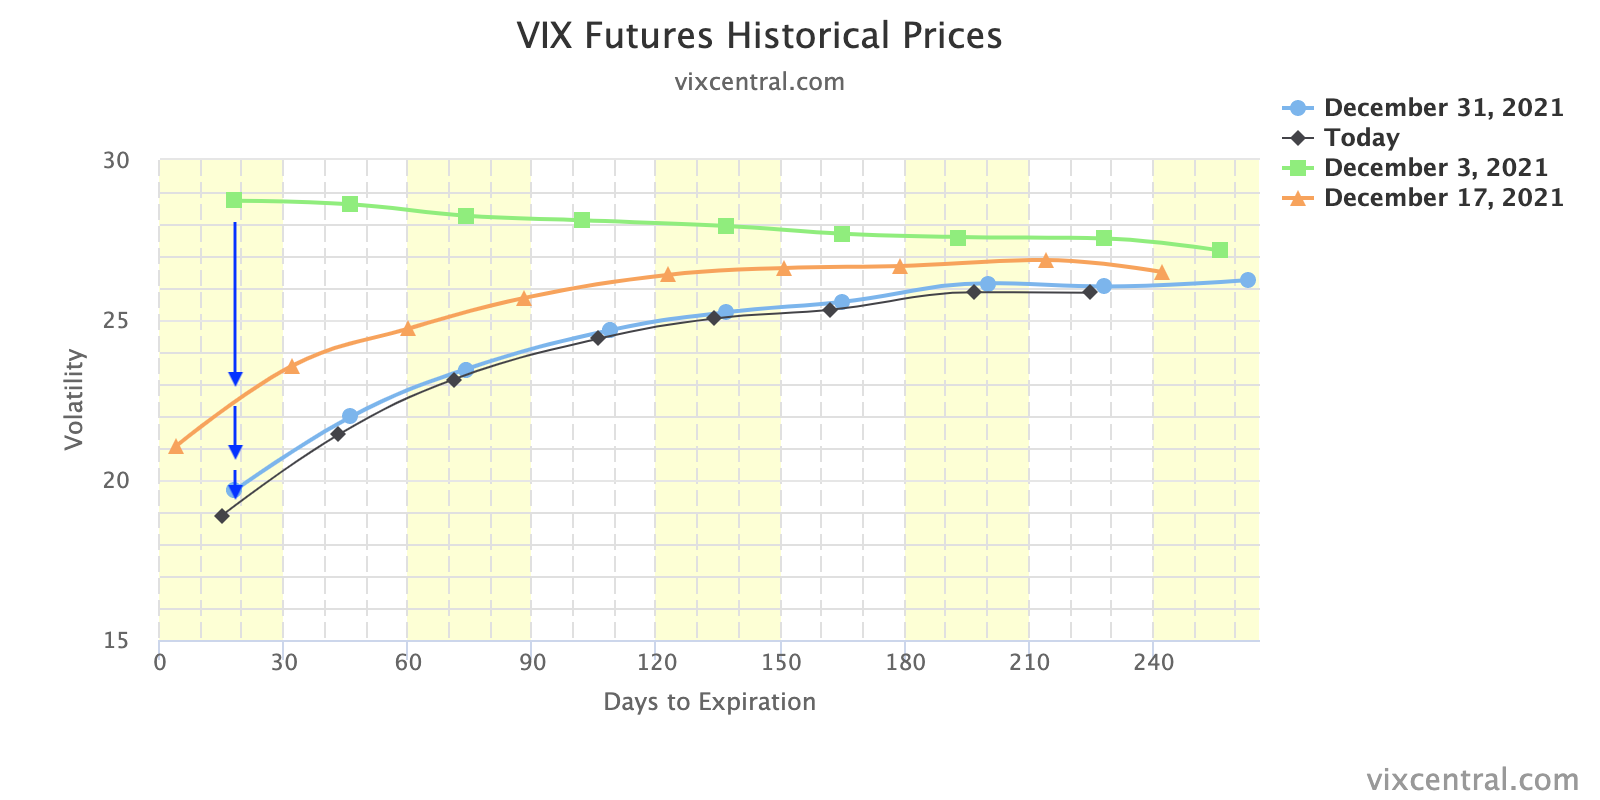
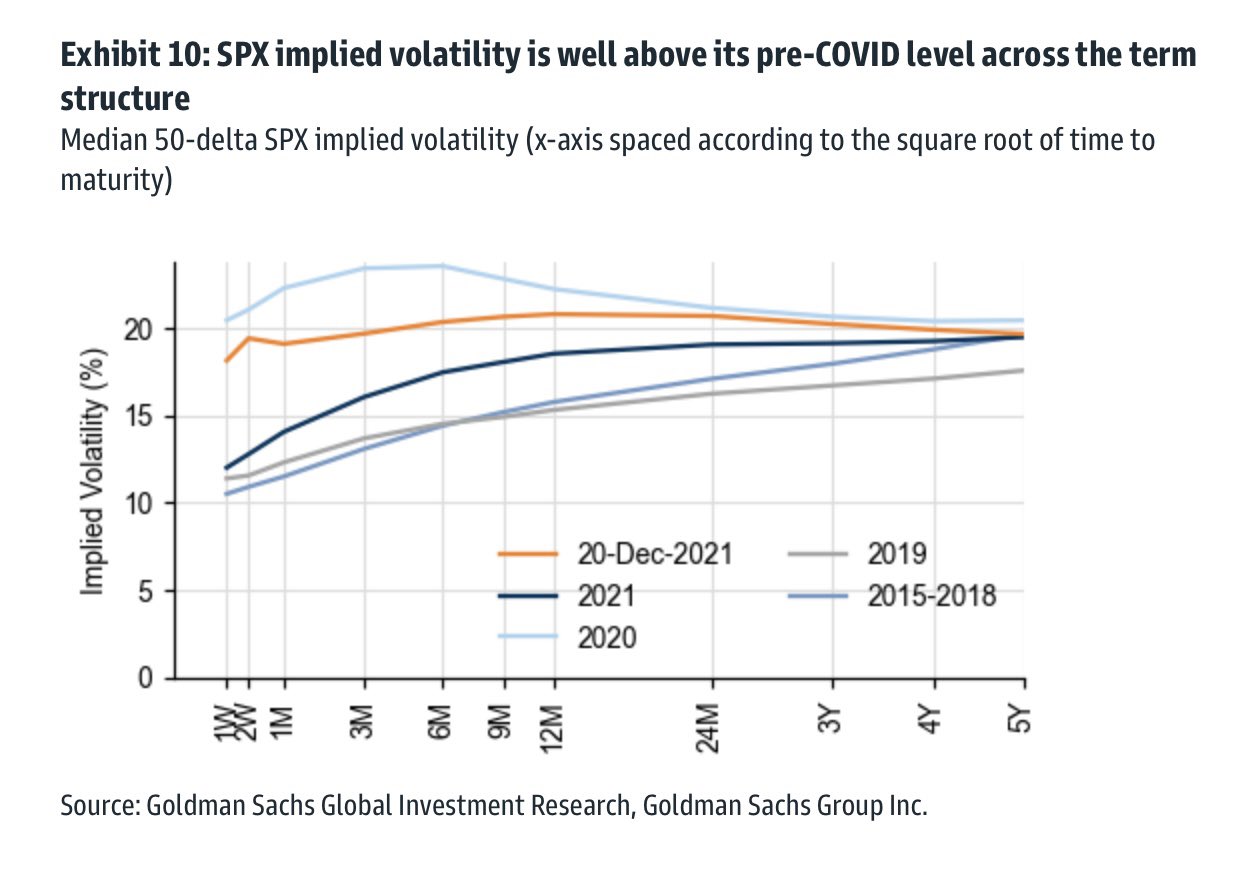
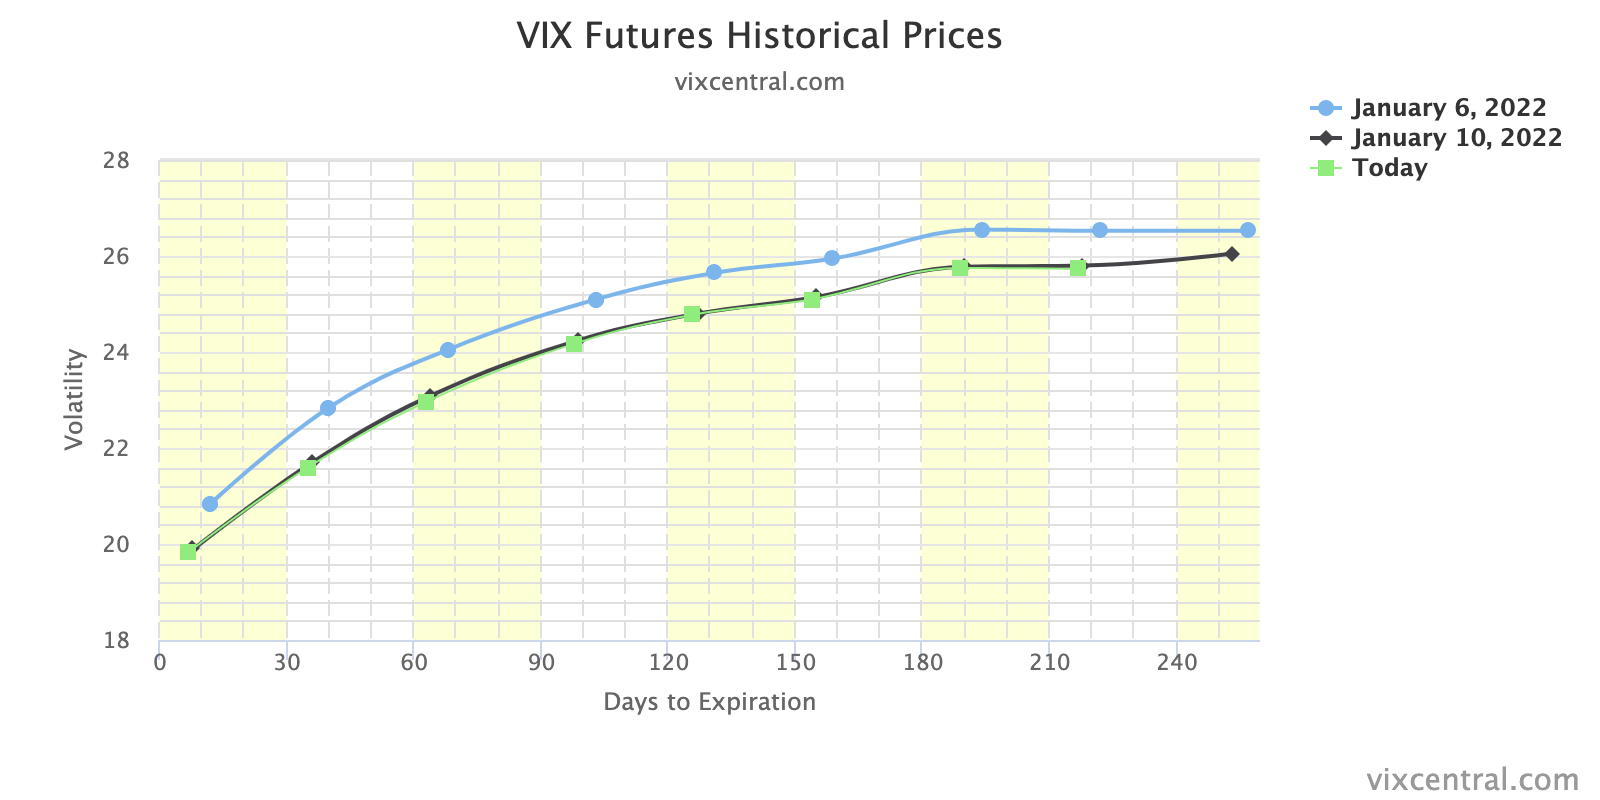
At the same time, the VIX term structure, a good gauge of fear, remained upward sloping and volatility (via the Cboe Volatility Index) compressed suggesting a reduction in the demand for protection.
All that means is that the opposite of what was expected heading into yesterday happened.
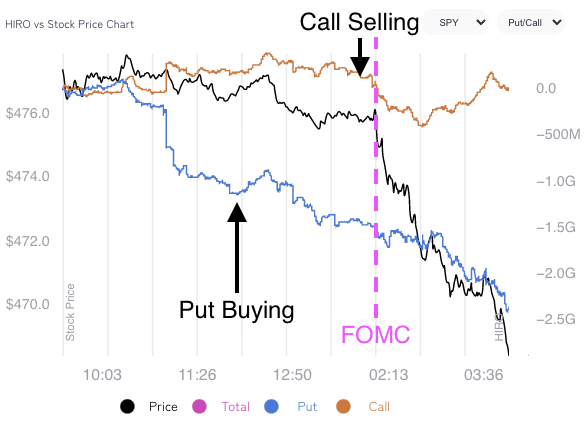
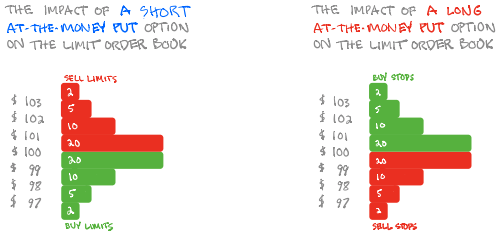
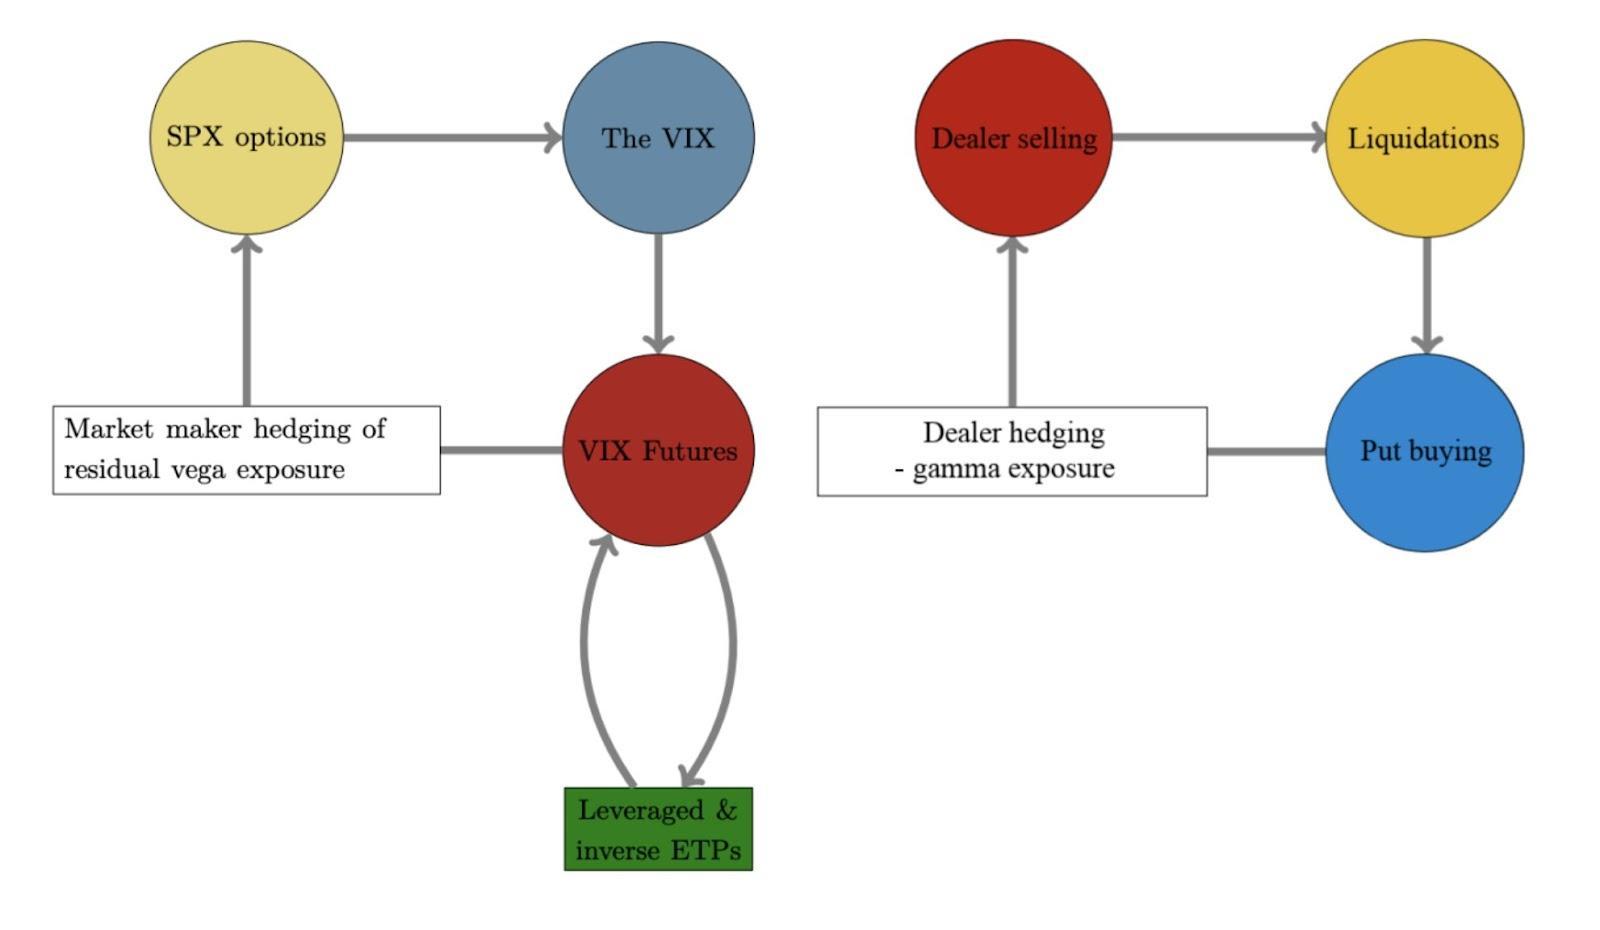
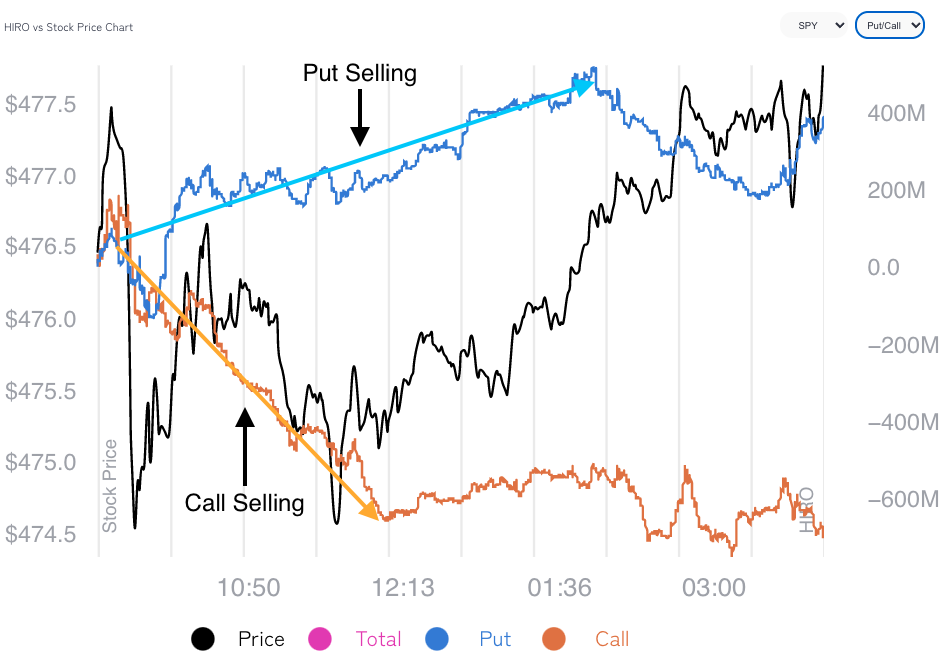
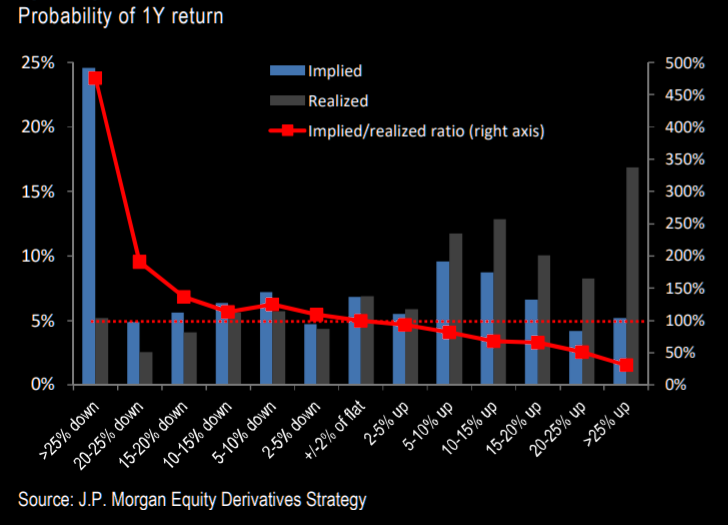
Recall, in demanding downside protection (buying a put), customers indirectly take liquidity as the counterparties hedge their short put exposure by selling underlying.
Higher implied volatility marks up options delta (exposure to direction) and this leads to more selling, as hedging pressures exacerbate weakness.
Alongside yesterday’s end-of-day rally, lower implied volatility marked down options delta (exposure to direction). This lead to buying by the counterparty.
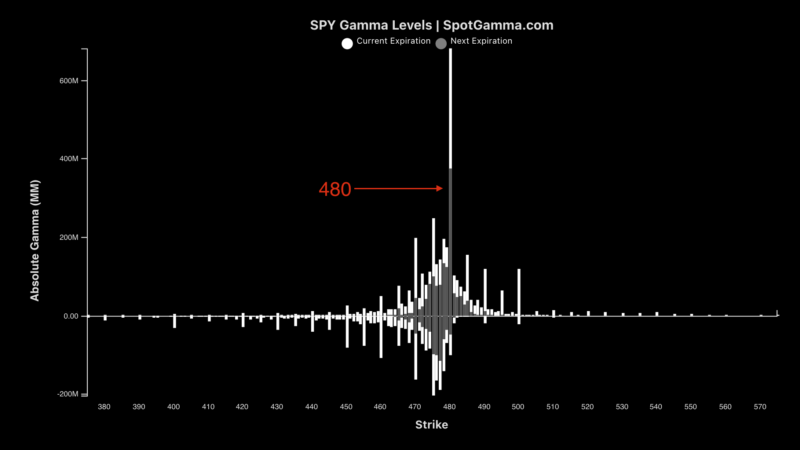
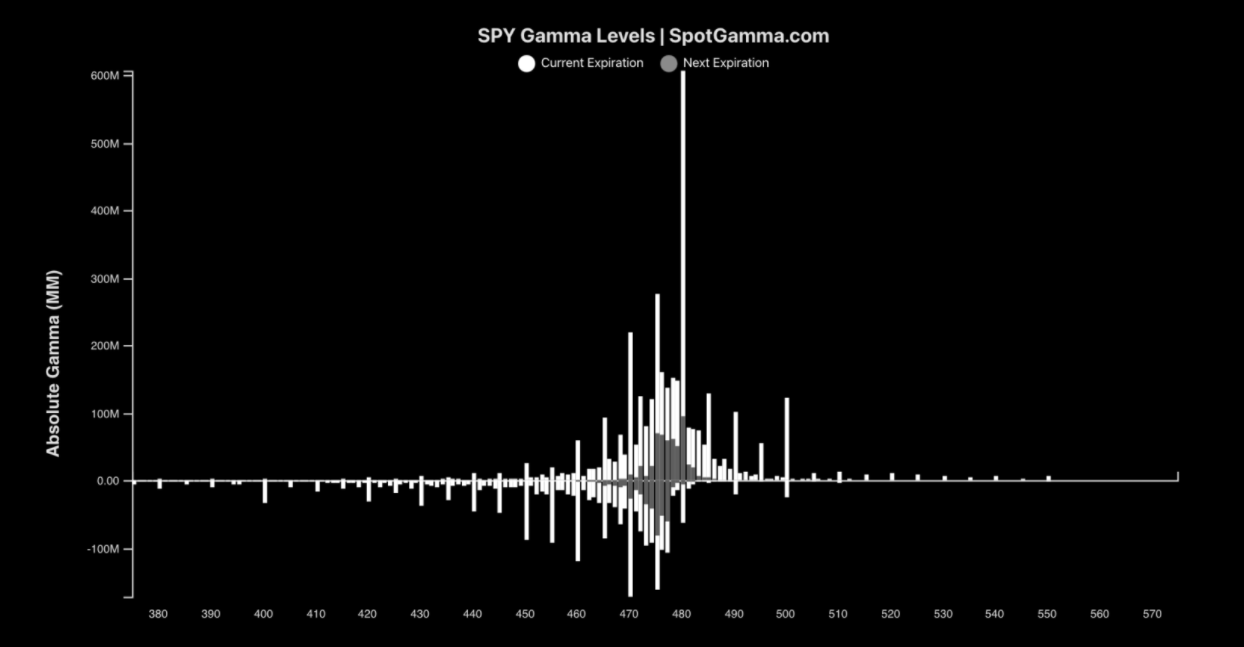
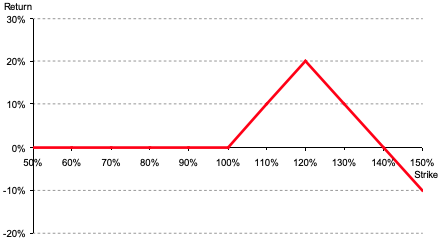
We can maintain the notion that despite markets tending toward instability so long as volatility is heightened and products (especially some constituents) remain in negative gamma, the dip lower and demand for protection may serve to prime the market for upside (when volatility starts to compress again and counterparties unwind hedges thus supporting any attempt higher).
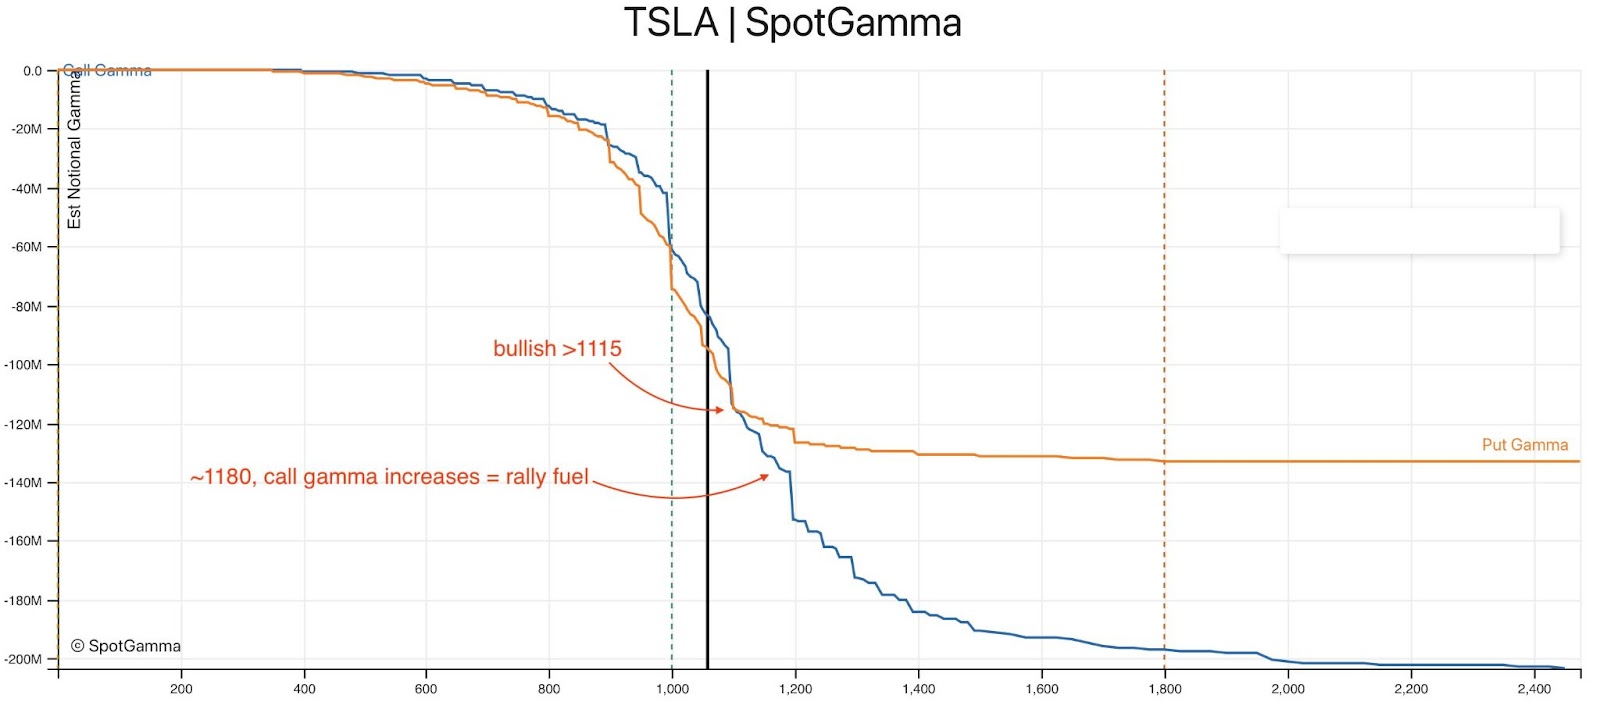
“Failure to expand the range, lower, on the index level, at least, likely invokes supportive dealer hedging flows with respect to time (‘charm’) and volatility (‘vanna’),” SpotGamma.
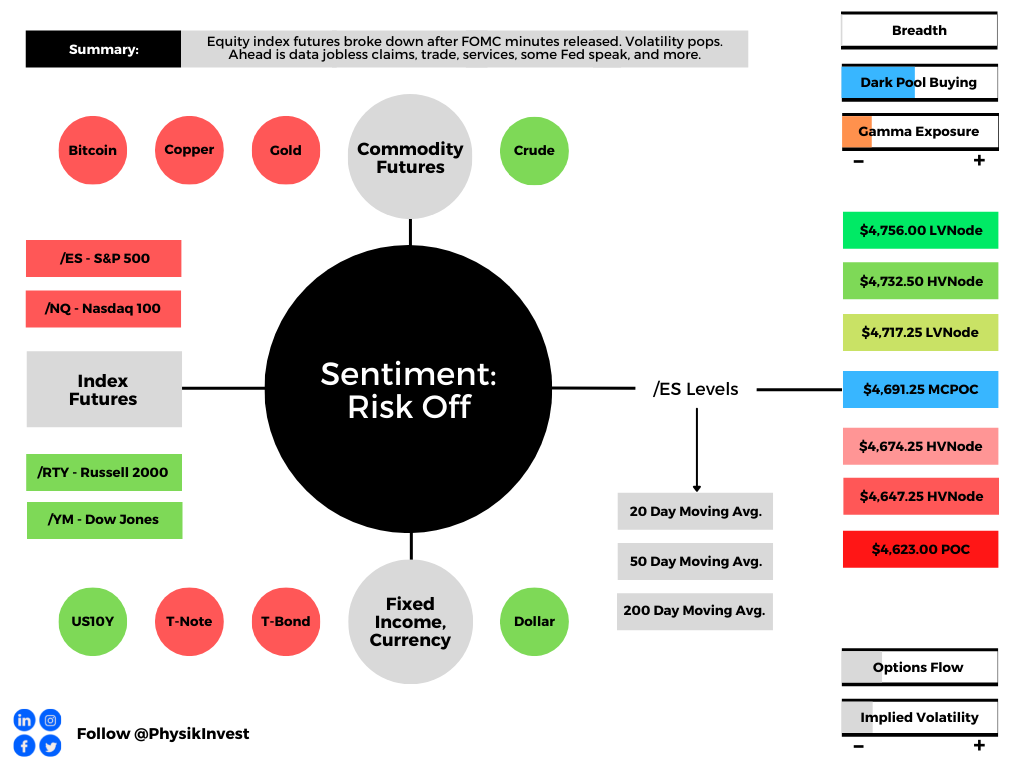
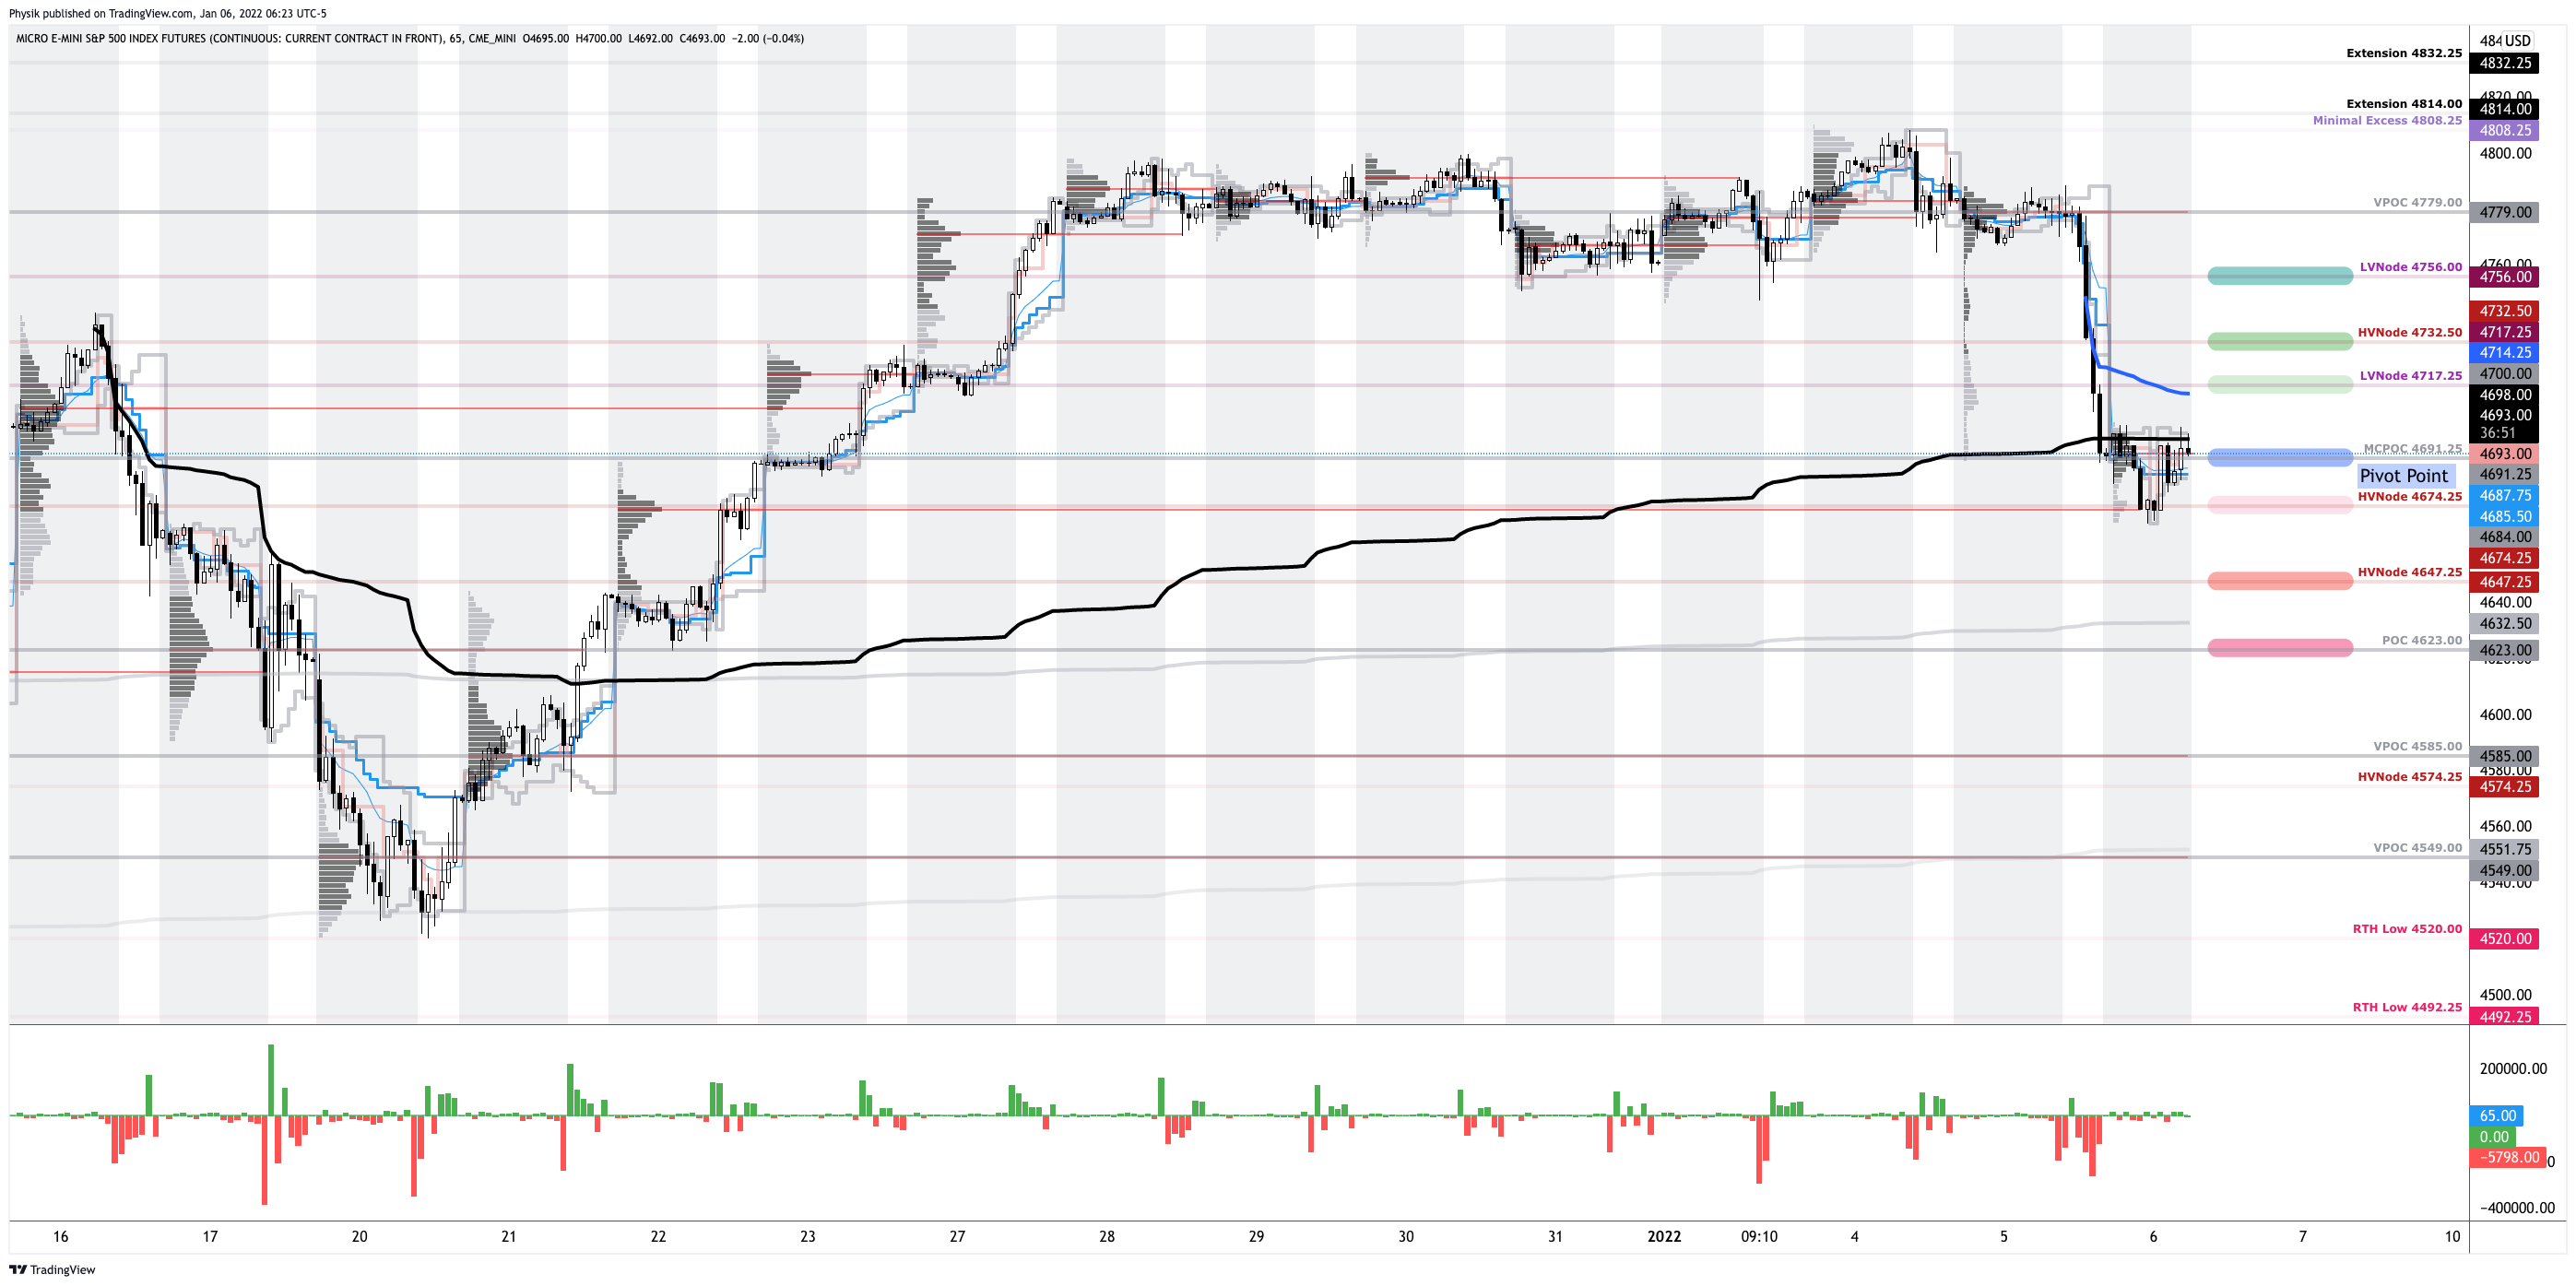
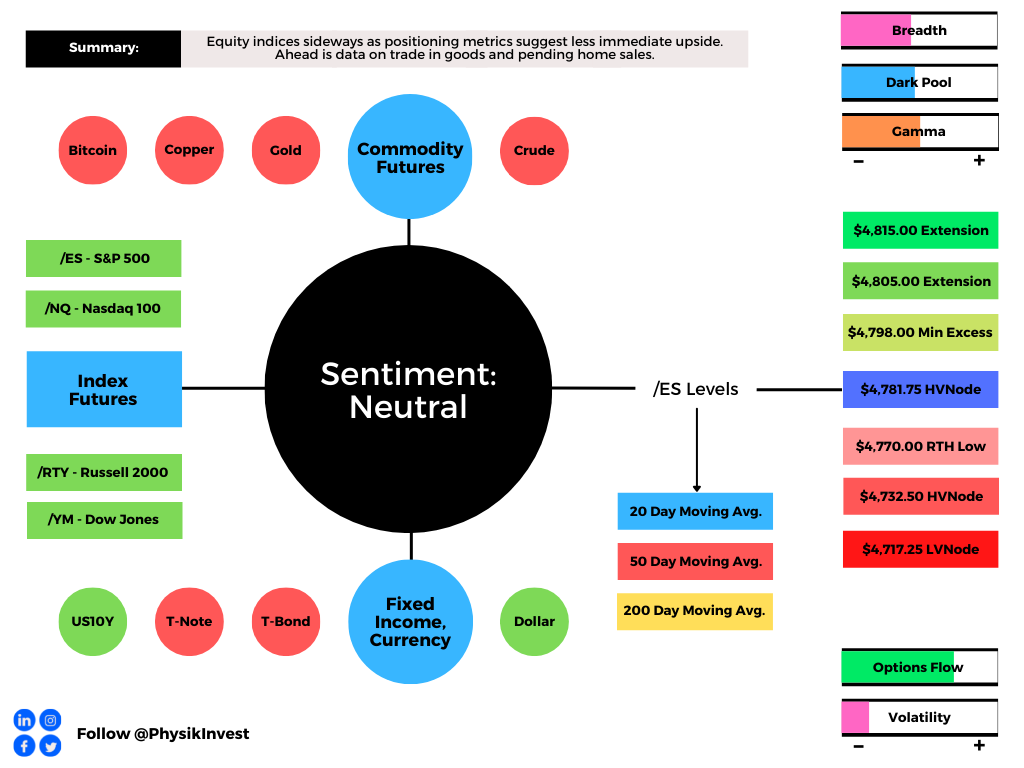
Technical: As of 6:40 AM ET, Tuesday’s regular session (9:30 AM – 4:00 PM ET), in the S&P 500, will likely open in the upper part of a positively skewed overnight inventory, outside of prior-range and -value, suggesting a potential for immediate directional opportunity.
Gap Scenarios: Gaps ought to fill quickly. Should they not, that’s a signal of strength; do not fade. Leaving value behind on a gap-fill or failing to fill a gap (i.e., remaining outside of the prior session’s range) is a go-with indicator.

Auctioning and spending at least 1-hour of trade back in the prior range suggests a lack of conviction; in such a case, do not follow the direction of the most recent initiative activity.
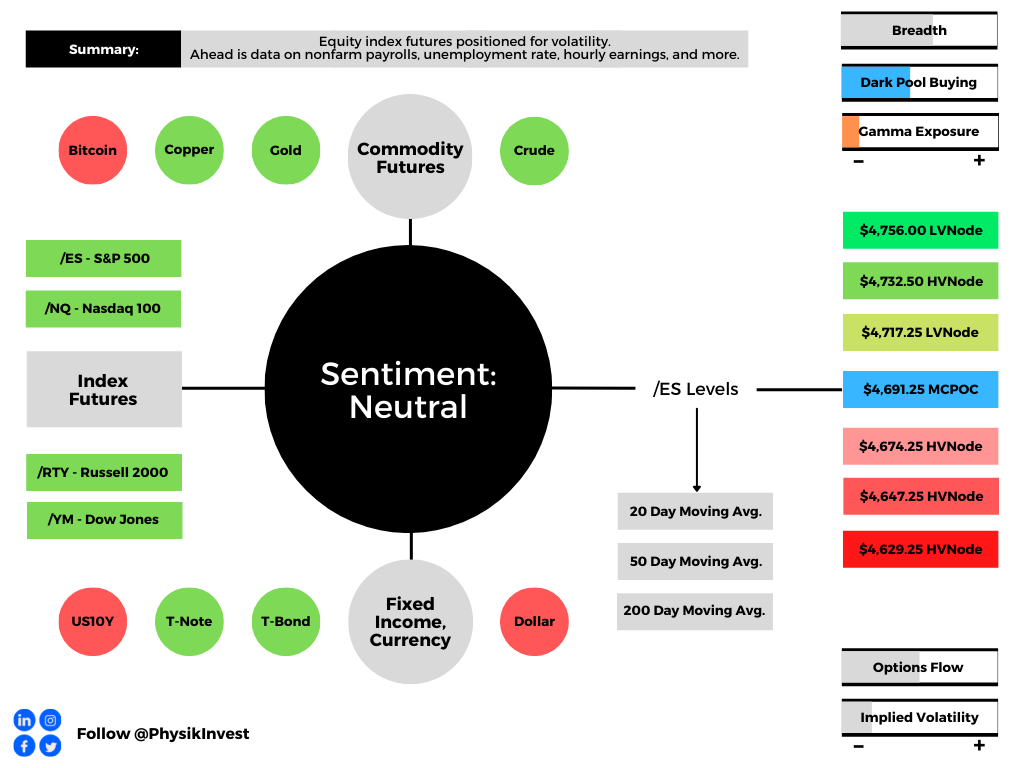
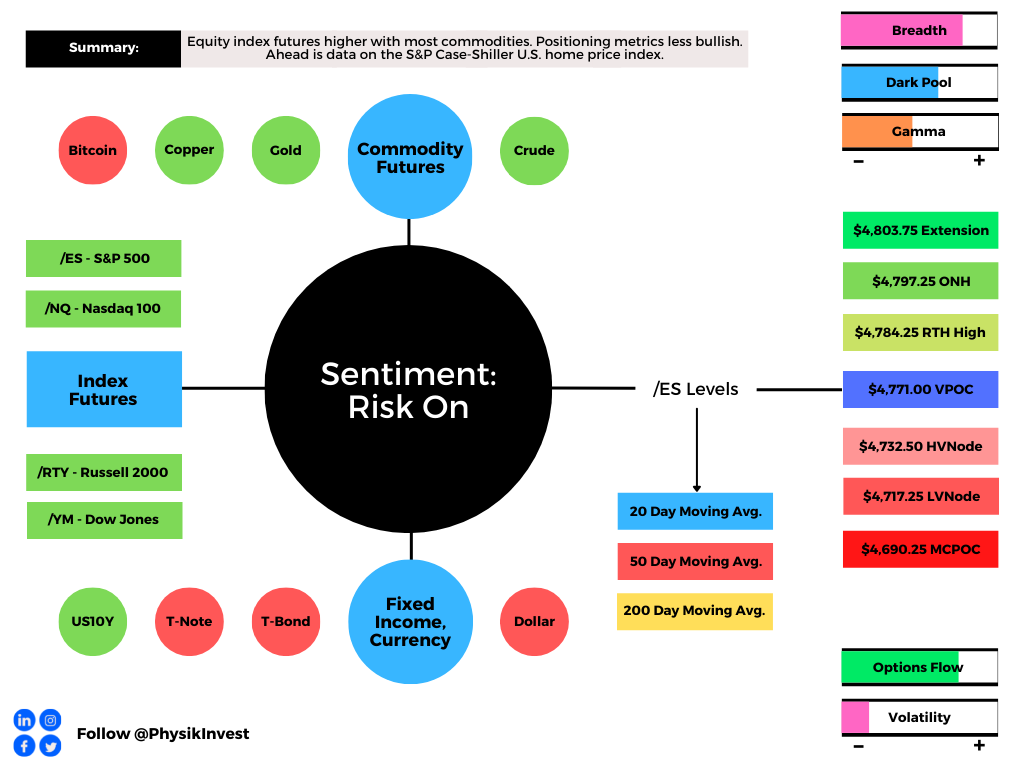
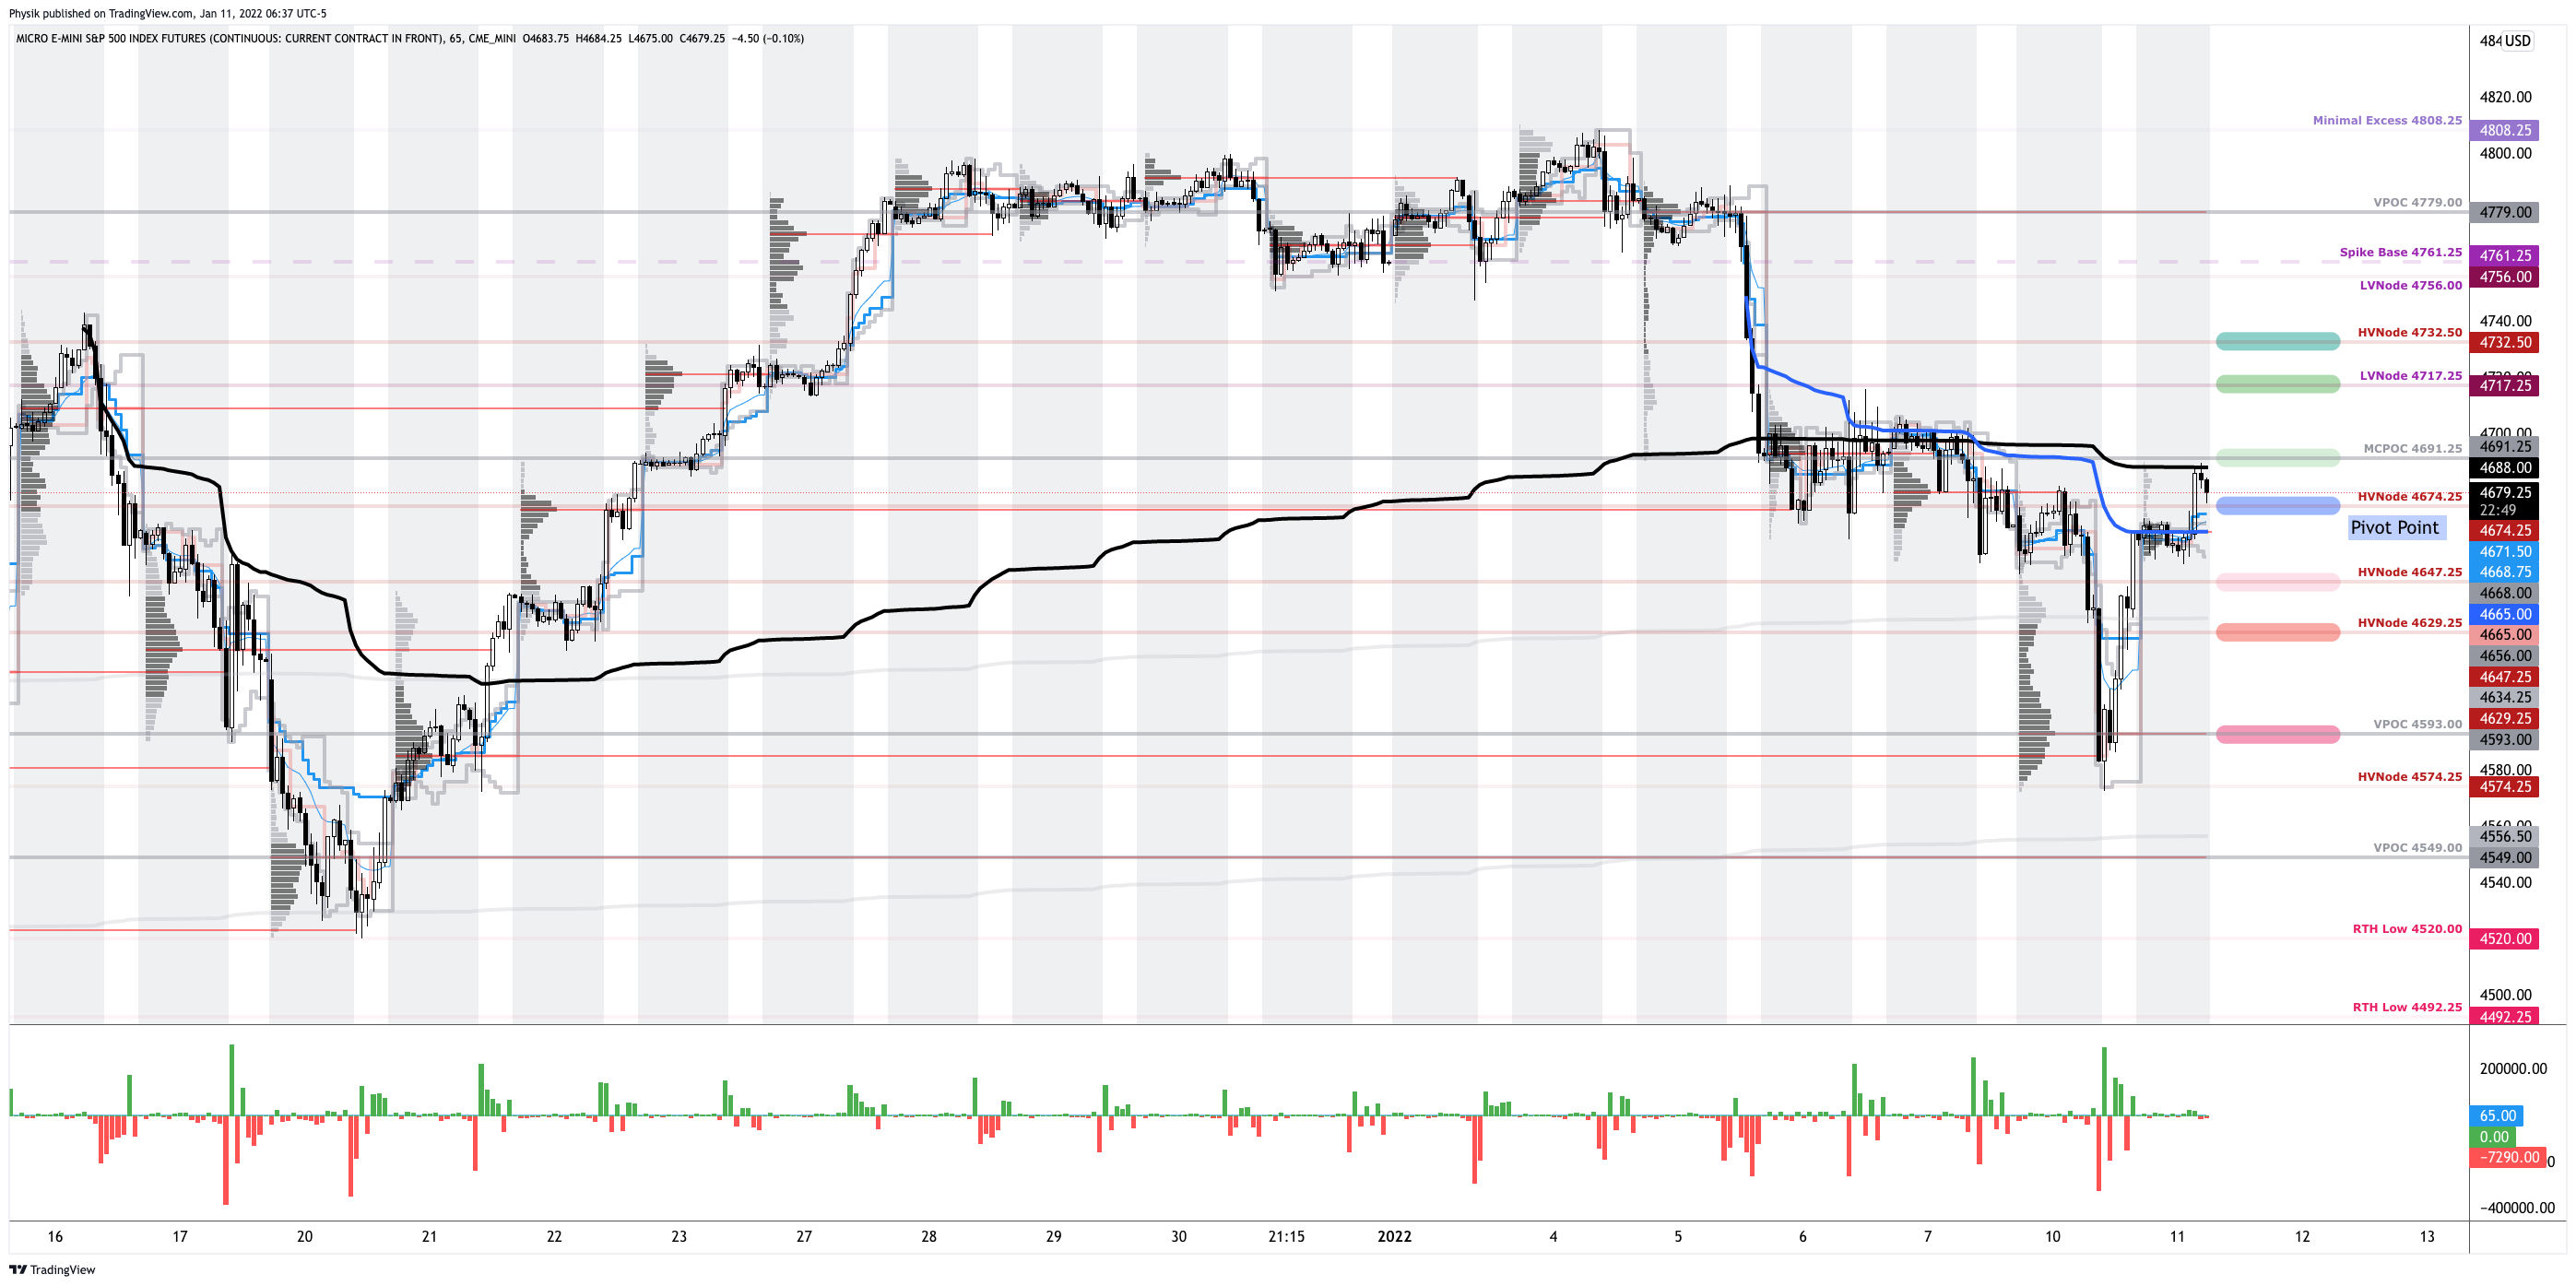
In the best case, the S&P 500 trades higher; activity above the $4,674.25 high volume area (HVNode) puts in play the $4,691.25 micro composite point of control (MCPOC). Initiative trade beyond the MCPOC could reach as high as the $4,717.25 low volume area (LVNode) and $4,732.50 HVNode, or higher.
In the worst case, the S&P 500 trades lower; activity below the $4,674.25 HVNode puts in play the $4,647.25 HVNode. Initiative trade beyond the latter could reach as low as the $4,629.25 HVNode and $4,593.00 untested point of control (VPOC), or lower.
Click here to load today’s key levels into the web-based TradingView charting platform. Note that all levels are derived using the 65-minute timeframe. New links are produced, daily.
What People Are Saying
Definitions
Volume Areas: A structurally sound market will build on areas of high volume (HVNodes). Should the market trend for long periods of time, it will lack sound structure, identified as low volume areas (LVNodes). LVNodes denote directional conviction and ought to offer support on any test.
If participants were to auction and find acceptance into areas of prior low volume (LVNodes), then future discovery ought to be volatile and quick as participants look to HVNodes for favorable entry or exit.
POCs: POCs are valuable as they denote areas where two-sided trade was most prevalent in a prior day session. Participants will respond to future tests of value as they offer favorable entry and exit.
MCPOCs: POCs are valuable as they denote areas where two-sided trade was most prevalent over numerous day sessions. Participants will respond to future tests of value as they offer favorable entry and exit.
About
After years of self-education, strategy development, mentorship, and trial-and-error, Renato Leonard Capelj began trading full-time and founded Physik Invest to detail his methods, research, and performance in the markets.
Capelj is also a Benzinga finance and technology reporter interviewing the likes of Shark Tank’s Kevin O’Leary, JC2 Ventures’ John Chambers, FTX’s Sam Bankman-Fried, and ARK Invest’s Catherine Wood, as well as a SpotGamma contributor developing insights around impactful options market dynamics.
Disclaimer
Physik Invest does not carry the right to provide advice.
In no way should the materials herein be construed as advice. Derivatives carry a substantial risk of loss. All content is for informational purposes only.