The Daily Brief will be on pause till June 7, 2022, due to the author’s travel commitments. Apologies for this inconvenience.
What Happened
Overnight, U.S. equity index futures came off of their Thursday peaks before, late in the morning, trading to a new rally high, at which is a confluence of technical nuances.
Thursday’s cash session was characterized by a near-vertical advance into mid-day. Then, trade became two-sided, a feature of short-covering and not new buying. More on this, later.
In the news was Citigroup Inc’s (NYSE: C) downgrading of U.S. stocks on recession risks and the “elements of a deflating bubble,” while leaning optimistic on China assets due to marginal policy support, there. This is on the heels of similar conclusions put forward by BlackRock Inc (NYSE: BLK) and Morgan Stanley (NYSE: MS).
Mortgage rates staged their biggest drop since April of 2020 as “the housing market has clearly slowed, and the deceleration is spreading to other segments of the economy,” the Federal Home Loan Mortgage Corporation’s (OTC: FMCC) Sam Khater explained.
In other news, Secretary of State Antony Blinken took aim at China, commenting on the U.S.’s intention to “shape the strategic environment around Beijing to advance [its] vision for an open, inclusive international system.” This is as the U.S. also plans economic talks with Taiwan.
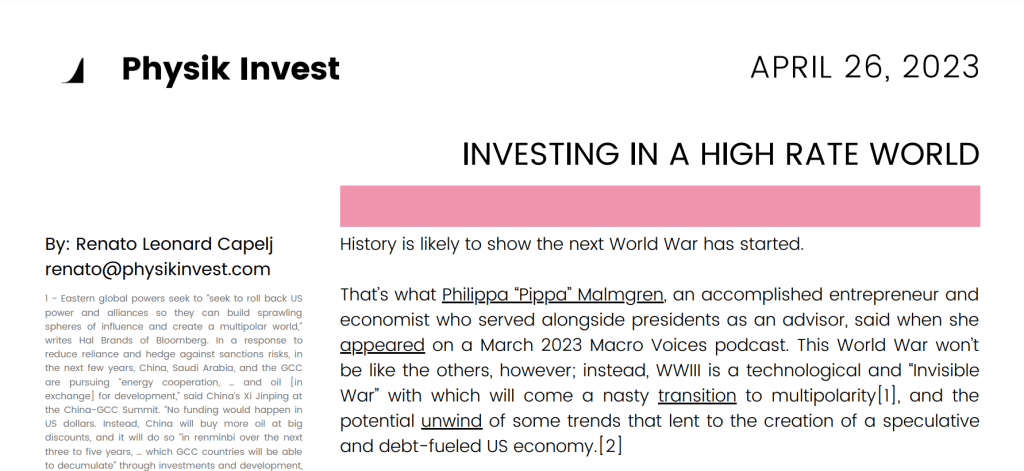
Pippa Malmgren, who is a former White House adviser and economist we wrote on earlier this week, discussed more of this decoupling and coordination among Eastern and Western powers.
In a two-part series, she explains the challenging of U.S. island bases by China and Russia, as well as their maritime strategies, “island hopping [and] shopping.” Check them out.
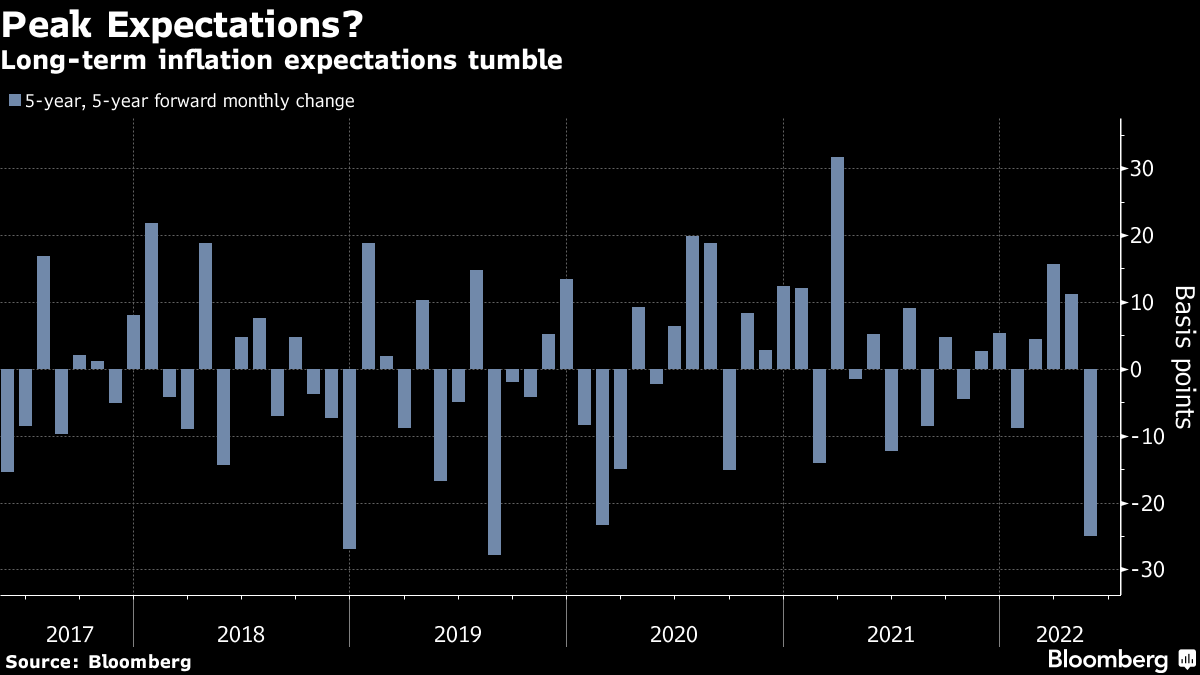
Today we received data on PCE inflation, real disposable and personal income, along with consumer spending and trade in goods (8:30 AM ET). University of Michigan Sentiment and five-year inflation expectations come later (10:00 AM ET).
What To Expect
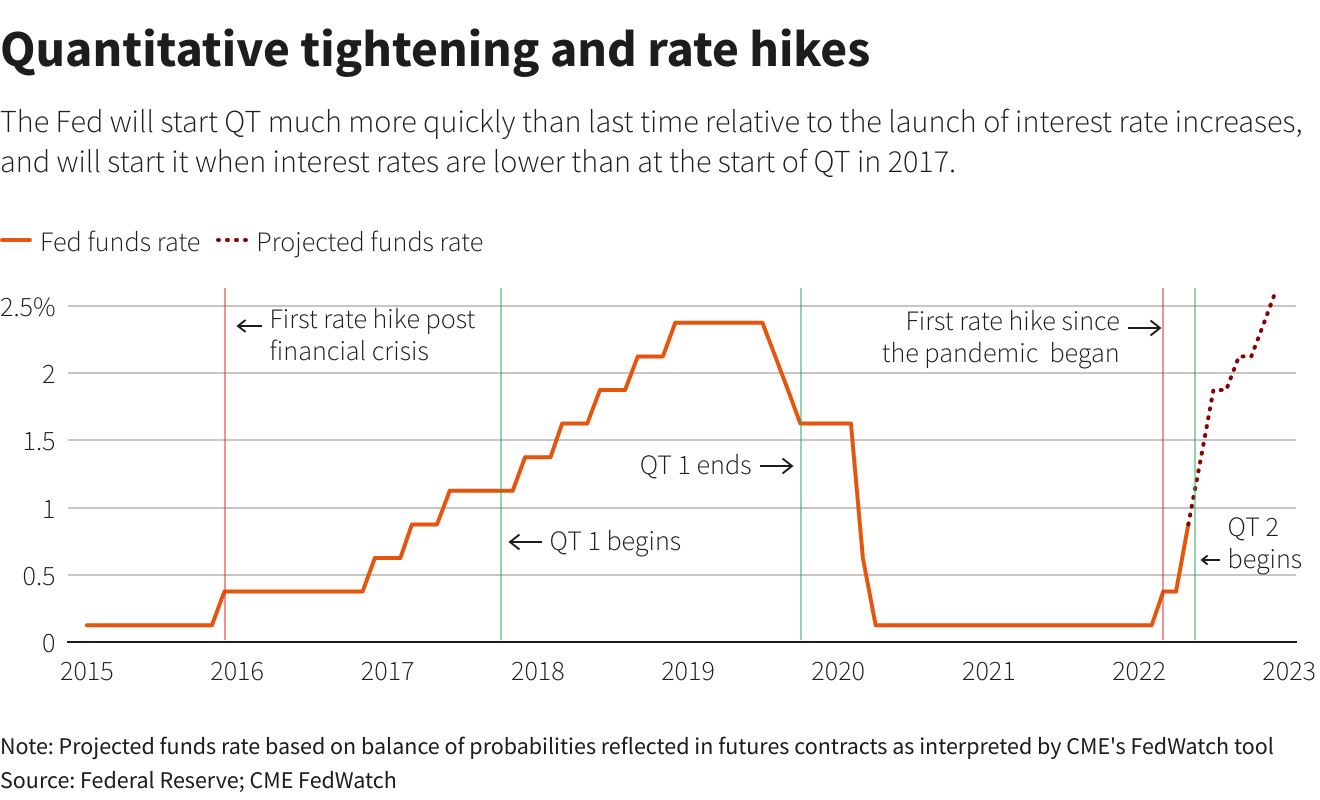
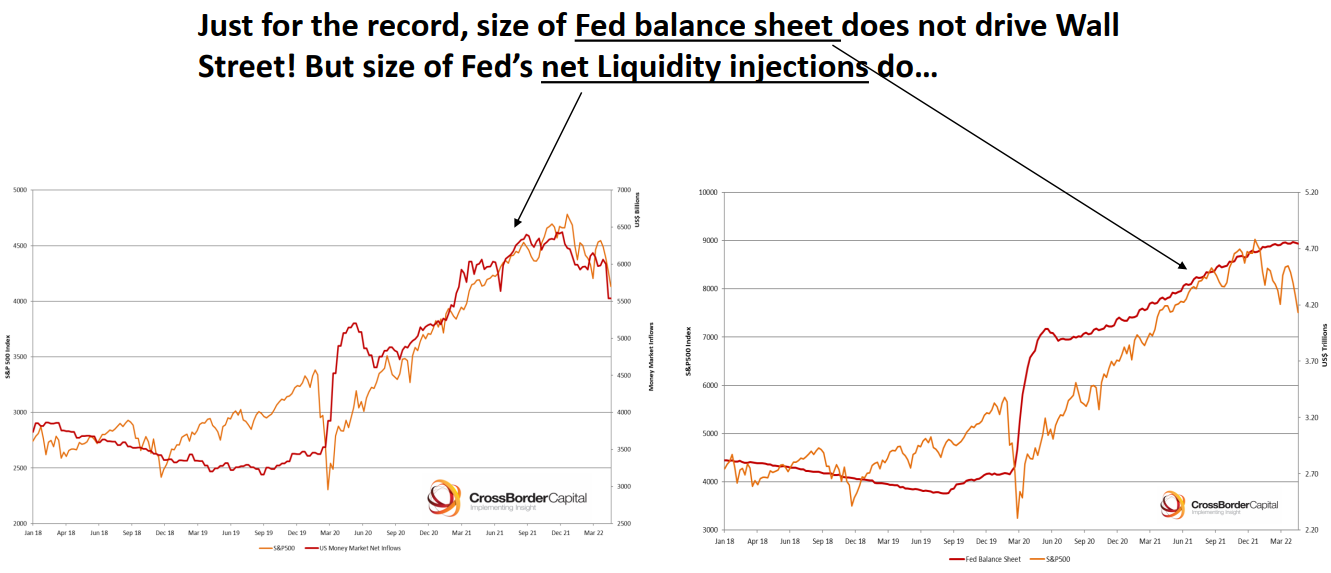
Fundamental: At its core, there’s a commitment to cutting liquidity and credit after the spending of COVID-era “benefits and lockdown savings … created a lot of demand,” and inflation.
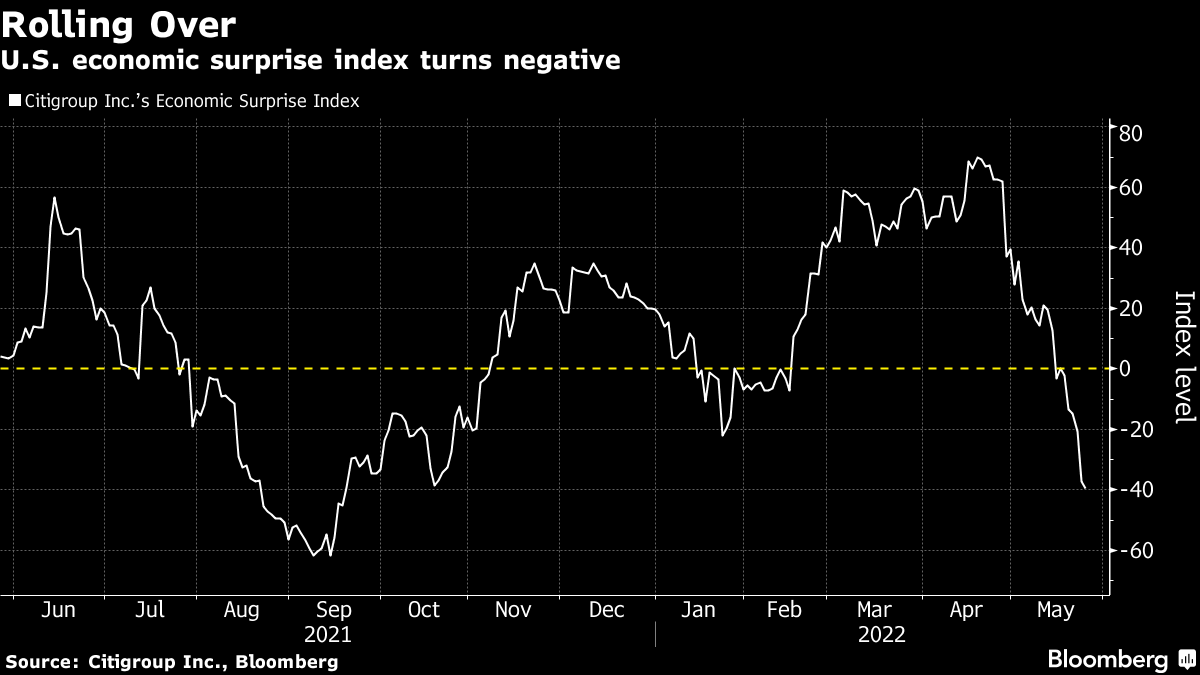
This has consequences on the real economy and asset prices, accordingly, which rose and kept the deflationary pressures of prevailing monetary policies at bay.
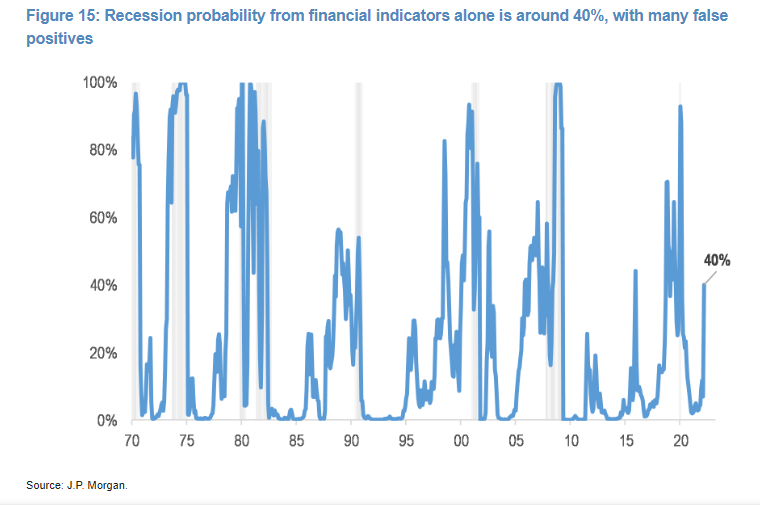
As unpacked, in detail, on May 18, 2022, there is an argument that stock market drops are both a recession and a reflection of the unwind of carry (or investment in long-duration bets with cheap debt) – a deflationary shock.
“The Fed has a mandate … to control price stability,” Kai Volatility’s Cem Karsan had explained.
“With supply-side economics, the only way that they can control this ultimately is to pull back. And slow capital markets decrease via the wealth effect. Ultimately, there’s a significant lag, so they are not in a position to ultimately control inflation without bringing down markets.”
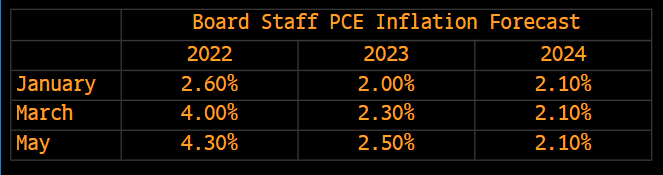
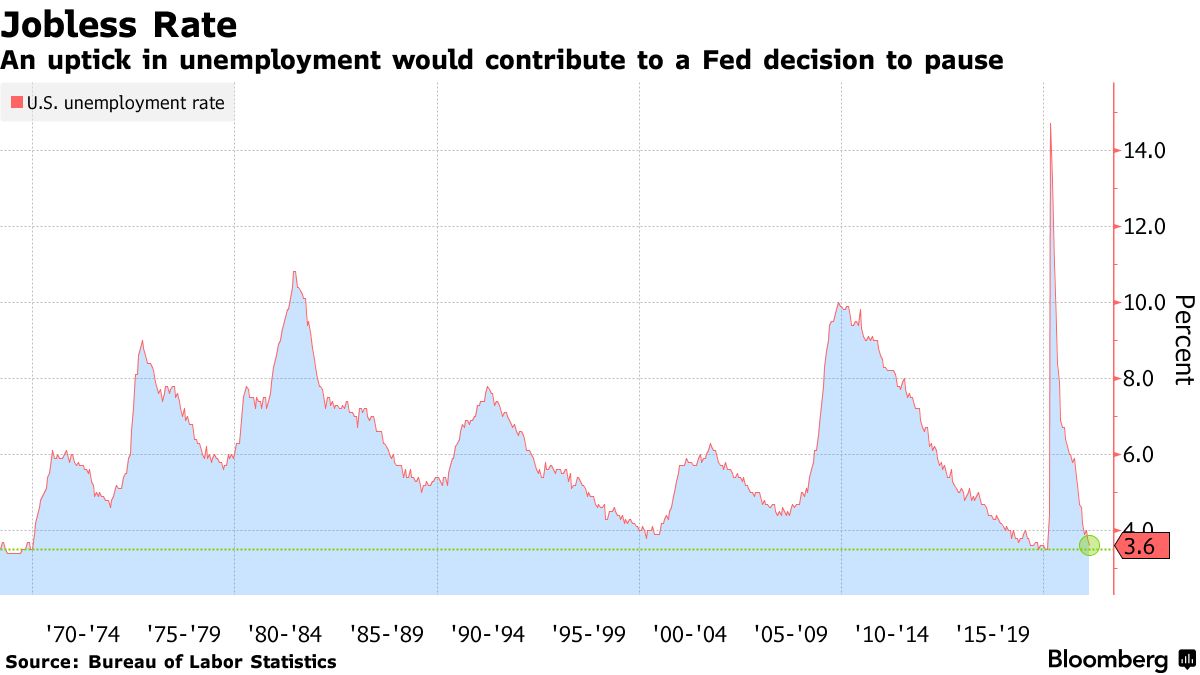
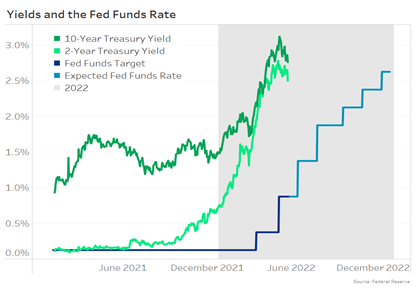
Accordingly, in our May 25, 2022 commentary, in which we discussed what to search for in the minutes of the last Federal Open Market Committee (FOMC) meeting. Knowing that there’s a lag in policy impact, we accurately floated the potential for the Federal Reserve (Fed) to “shift gears” late this summer if further cooling of inflation and “evidence of a growth slowdown.”
“Policy works with a lag,” as Diane Swonk of Grant Thorton explained. The Fed may pause as it seeks to “catch up but not outrun the market in its effort to tighten credit market conditions.”
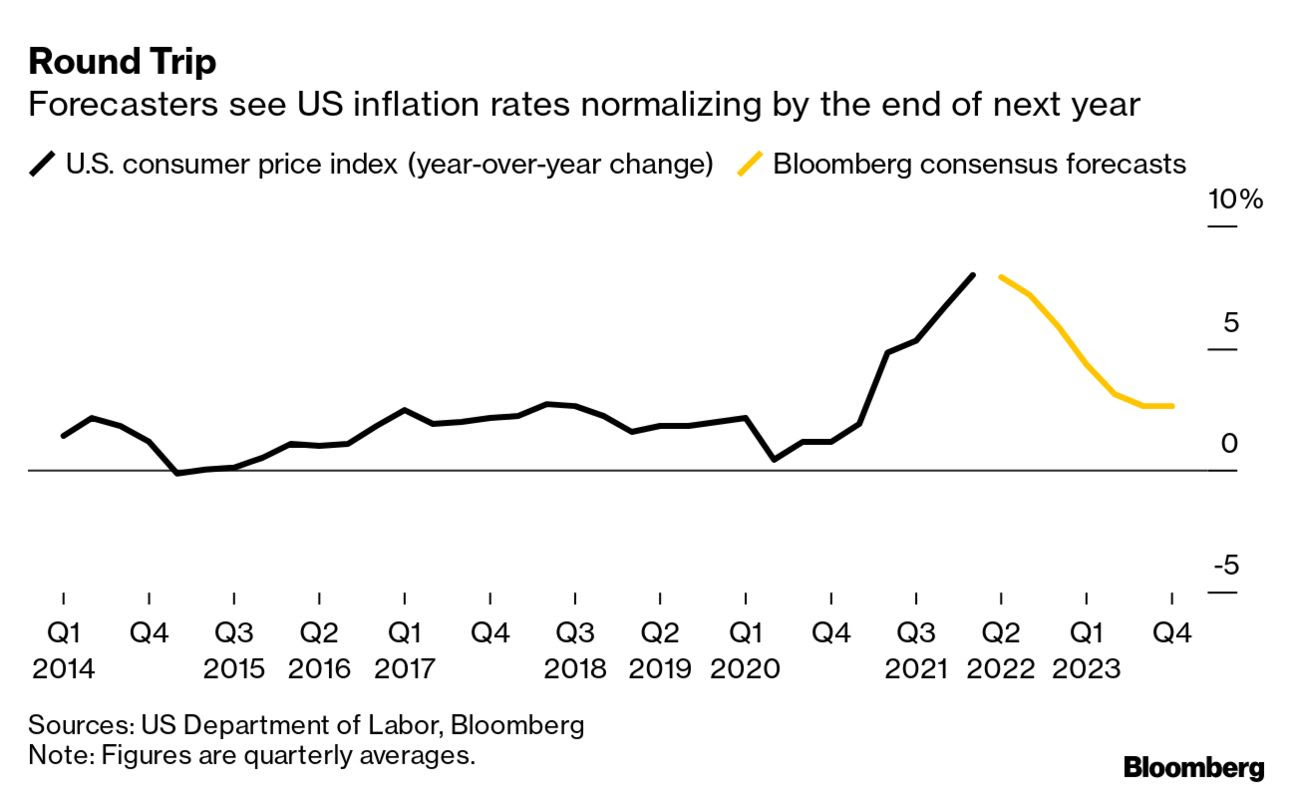
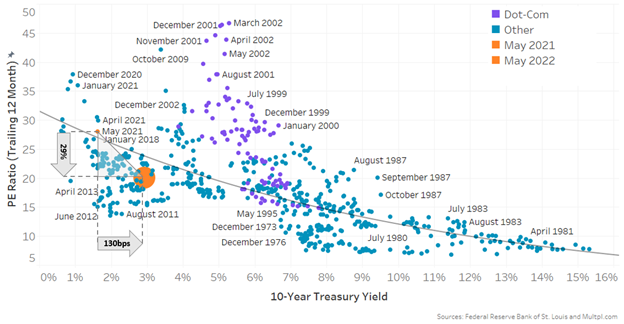
“There is still more progress to be made in bringing inflation expectations down to resonate with the Committee’s target, but current valuations are at least in the realm of acceptable,” Ian Lyngen, who is head of U.S. rates strategy at the Bank of Montreal (NYSE: BMO), said.
“The market is showing some faith in Powell’s inflation-fighting creditability.”

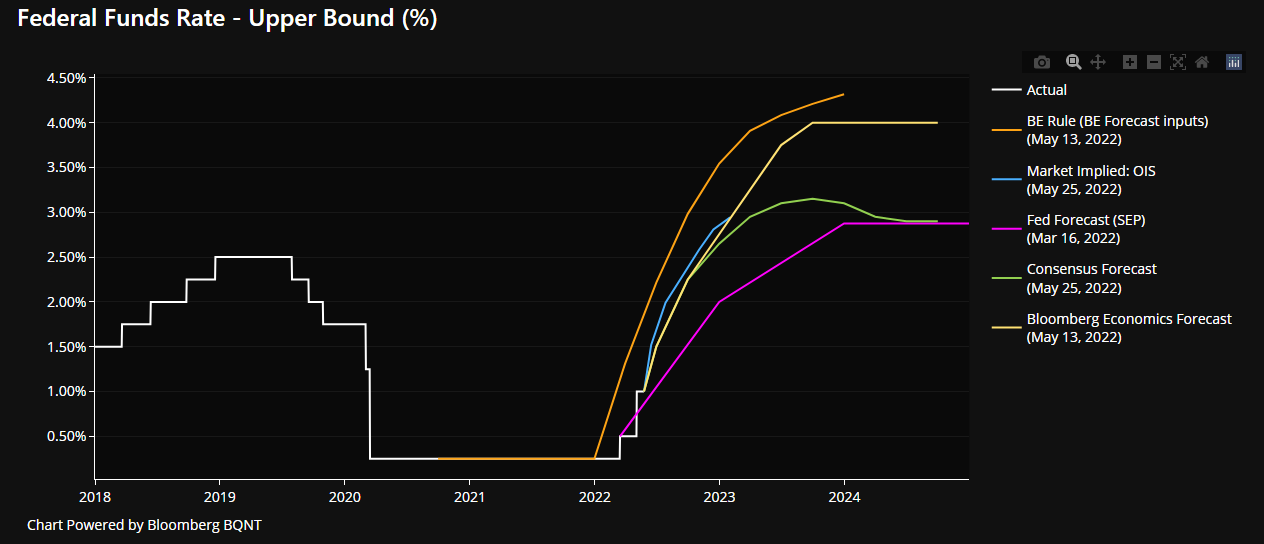
Concluding the fundamental section with remarks from a March 2022 Substack newsletter published by Andreas Steno Larsen of the Stenos Signals Substack.
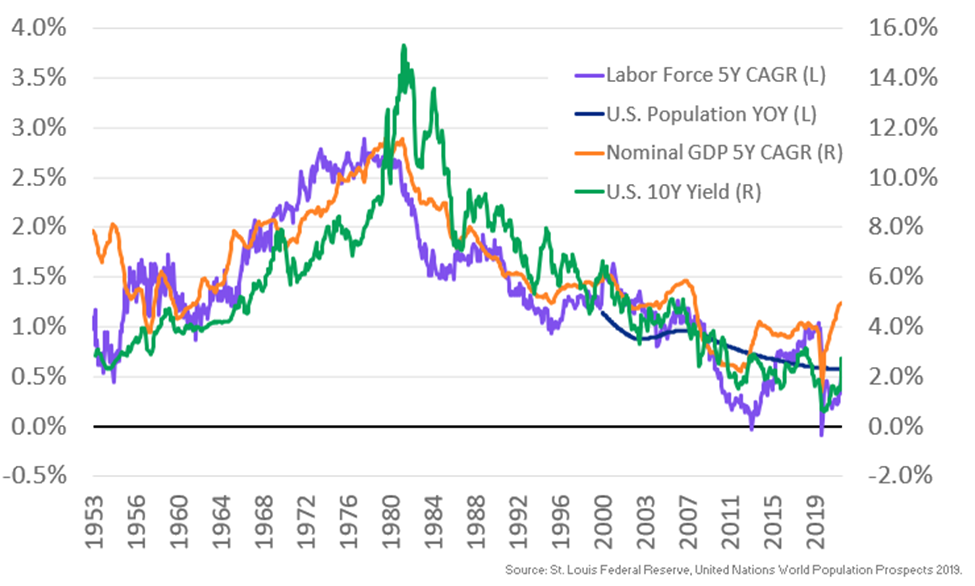
“I simply don’t find >3.5% territory for the Fed Funds feasible as the hiking cycle peaked at 2.25-2.50% in 2018/2019 and fundamentals have worsened since. Debt loads are much higher, demographics have weakened, and the labour force is smaller, which suggests that the neutral rate is lower, not higher, than in 2018/2019.”
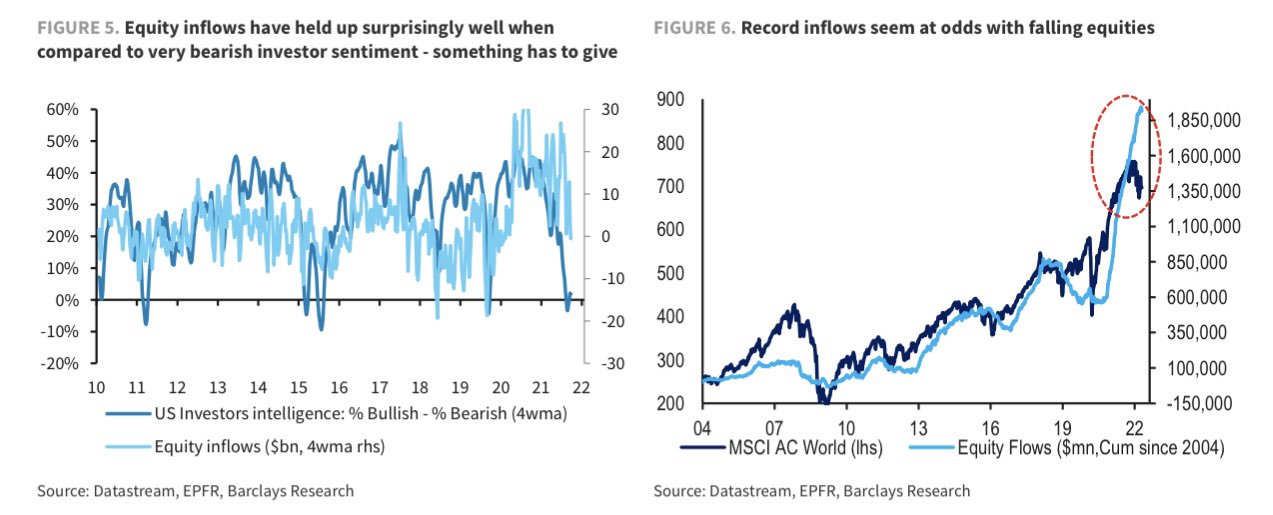
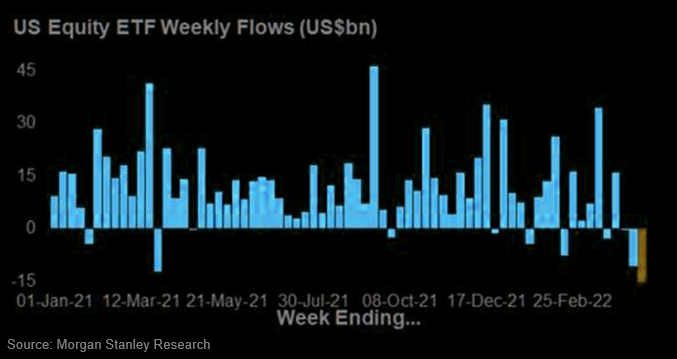
Positioning: Per Bank of America Corporation (NYSE: BAC) notes, investors poured nearly $20 billion into global stocks (in the week to May 25, 2022).
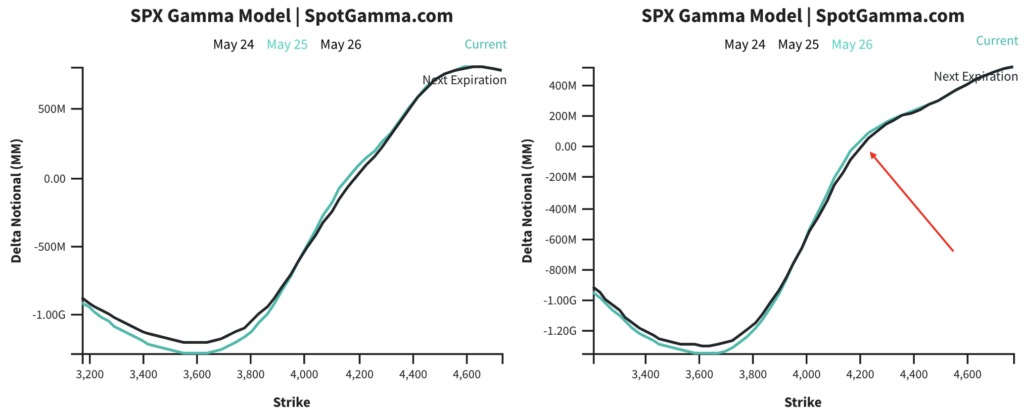
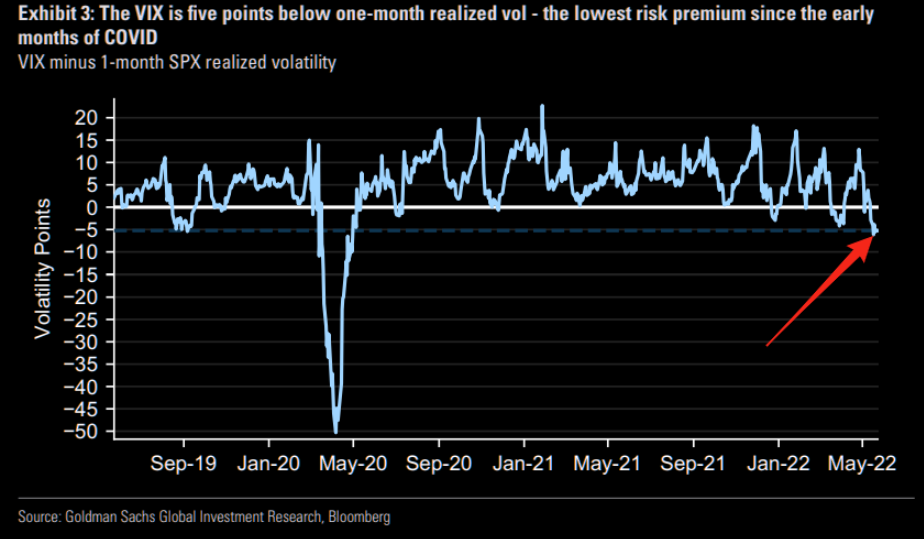
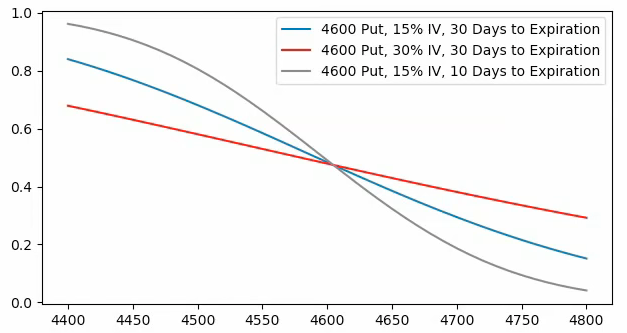
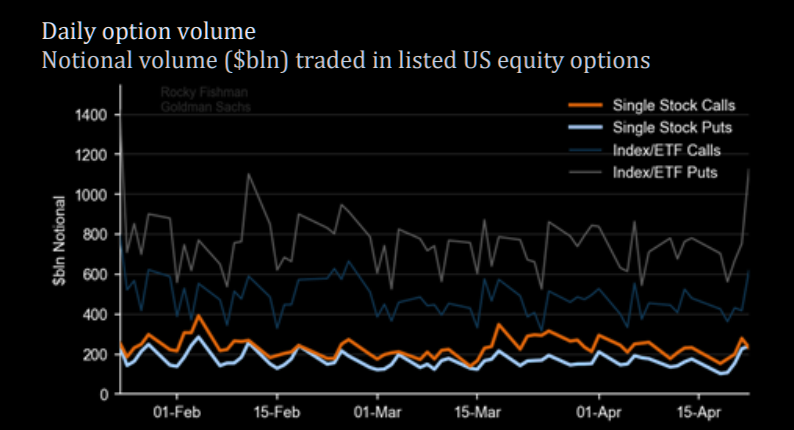
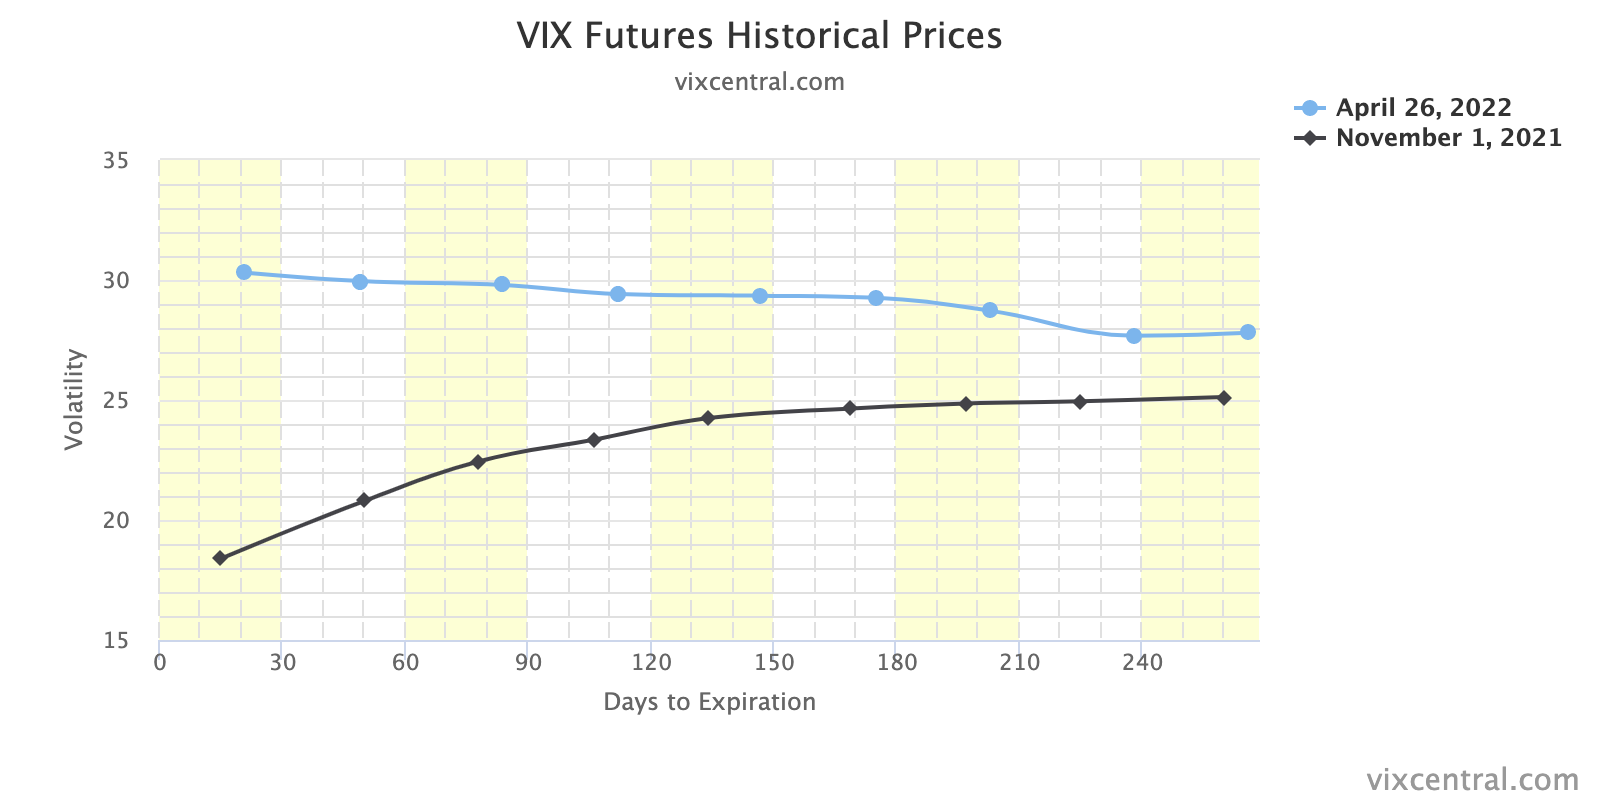
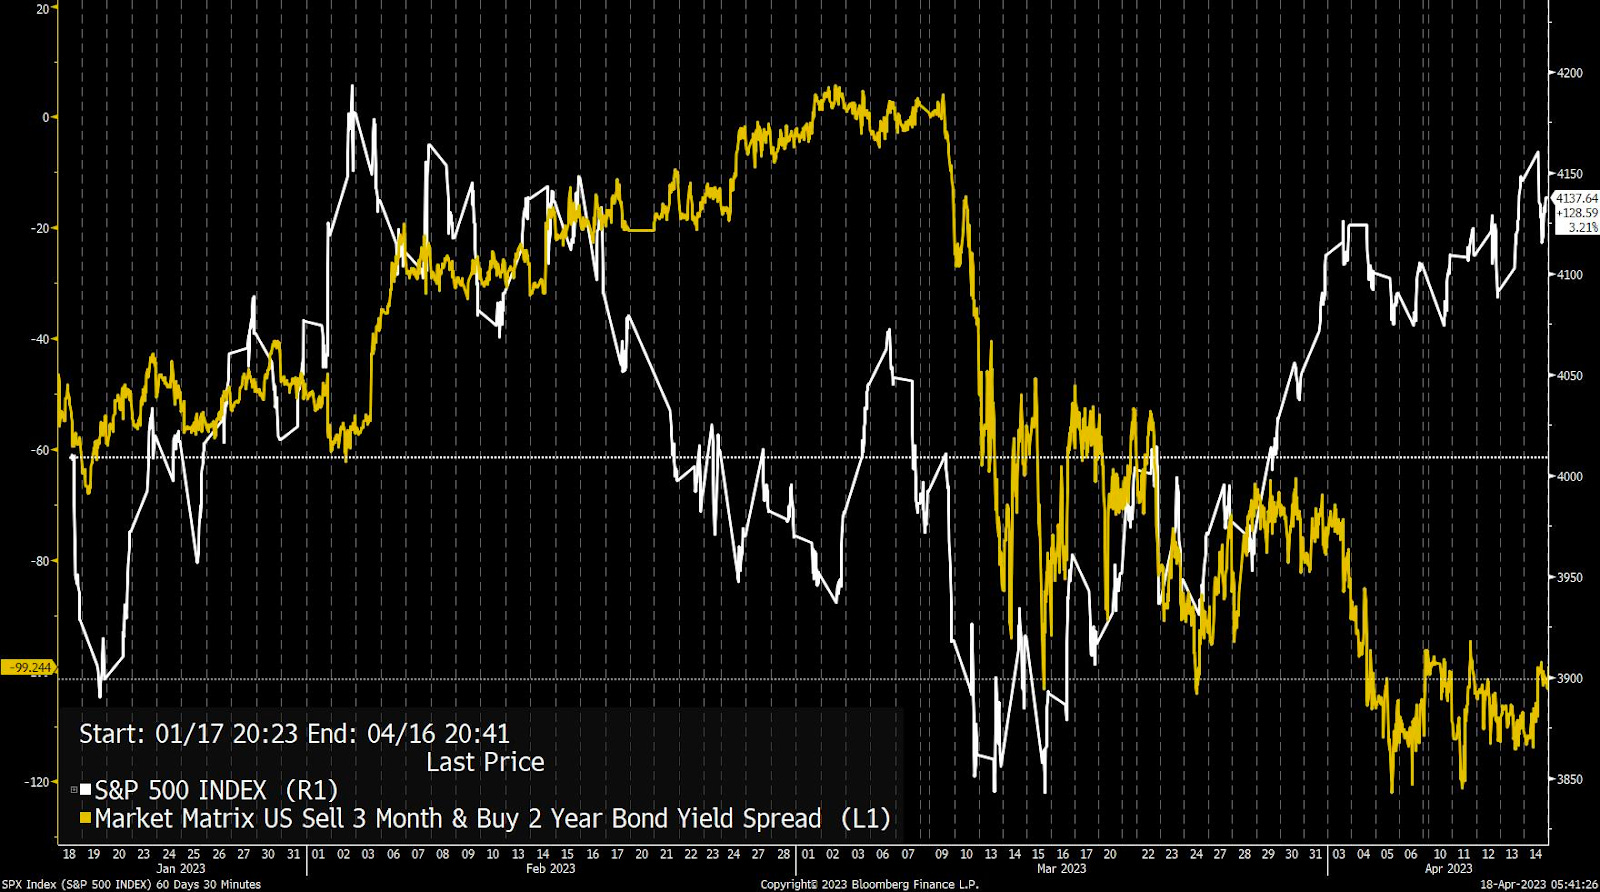
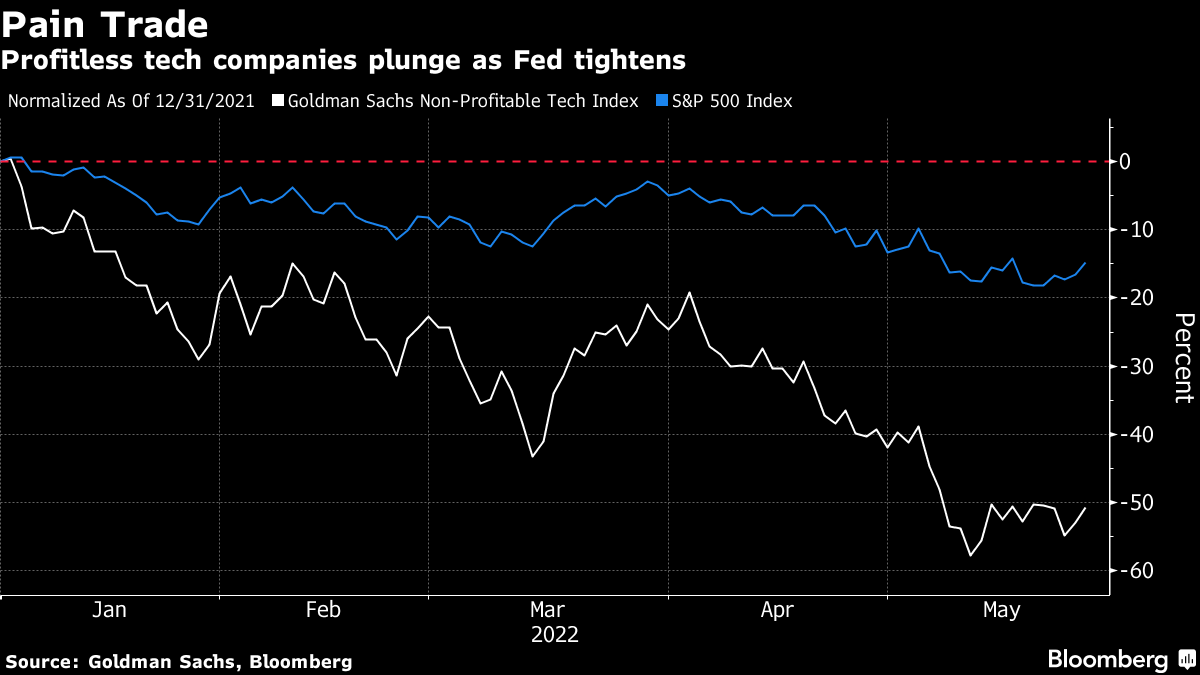
As I wrote in a SpotGamma note, notable was the reversal in beaten-down areas of the market, as well as the implosion at the front-end of the volatility term structure, affecting protection most sensitive to changes in direction and volatility.
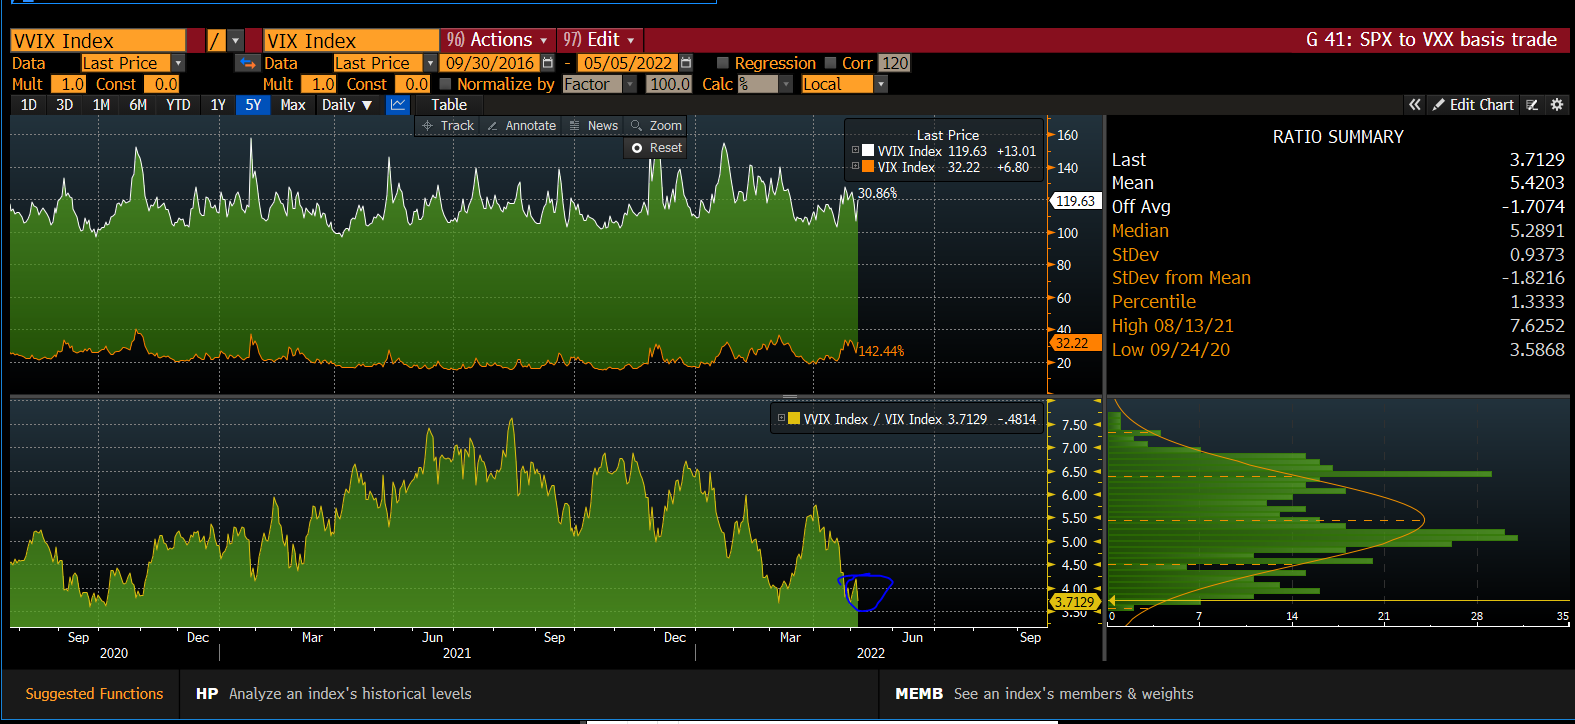
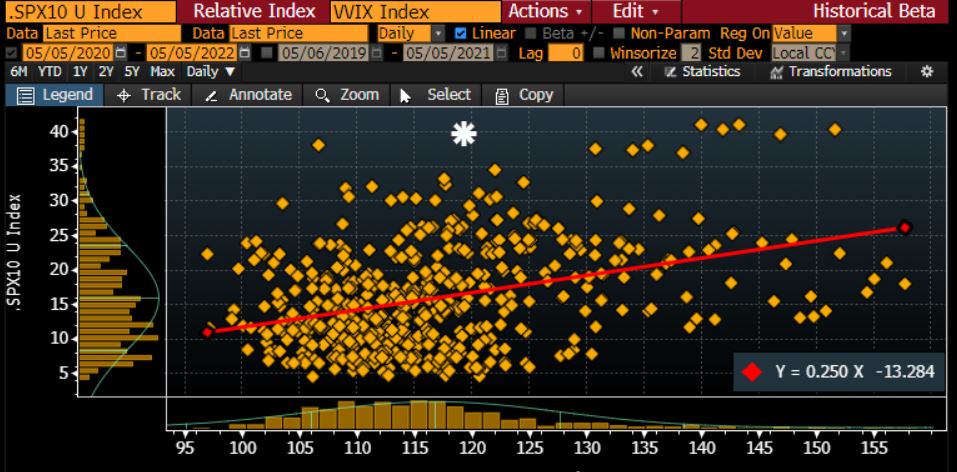
The Cboe VVIX Index (INDEX: VVIX), the expected volatility of the 30-day forward price of the VIX or the volatility of volatility (a naive but useful measure of skew), dropped off markedly, too, in comparison to the VIX, itself.
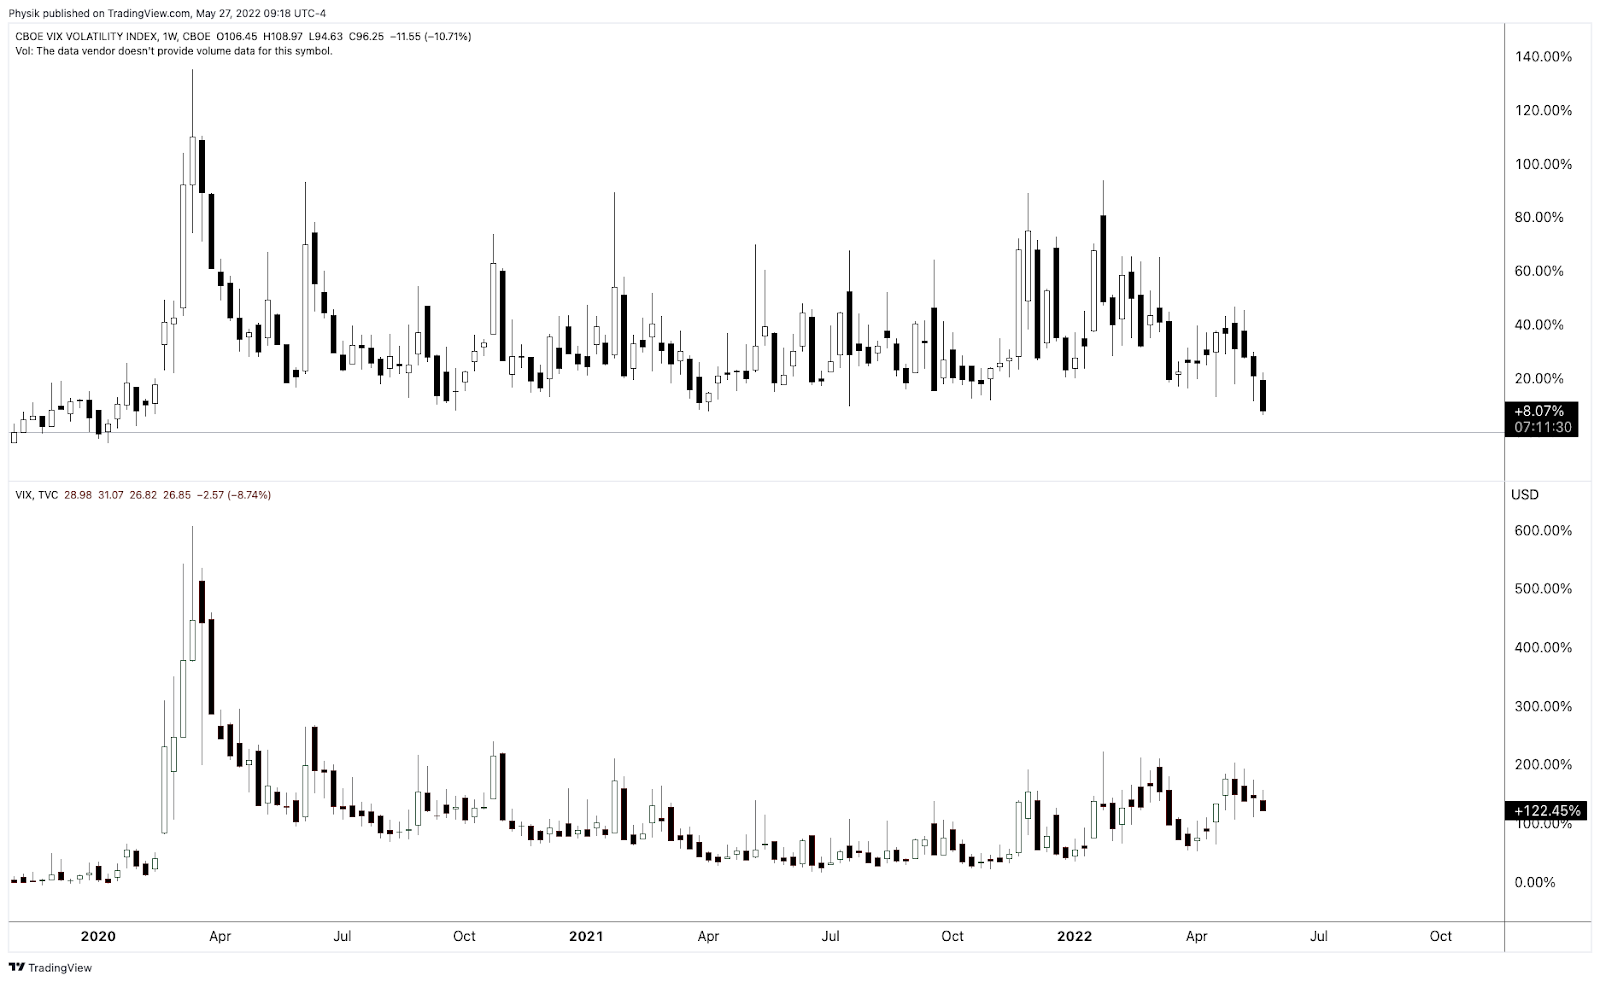
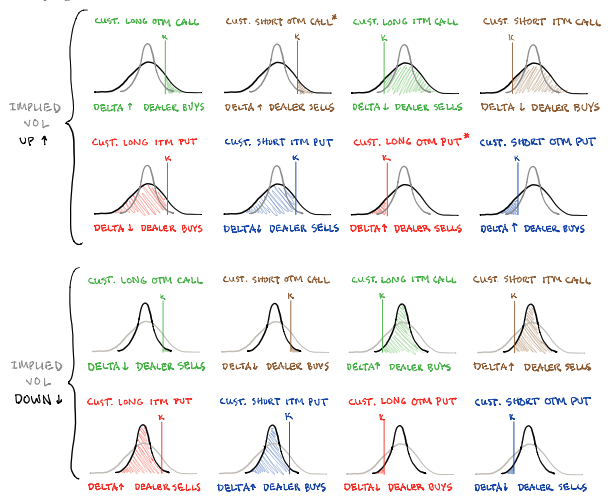
Further, as stated in SpotGamma’s note, a “falling VVIX (and VIX term structure drop off) may be the product of a collapse in the value of customers’ long put exposures concentrated in very short-dated timeframes (potentially exposures hedging tail risks with respect to the release of FOMC minutes, among other things).”
“It is then as the skew, here, decays, and term structure compresses, that liquidity providers buy back their hedges to the puts they are short (i.e., the vanna dynamic pointed to, earlier).”
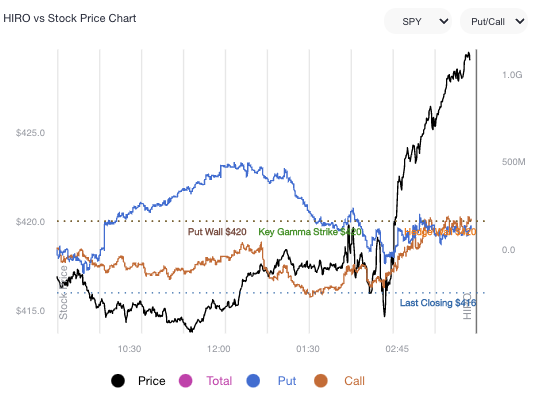
This market-generated information helps us give context to this most recent equity market rally that is characterized by a little change in demand for bets on upside further in price and time
All else equal, this is not a feature of sustainable market rallies.
Why you ask?
Those names that have been most depressed, and are now reversing, were recipients of heavy demand for protection in the months prior.
For this reason – participants being well hedged – selling was orderly, rather than violent as in past episodes of market shock when the reach for protection solicited a cascading reaction that exacerbated underlying price movements due to liquidity providers’ hedging.
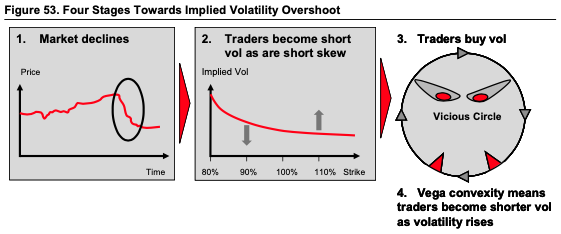
The large drop off in term structure, as well as the VVIX versus the VIX, is affecting protection most sensitive to changes in direction and volatility and the unwind of liquidity providers’ short futures and stock hedges to this protection is, in part, playing into this internally weak rally.
So, what? How do you play this? Good question.
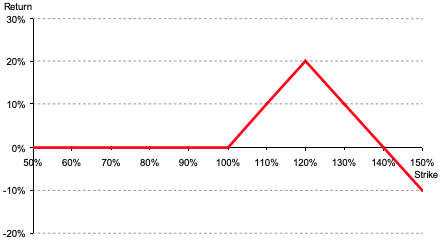
It still may make sense to have exposure to underlying markets, synthetically (i.e., own options), as detailed, well, May 25, 2022. Read that letter for detail on how to think about trade structure.
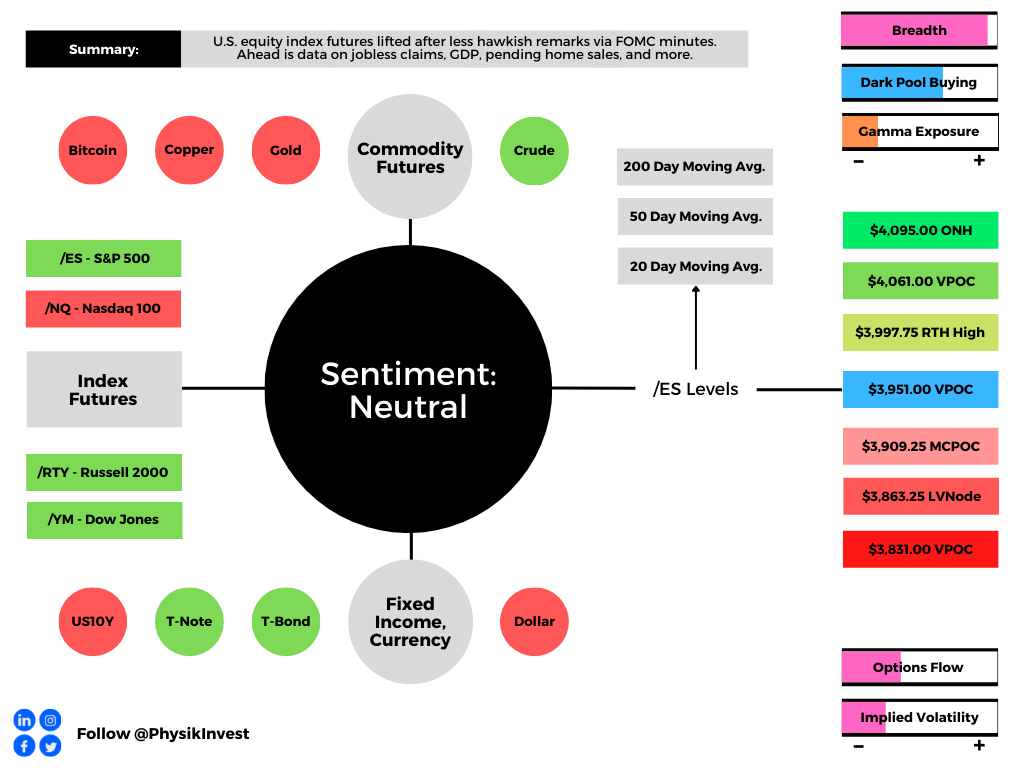
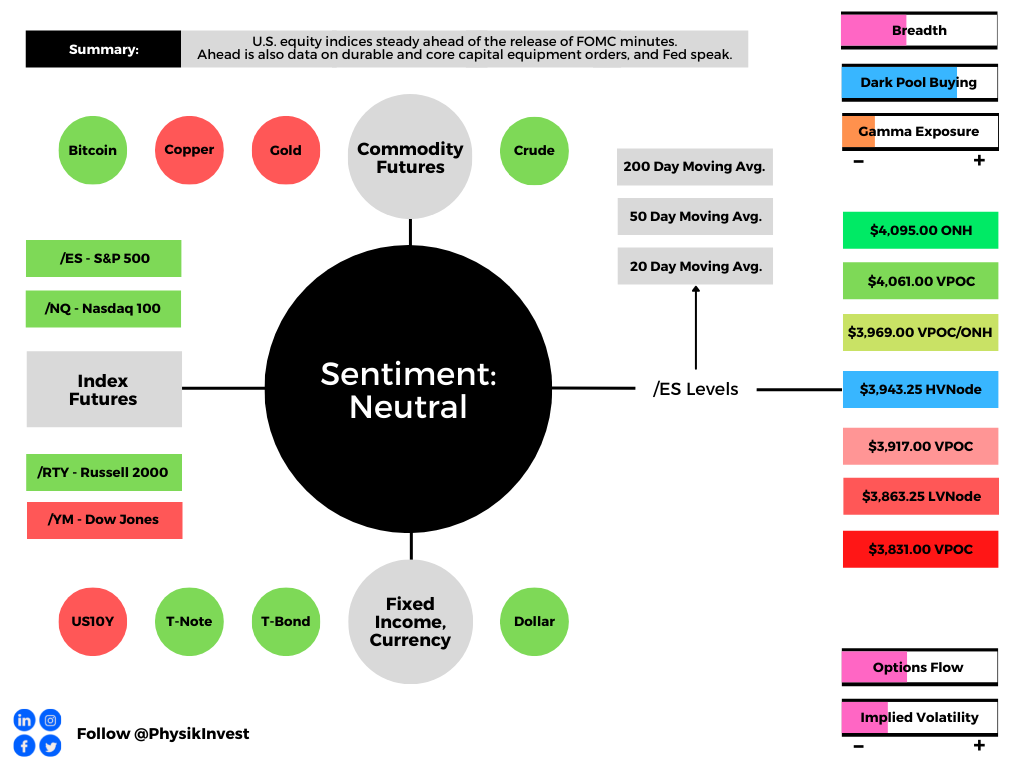
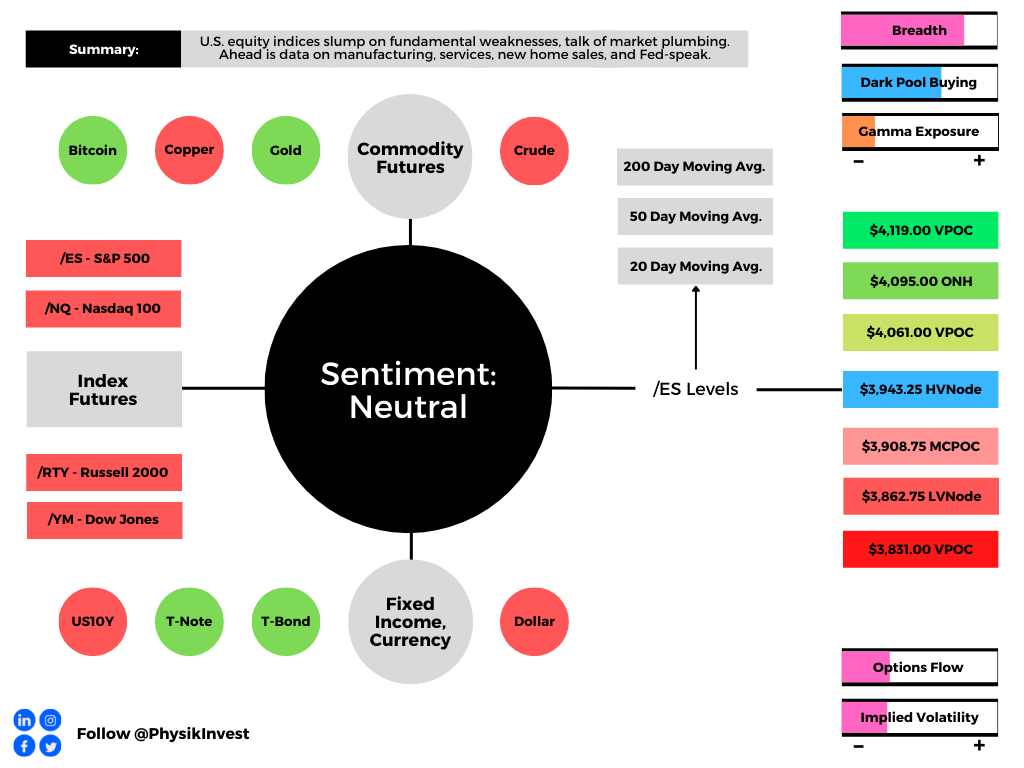
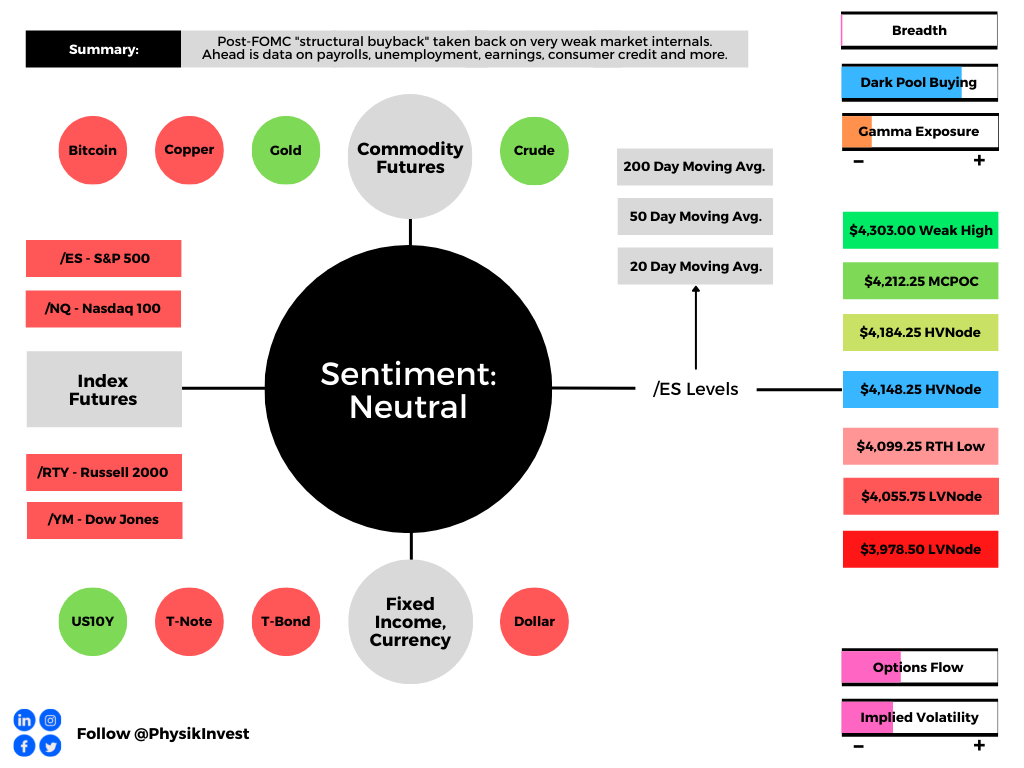
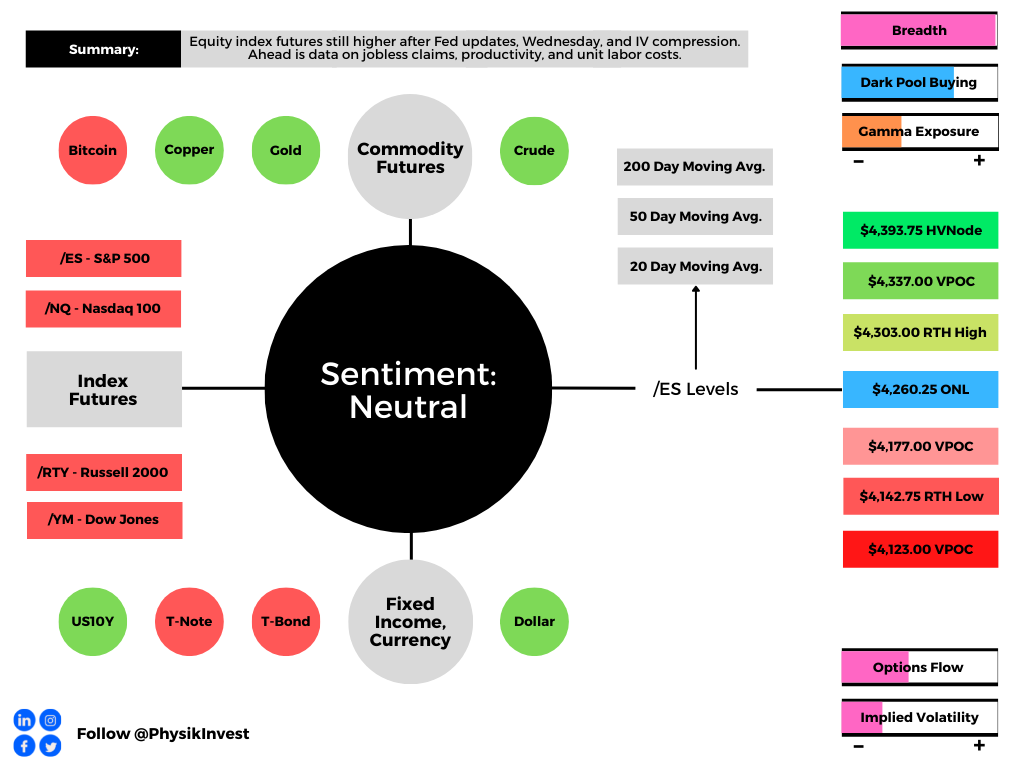
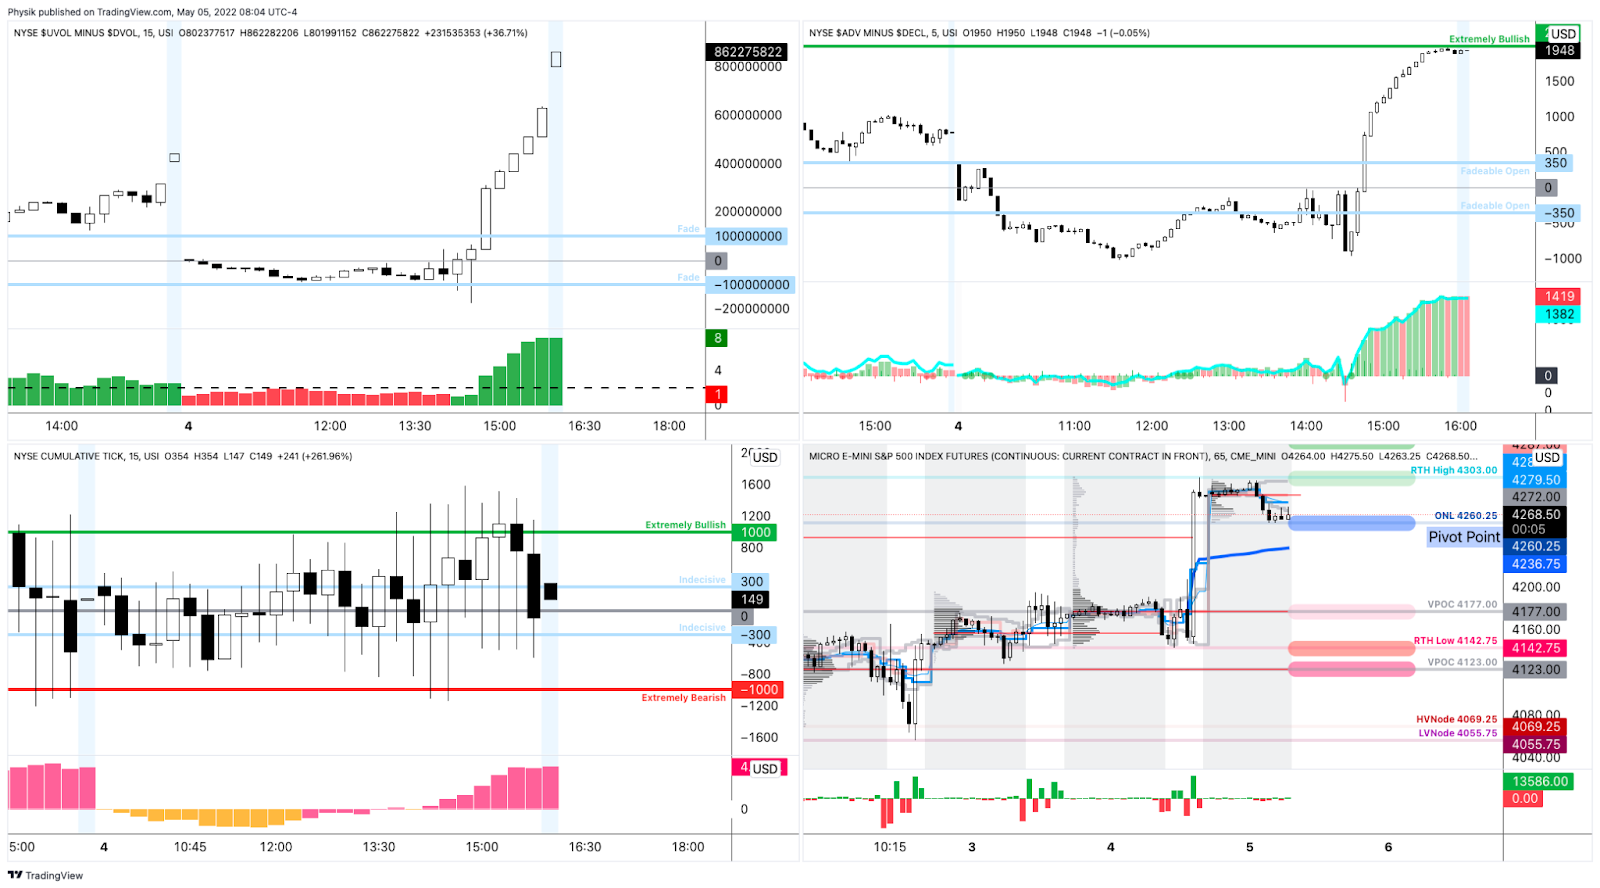
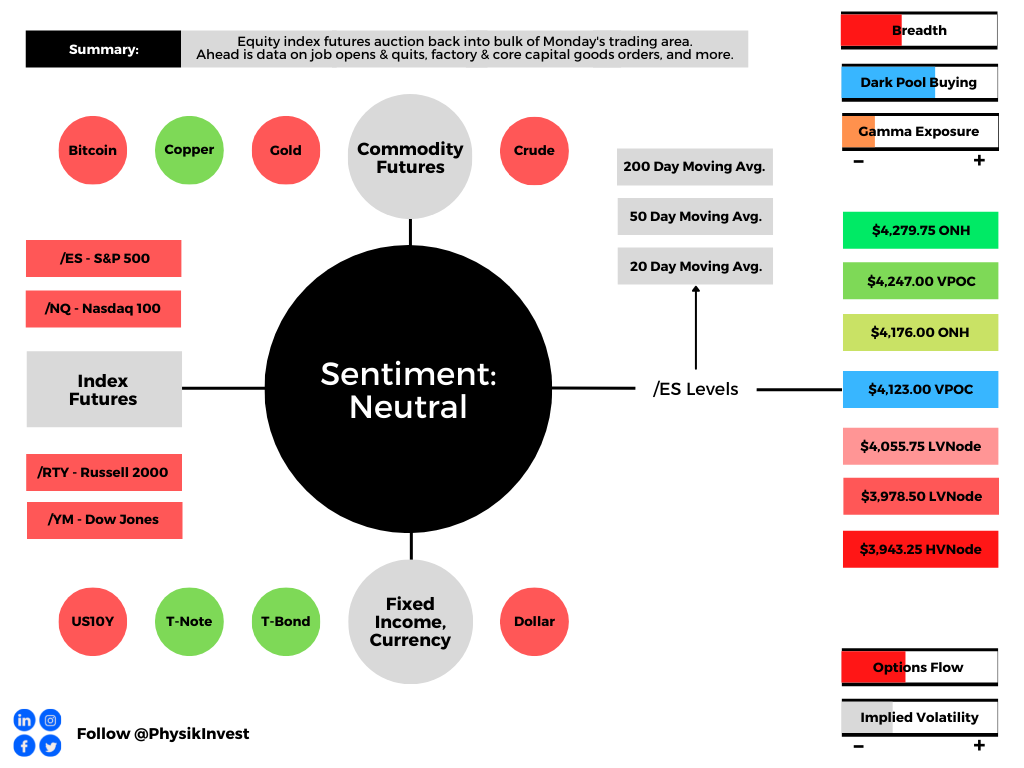
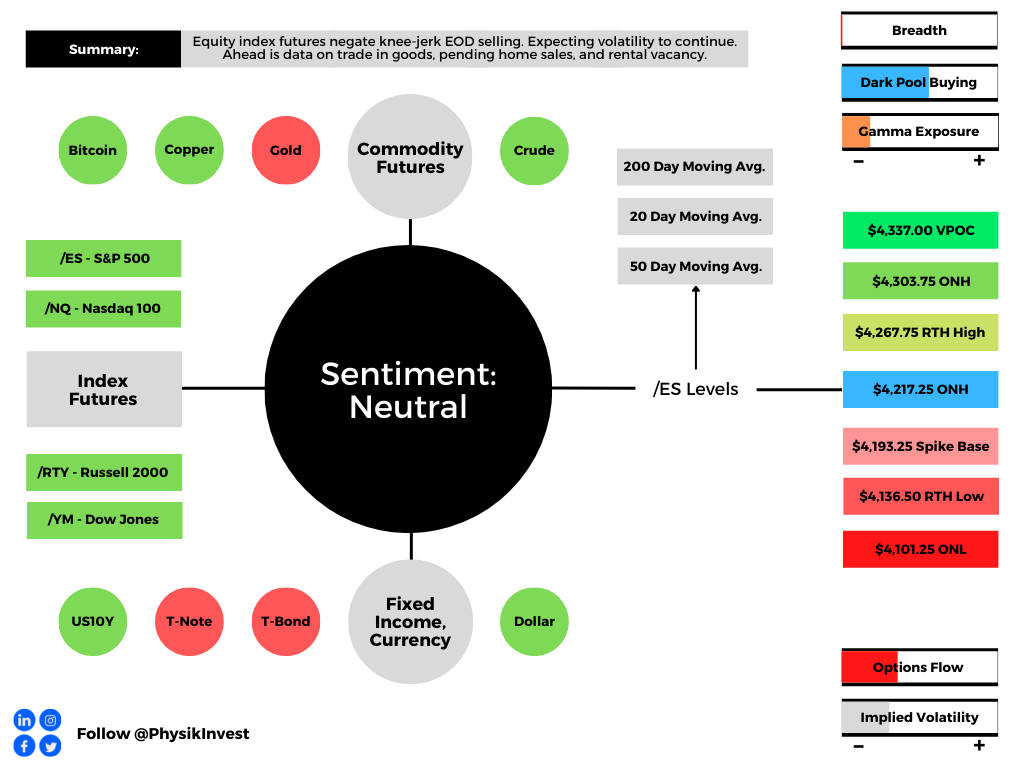
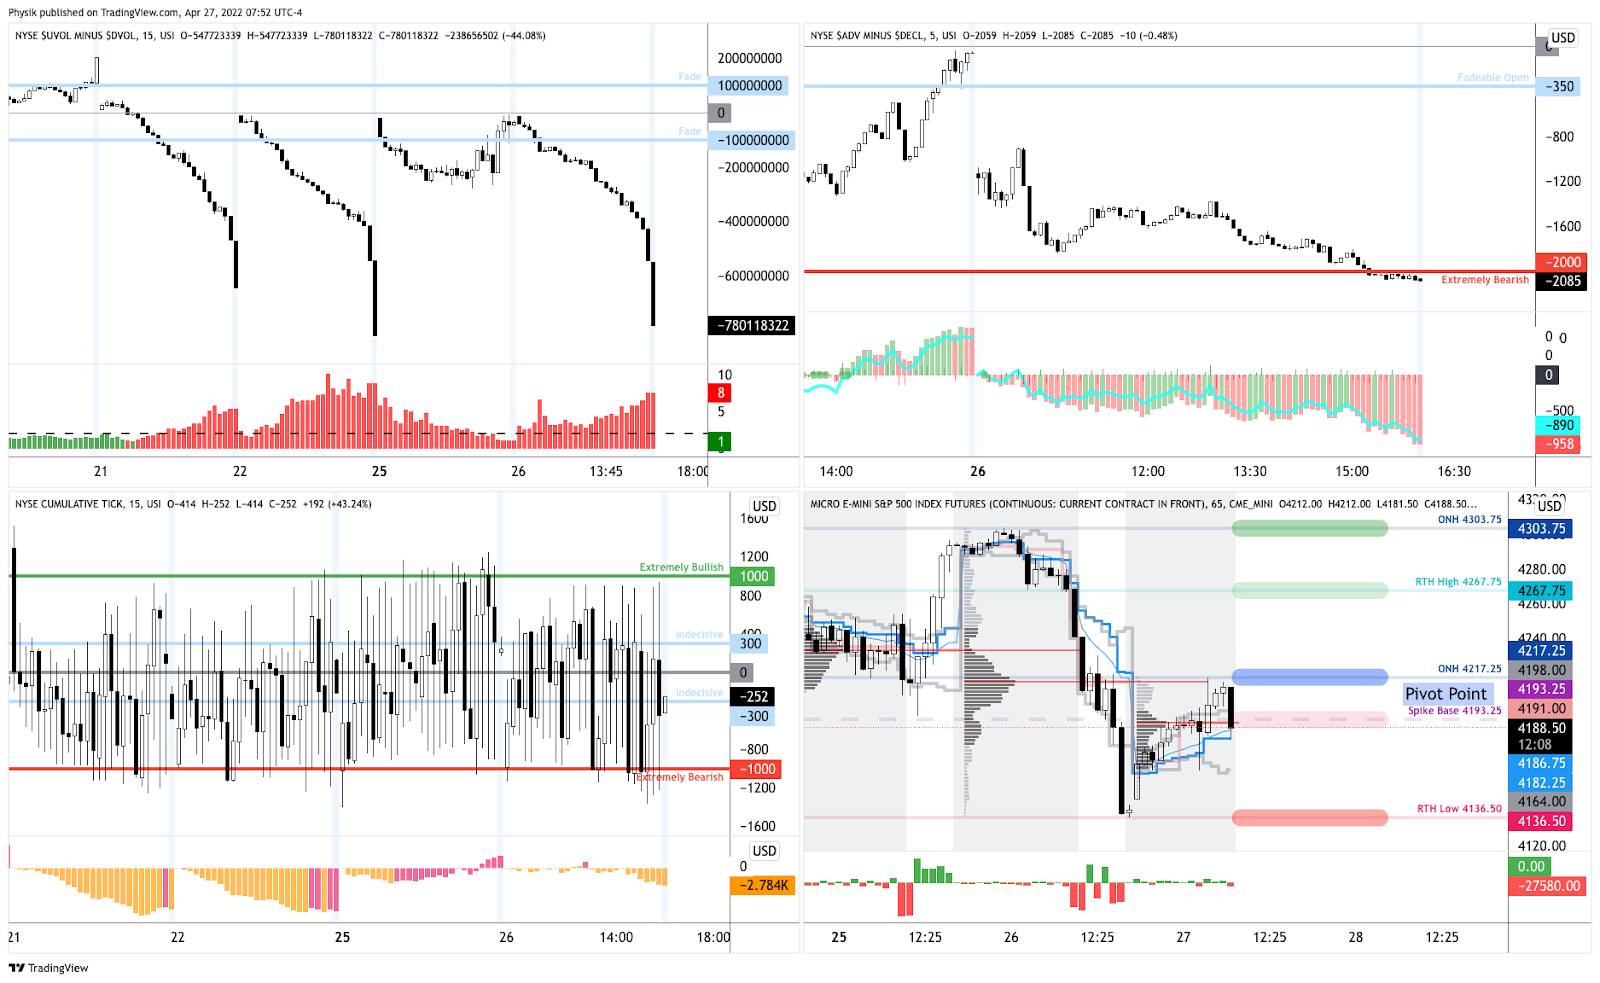
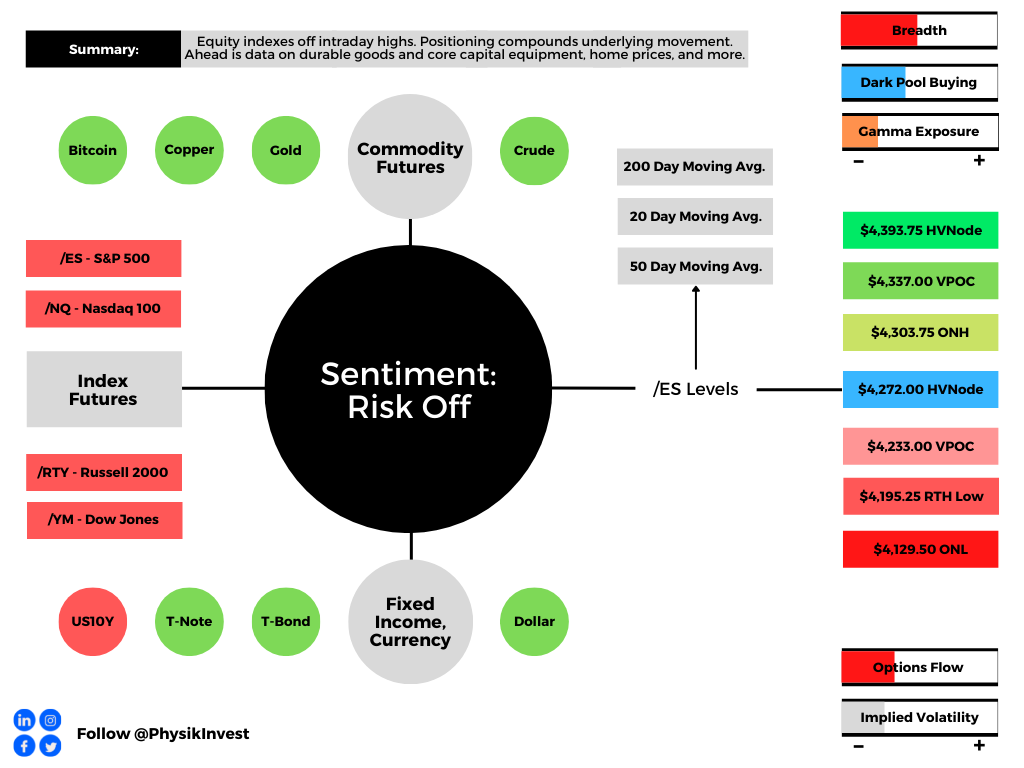
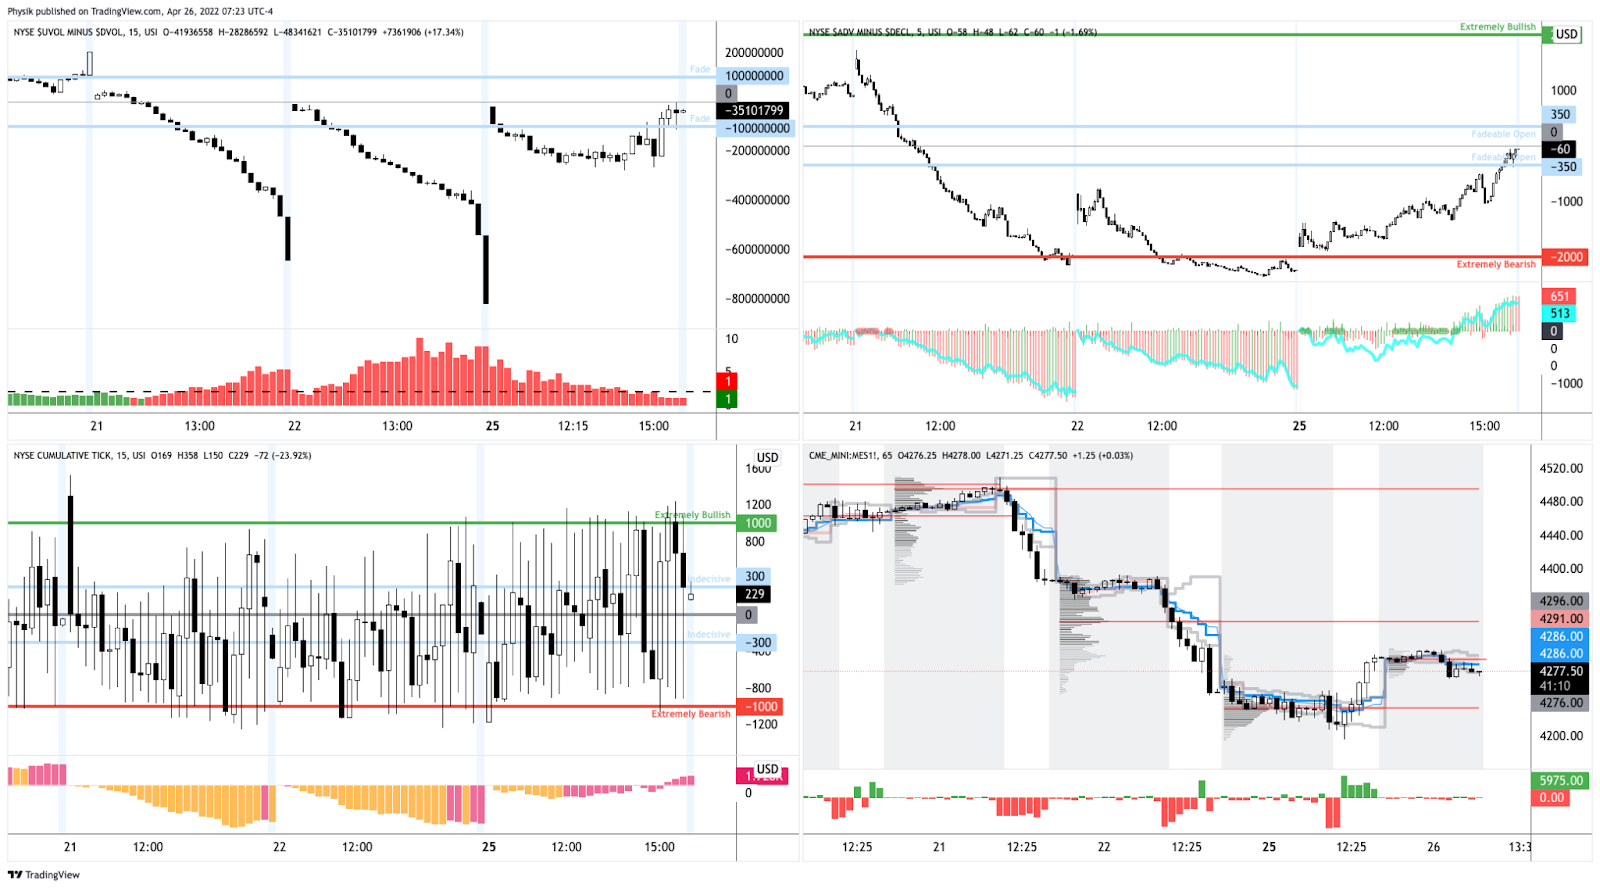
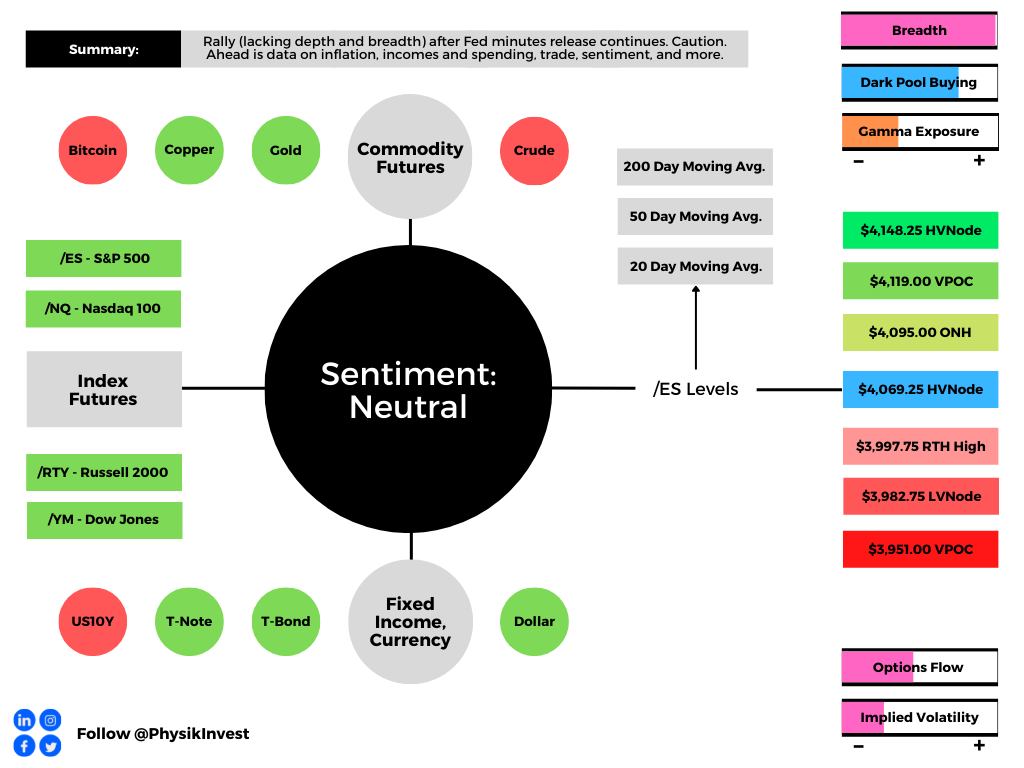
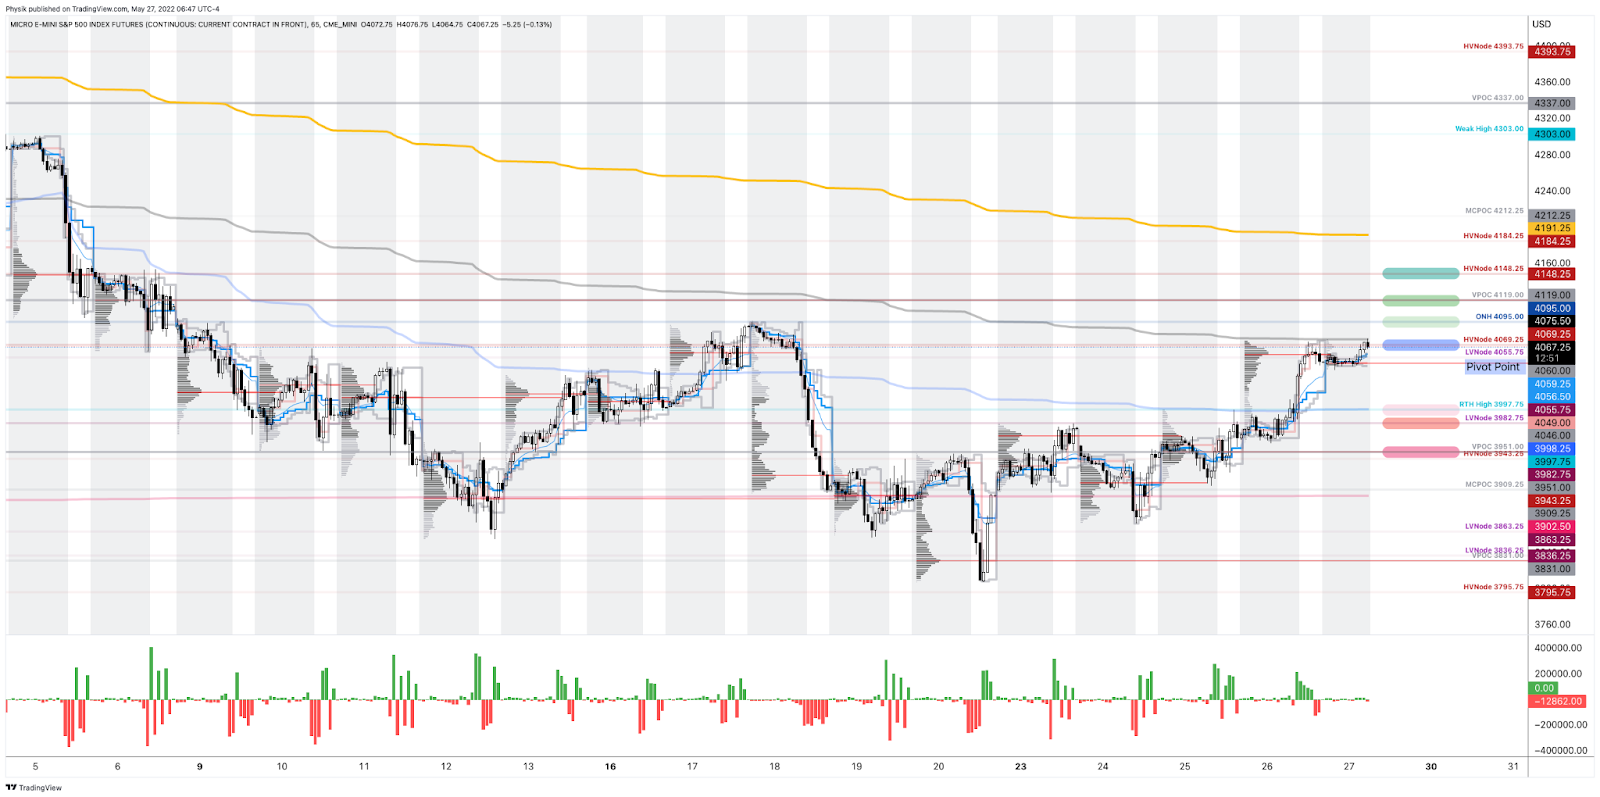
Technical: As of 6:45 AM ET, Friday’s regular session (9:30 AM – 4:00 PM ET), in the S&P 500, will likely open in the upper part of a positively skewed overnight inventory, inside of prior-range and -value, suggesting a limited potential for immediate directional opportunity.
In the best case, the S&P 500 trades higher; activity above the $4,069.25 HVNode puts in play the $4,095.00 ONH. Initiative trade beyond the ONH could reach as high as the $4,119.00 VPOC and $4,148.25 HVNode, or higher.
In the worst case, the S&P 500 trades lower; activity below the $4,069.25 HVNode puts in play the $3,997.75 RTH High. Initiative trade beyond the RTH High could reach as low as the $3,982.75 LVNode and $3,951.00 VPOC, or lower.
Click here to load today’s key levels into the web-based TradingView charting platform. Note that all levels are derived using the 65-minute timeframe. New links are produced, daily.
Definitions
Overnight Highs And Lows (ONH and ONL): Typically, there is a low historical probability associated with overnight rally-highs (lows) ending the upside (downside) discovery process.
Volume Areas: A structurally sound market will build on areas of high volume (HVNodes). Should the market trend for long periods of time, it will lack sound structure, identified as low volume areas (LVNodes). LVNodes denote directional conviction and ought to offer support on any test.
If participants were to auction and find acceptance into areas of prior low volume (LVNodes), then future discovery ought to be volatile and quick as participants look to HVNodes for favorable entry or exit.
POCs: POCs are valuable as they denote areas where two-sided trade was most prevalent in a prior day session. Participants will respond to future tests of value as they offer favorable entry and exit.
MCPOCs: POCs are valuable as they denote areas where two-sided trade was most prevalent over numerous day sessions. Participants will respond to future tests of value as they offer favorable entry and exit.
About
After years of self-education, strategy development, mentorship, and trial-and-error, Renato Leonard Capelj began trading full-time and founded Physik Invest to detail his methods, research, and performance in the markets.
Capelj also develops insights around impactful options market dynamics at SpotGamma and is a Benzinga reporter.
Some of his works include conversations with ARK Invest’s Catherine Wood, investors Kevin O’Leary and John Chambers, FTX’s Sam Bankman-Fried, Kai Volatility’s Cem Karsan, The Ambrus Group’s Kris Sidial, among many others.
Disclaimer
In no way should the materials herein be construed as advice. Derivatives carry a substantial risk of loss. All content is for informational purposes only.