Physik Invest’s Daily Brief is read by over 1,200 people. To join this community and learn about the fundamental and technical drivers of markets, subscribe below.
Positioning
Aksel Kibar of Tech Charts said it well: There are two types of trades.
“1) Trades that you take moving from low volatility to high volatility [and] 2) trades that you take in high volatility while moving to low volatility.”
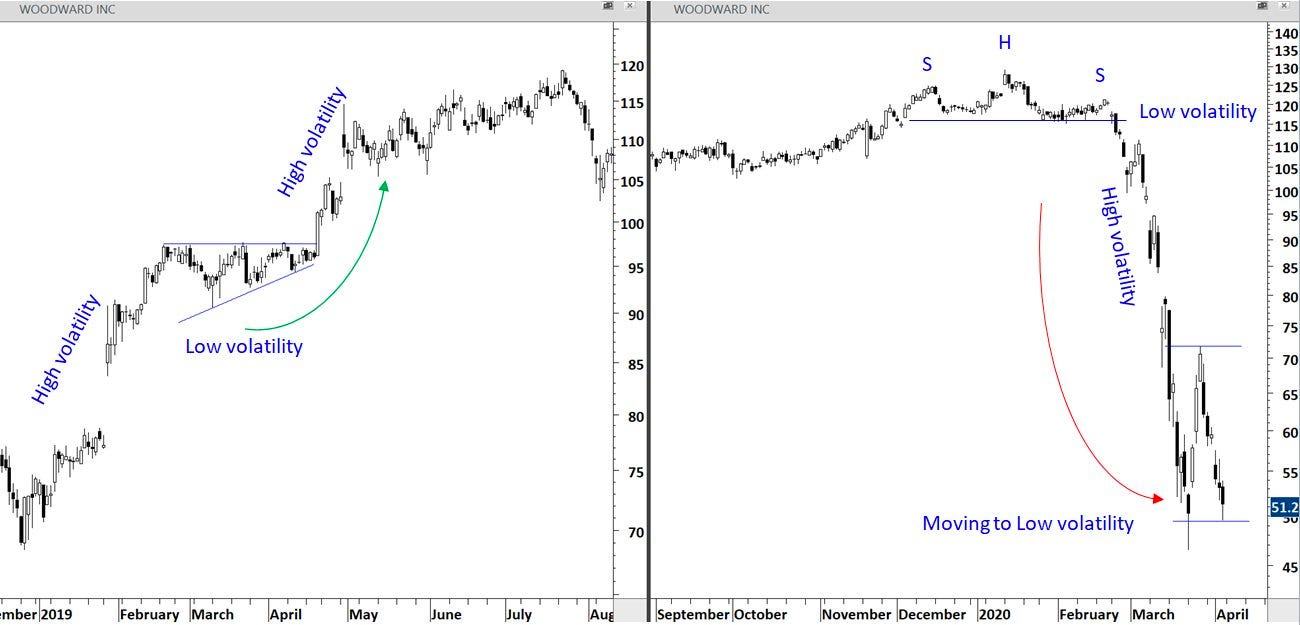
Like Kibar, we aim to be well-positioned for a move from low to high volatility. In short, that is where we are today. After an expansion of range to the upside, markets are trading sideways, in a tight range, and traders’ recent activities are likely to keep the status quo intact a bit longer.
Notwithstanding, we are likely nearing an expansion of realized volatility (RVOL), per the implied volatility (IVOL) bid; on Monday, some IVOL measures, such as the Cboe Volatility Index (INDEX: VIX), shifted up, as did term structure. Markets sold a bit, too.
Quick aside:
Changes in IVOL are a byproduct of supply and demand (i.e., demand rushes in → IVOL rises → option prices adjust higher).
When protection is demanded by investors, counterparties may pressure markets (a naive take, if we will, for the purpose of breaking things down).
To explain further, say the market is in balance and trading sideways, and traders seek to protect against potential downside movement by purchasing put options.
This new demand will bid put options prices, causing counterparties to hedge in a manner that pressures the market (i.e., a trader buys put and bids IVOL → the counterparty sells that put and futures to hedge that put), as we’re seeing (i.e., IVOL higher and market lower ahead of updates to measures like the Personal Consumption Expenditures [INDEX: PCE], the Fed’s go-to inflation reading).
Back to the letter:
Upon some new information, participants will enter and reprice the market.
Counterparties’ re-hedging could add to the movement up or down (e.g., traders sell their put hedges → IVOL compresses → counterparties buy back futures hedges and support the market).
If you’re betting on lower prices, recommended is a quick reference of Physik Invest’s Daily Brief for November 28, 2022. In short, according to SpotGamma, “there’s less to be lost owning protection down below,” given the performance of skew, relative to topline measures such as the Cboe Volatility Index (INDEX: VIX).
“On the contrary, if you buy [protection] and nothing happens, that [protection] may very well hold its value better than in the past.”
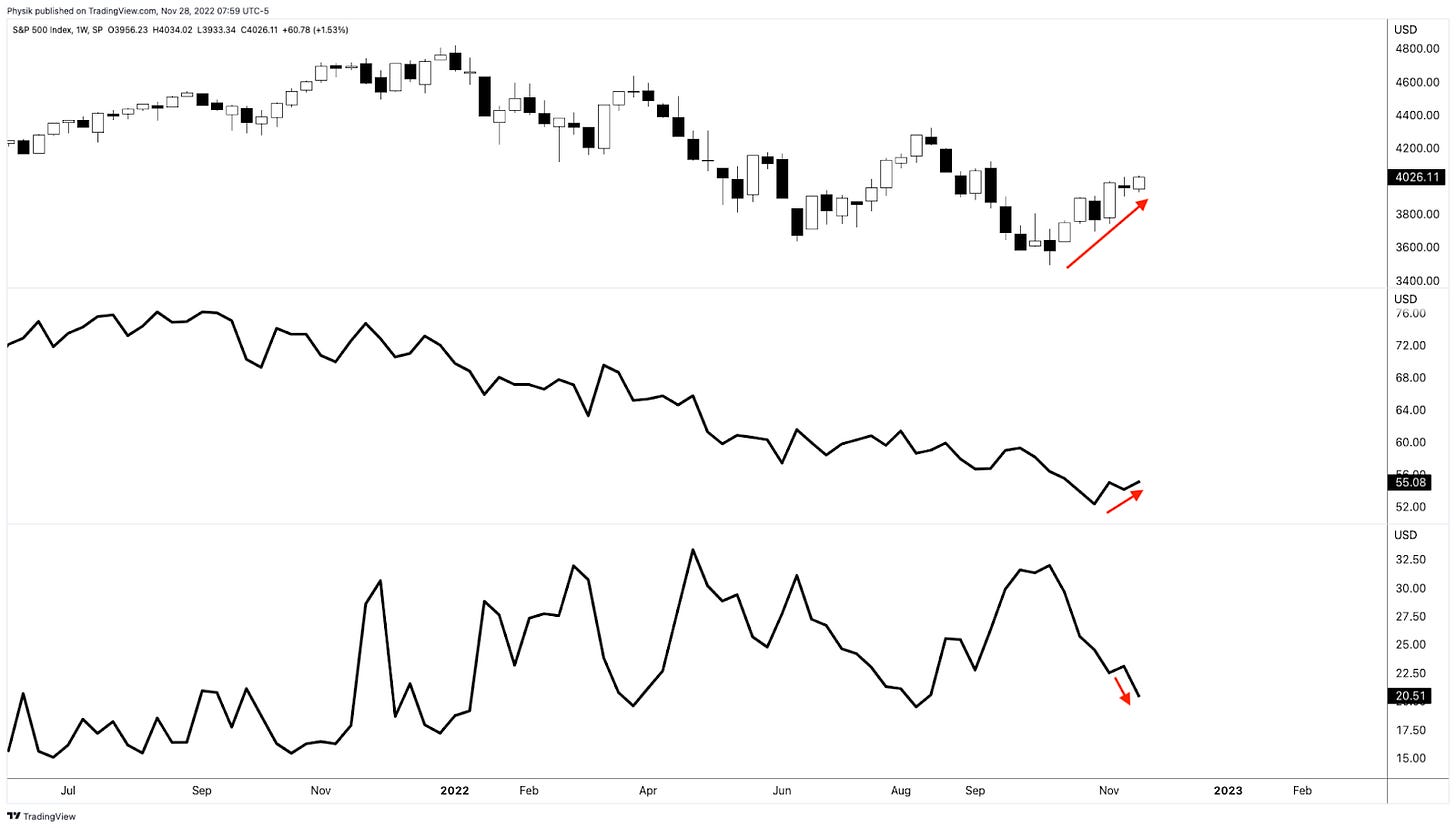
On the call side, the story is similar; selling volatility blindly is not a good trade.
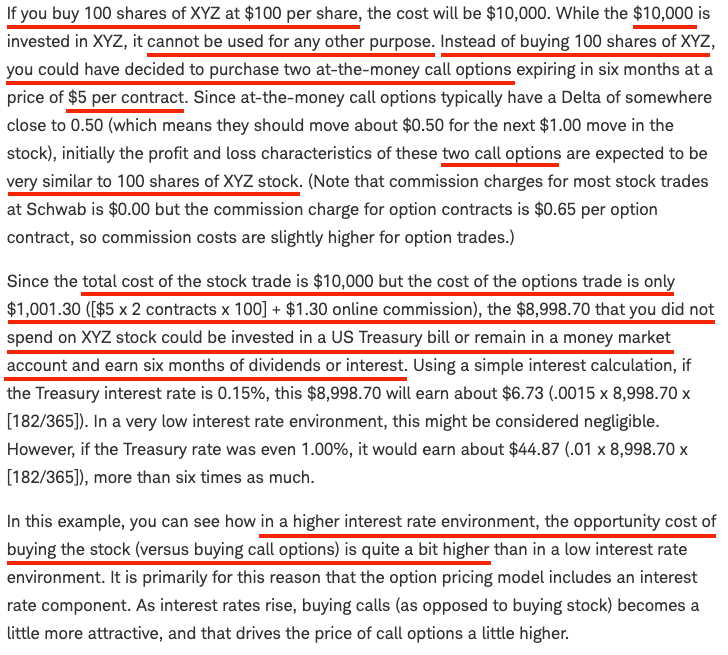
To explain, incentive schemes drove “people to be much more willing to pay and chase upside,” and this is, in part, evidenced by historically low skew. There is also stock replacement, among other things, due to the opportunity cost of buying stock being higher in the current interest rate environment (i.e., “higher call options premium when interest rates are high is the ‘opportunity cost’ of forgone interest”).
In the interest of brevity, this environment has resulted in a smile-shaped volatility skew pattern, rather than the typical smirk-shaped reverse volatility skew pattern.
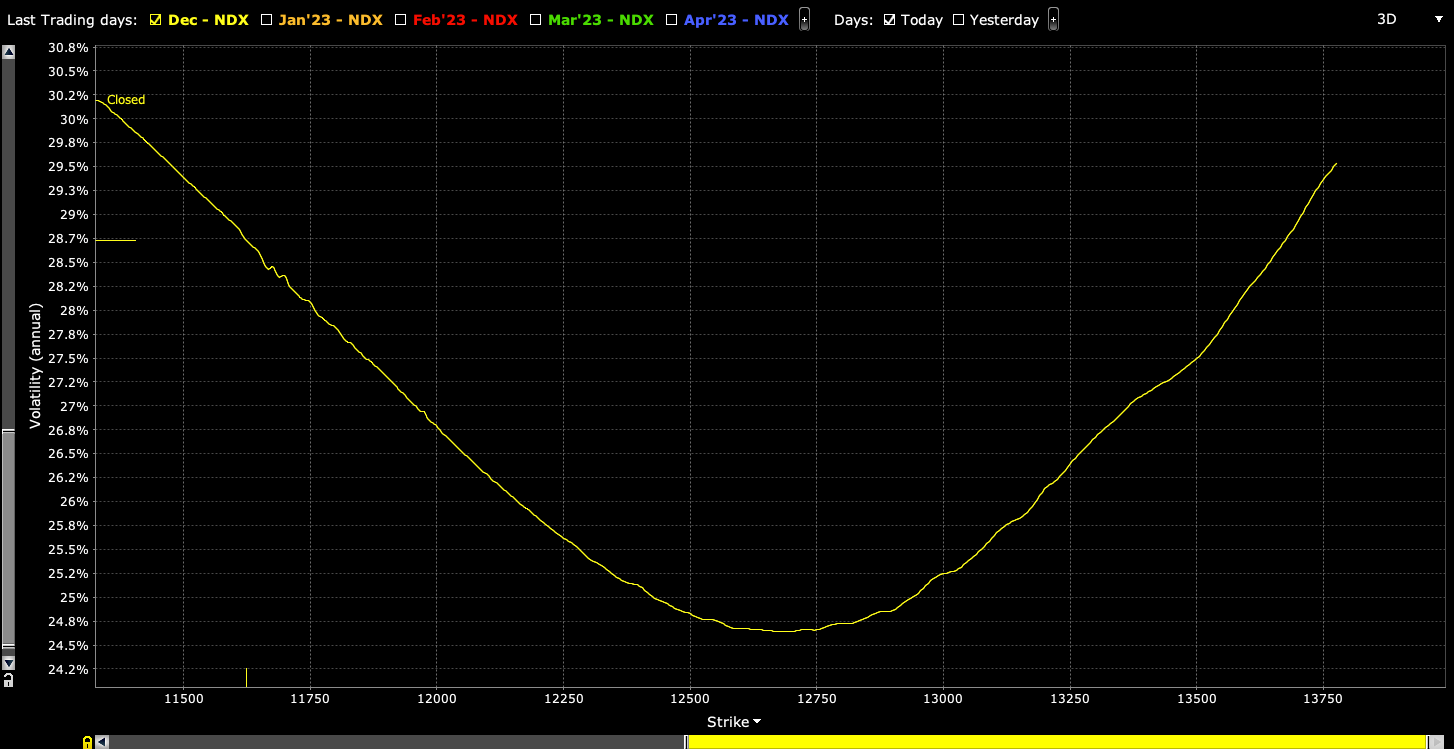
Skew has steepened on the call side – a result of traders positioning for an upside move – and we can use the richness of out-of-the-money calls to reduce the cost of our bets on the market upside.
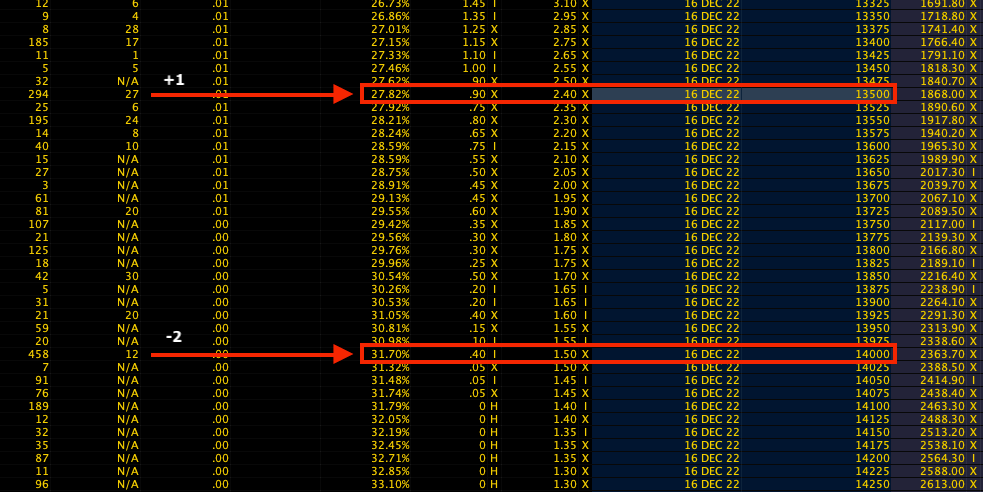
For instance, low-cost 500-1000 points wide call ratio spreads (buy the closer leg, sell two of the farther legs) expiring in fifteen days may work well.
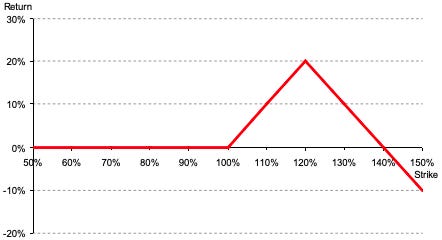
A concern with these strategies is the width and time to expiry. Should either of those be wrong, then spreads initially positive gamma turn negative, meaning upside market movement hurts the position and losses are amplified.
Technical
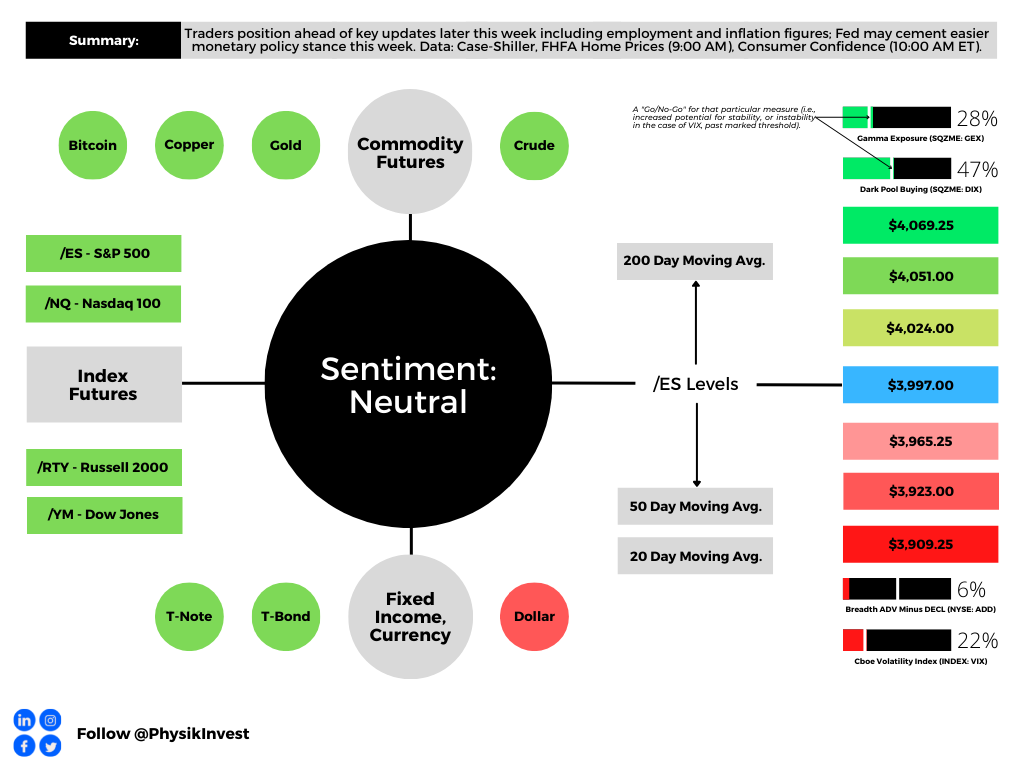
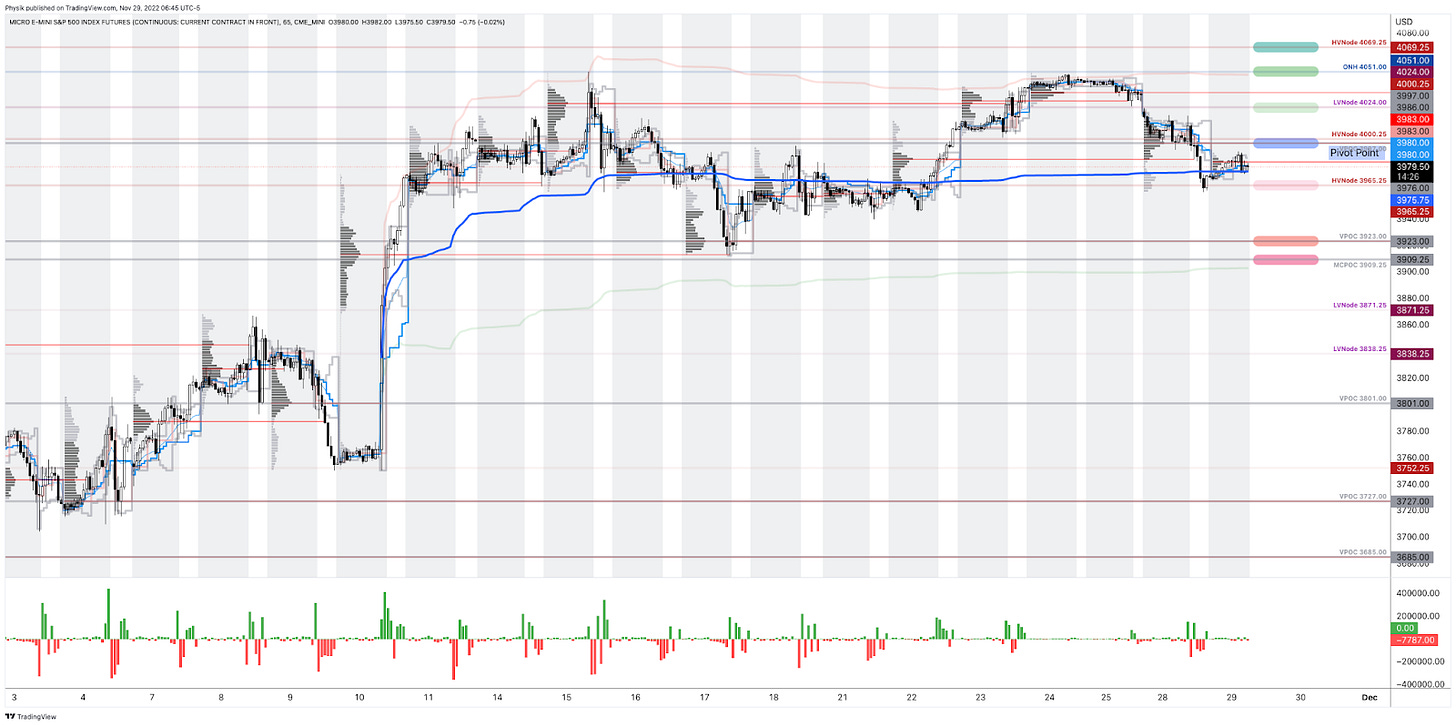
As of 6:45 AM ET, Tuesday’s regular session (9:30 AM – 4:00 PM ET), in the S&P 500, is likely to open in the middle part of a positively skewed overnight inventory, inside of prior-range and -value, suggesting a limited potential for immediate directional opportunity.
Our S&P 500 pivot for today is $4,997.00.
Key levels to the upside include $4,024.00, $4,051.00, and $4,069.25.
Key levels to the downside include $3,965.25, $3,923.00, and $3,909.25.
Click here to load today’s key levels into the web-based TradingView platform. All levels are derived using the 65-minute timeframe. New links are produced, daily.
About
After years of self-education, strategy development, mentorship, and trial-and-error, Renato Leonard Capelj began trading full-time and founded Physik Invest to detail his methods, research, and performance in the markets.
Capelj also writes options market analyses at SpotGamma and is a Benzinga journalist.
His past works include private discussions with ARK Invest’s Catherine Wood, investors Kevin O’Leary and John Chambers, the infamous Sam Bankman-Fried of FTX, former Bridgewater Associate Andy Constan, Kai Volatility’s Cem Karsan, The Ambrus Group’s Kris Sidial, the Lithuanian Delegation’s Aušrinė Armonaitė, among many others.
Contact
Direct queries to renato@physikinvest.com or Renato Capelj#8625 on Discord.
Disclaimer
Do not construe this newsletter as advice. All content is for informational purposes.


2 replies on “Daily Brief For November 29, 2022”
[…] we said earlier this week (November 29, 2022, and November 28, 2022), it’s not a terrible time to hedge, and selling volatility, blindly, on […]
[…] check out the Daily Brief for November 29 and 30, as well as […]