
The daily brief is a free glimpse into the prevailing fundamental and technical drivers of U.S. equity market products. Join the 600+ that read this report daily, below!
Fundamental
We shall unpack details from the Federal Open Market Committee (FOMC) event in the coming sessions, stay tuned.
Positioning
As of 6:40 AM ET, Wednesday’s expected volatility, via the Cboe Volatility Index (INDEX: VIX), sits at ~1.27%. Net gamma exposures lightly decreasing may promote larger trading ranges.

Should fears with respect to the Federal Open Market Committee (FOMC) announcement be assuaged, then compression in volatility may do more to support current equity price levels.

Notwithstanding, let’s unpack some trends and how they may feed into a volatility “untethering.”
In the Daily Brief for March 31, 2022, we discussed participants’ aversion to selling short-term variance. This, which did more to assuage our fear of crash risk, as well explained in the Daily Brief for March 30, 2022, was, in part, the result of COVID-era volatility that forced participants, out on the risk curve, to deleverage en masse.
As stated in March, per Banco Santander SA’s (NYSE: SAN) research, the “supply of volatility remains very subdued in a trend that has continued since the pandemic.”
“We did observe some activity in 4Q21 and 1Q this year, but almost all of that was unwinding of existing positions from earlier, and these were not new trades.”

However, despite all of the “uncertainty from geopolitics and central banks,” we still saw broad equity implied volatility (IVOL) measures subdued, relative to those in rates and FX.

Let’s unpack that muted response, further.
Well, as explained in the Daily Brief for July 21, 2022, heading into the 2022 decline, institutions repositioned and hedged, even allocating to “commodity trend following,” per our Daily Brief for July 15, 2022, which worked well the first two quarters.
The monetization and counterparty hedging of existing customer hedges, as well as the sale of short-dated volatility, particularly in some of the single names where there was “rich” volatility, into the fall, lent to lackluster performance in implied volatility and index mean reversion.

This trend is set to come to an end as entities are squeezed out of trades that aren’t working (i.e., participants rotate out of volatility and commodities).

Per Kai Volatility’s Cem Karsan, as “volatility itself, on the equity side, becomes less and less hedged on the customer level, … [the] market can really begin to respond to the core macro factors.”
Should markets experience a shock, or trade substantially lower, the demand for hedges may result in an “untethering” in implied volatility, which was “one of the most supportive things into the decline,” Karsan said, adding that now is the best time to rotate into call options which are outperforming “their delta to the upside.”

Accordingly, given the macro risk, IVOL is likely at a lower bound and, per The Ambrus Group’s Kris Sidial, “if you wanted to go out and hedge, the opportunity is still there in the equity space.”
Technical
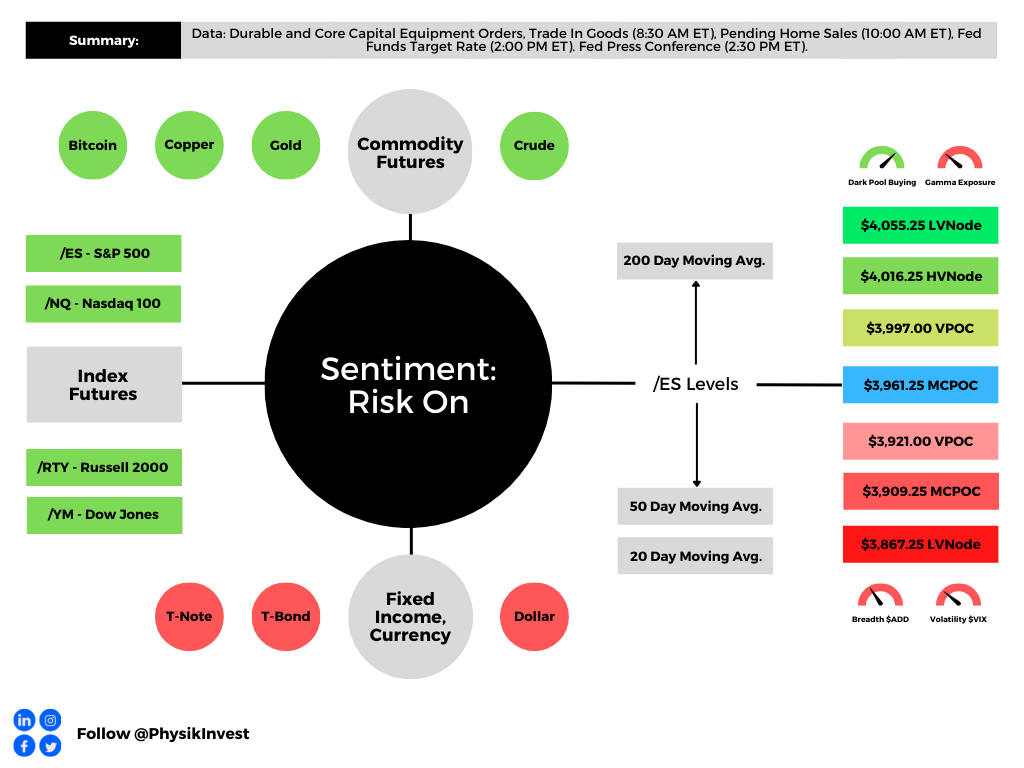
As of 6:30 AM ET, Wednesday’s regular session (9:30 AM – 4:00 PM ET), in the S&P 500, is likely to open in the upper part of a positively skewed overnight inventory, just outside of prior-range and -value, suggesting a potential for immediate directional opportunity.
In the best case, the S&P 500 trades higher.
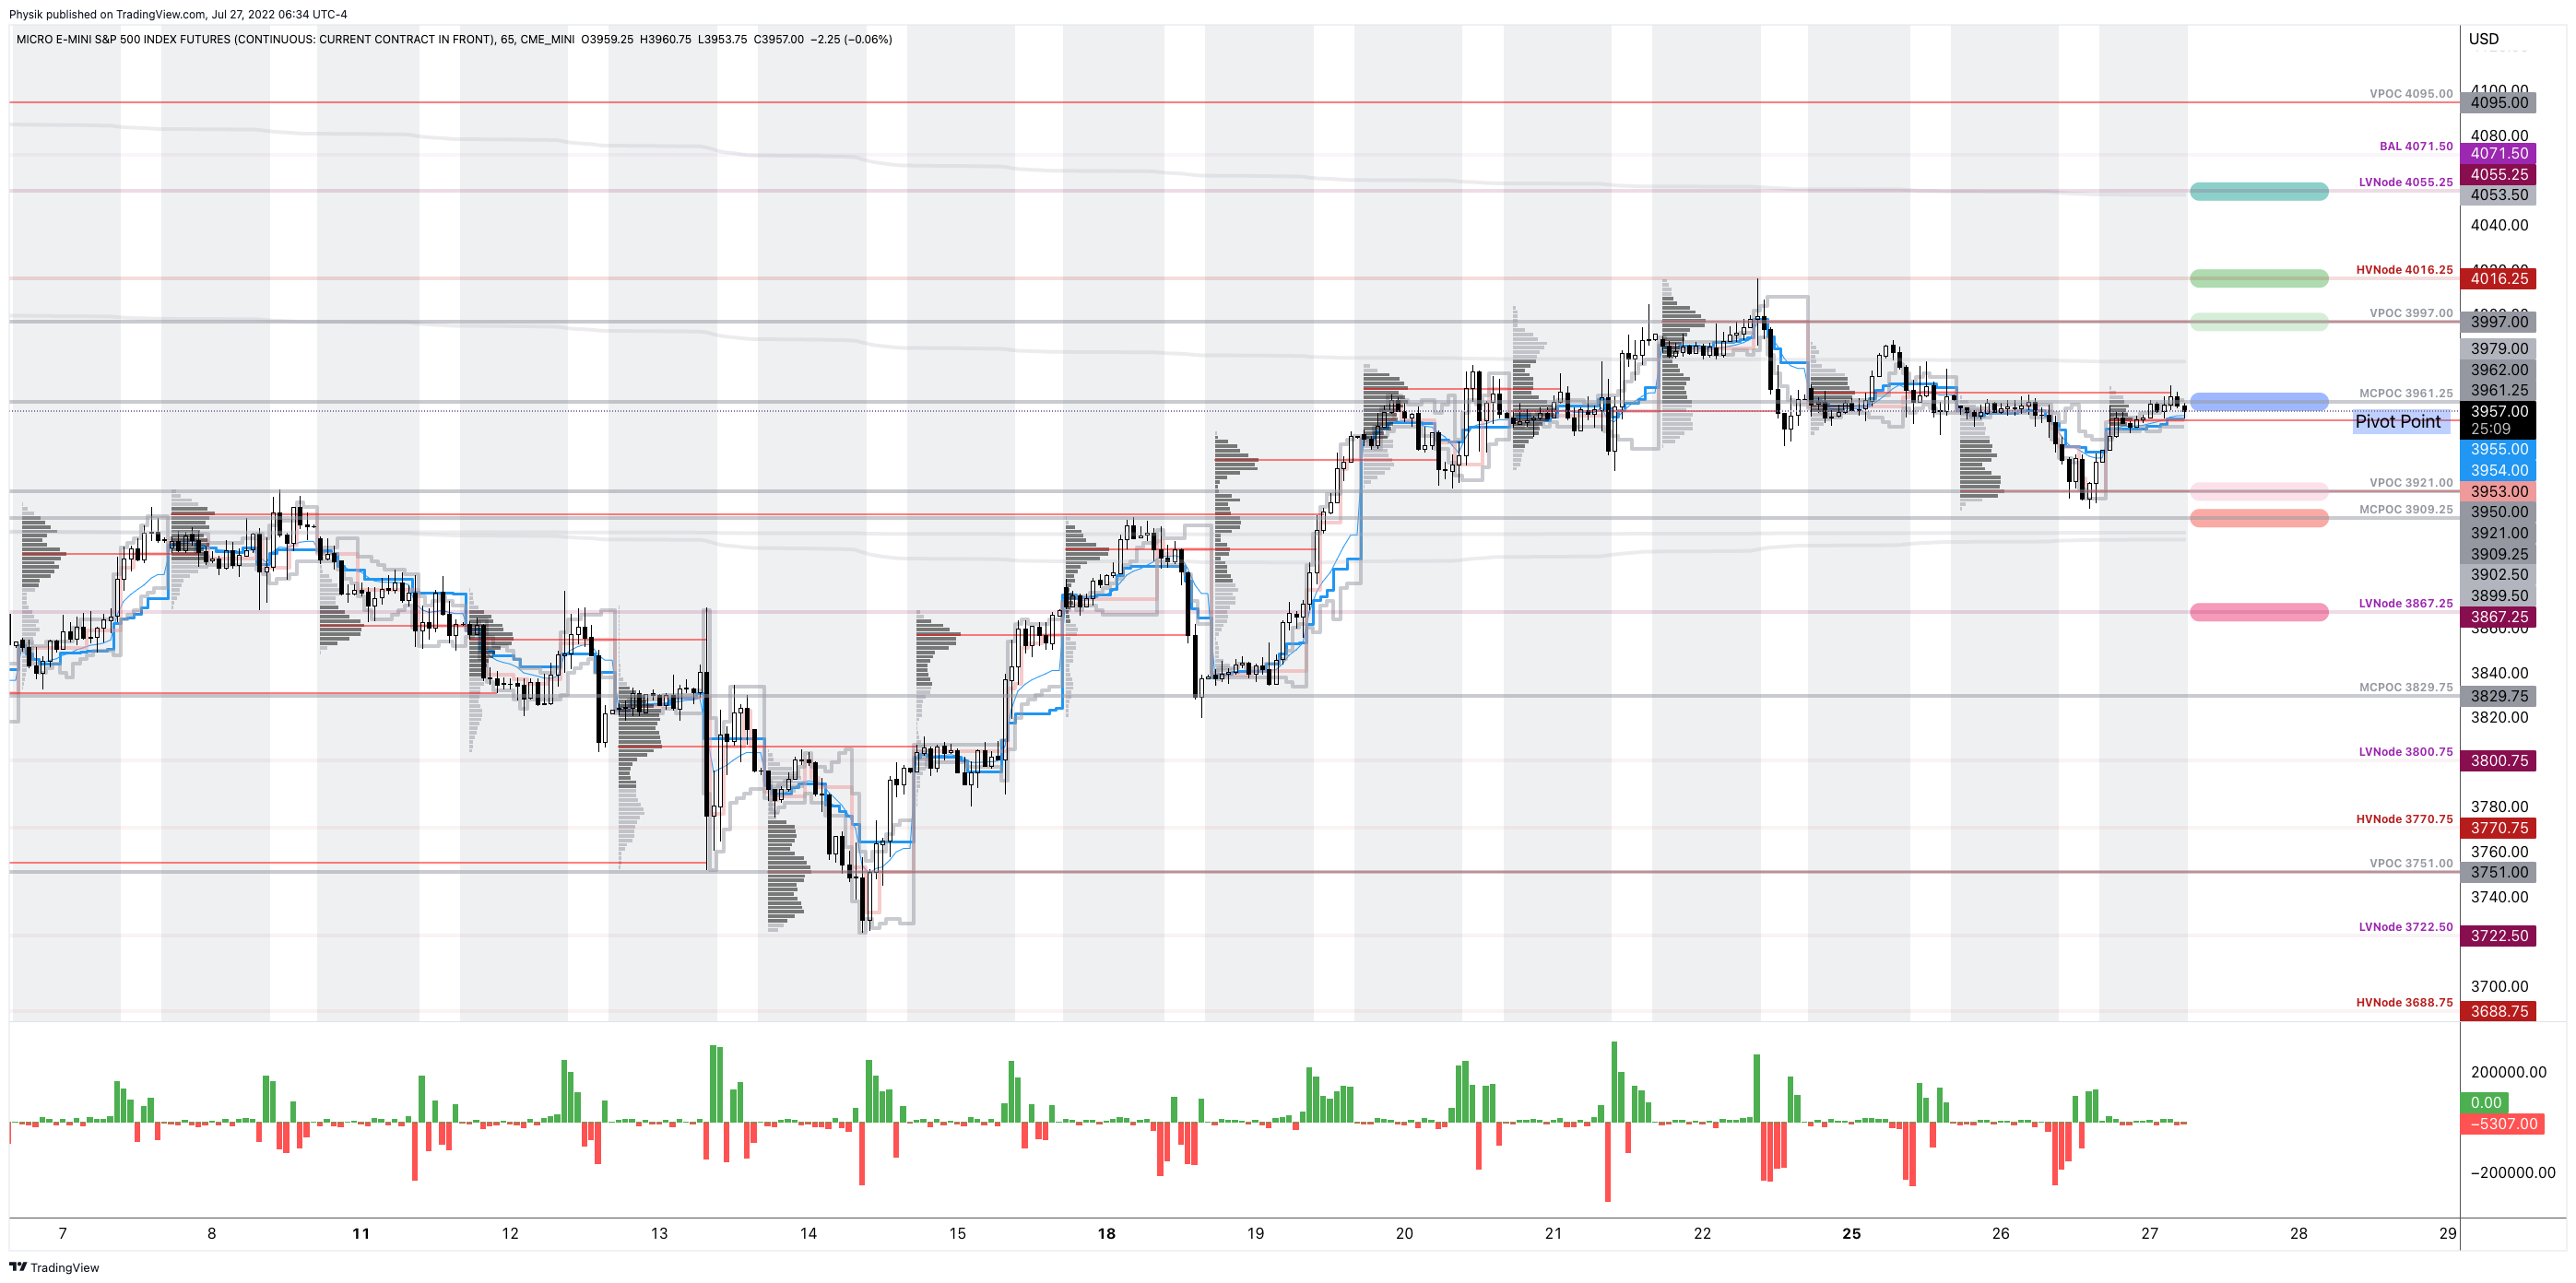
Any activity above the $3,961.25 MCPOC puts into play the $3,997.00 VPOC. Initiative trade beyond the VPOC could reach as high as the $4,016.25 HVNode and $4,055.25 LVNode, or higher.
In the worst case, the S&P 500 trades lower.
Any activity below the $3,961.25 MCPOC puts into play the $3,921.00 VPOC. Initiative trade beyond the VPOC could reach as low as the $3,909.25 MCPOC and $3,867.25 LVNode, or lower.
Click here to load today’s key levels into the web-based TradingView charting platform. Note that all levels are derived using the 65-minute timeframe. New links are produced, daily.
Definitions
Volume Areas: A structurally sound market will build on areas of high volume (HVNodes). Should the market trend for long periods of time, it will lack sound structure, identified as low volume areas (LVNodes). LVNodes denote directional conviction and ought to offer support on any test.
If participants were to auction and find acceptance into areas of prior low volume (LVNodes), then future discovery ought to be volatile and quick as participants look to HVNodes for favorable entry or exit.
POCs: POCs are valuable as they denote areas where two-sided trade was most prevalent in a prior day session. Participants will respond to future tests of value as they offer favorable entry and exit.
MCPOCs: POCs are valuable as they denote areas where two-sided trade was most prevalent over numerous day sessions. Participants will respond to future tests of value as they offer favorable entry and exit.
Volume-Weighted Average Prices (VWAPs): A metric highly regarded by chief investment officers, among other participants, for quality of trade. Additionally, liquidity algorithms are benchmarked and programmed to buy and sell around VWAPs.
About
After years of self-education, strategy development, mentorship, and trial-and-error, Renato Leonard Capelj began trading full-time and founded Physik Invest to detail his methods, research, and performance in the markets.
Capelj also develops insights around impactful options market dynamics at SpotGamma and is a Benzinga reporter.
Some of his works include conversations with ARK Invest’s Catherine Wood, investors Kevin O’Leary and John Chambers, FTX’s Sam Bankman-Fried, ex-Bridgewater Associate Andy Constan, Kai Volatility’s Cem Karsan, The Ambrus Group’s Kris Sidial, among many others.
Disclaimer
In no way should the materials herein be construed as advice. Derivatives carry a substantial risk of loss. All content is for informational purposes only.


5 replies on “Daily Brief For July 27, 2022”
[…] the macro risk, and the poor performance of implied volatility (IVOL), relative to that which markets have realized (RVOL), per The Ambrus […]
[…] the past few sessions, we did much to unpack and understand some of the implications of participants’ market […]
[…] in equity implied volatility, “one of the most supportive things into the decline,” per statements by Kai Volatility’s Cem […]
[…] an “untethering” in equity IVOL, “one of the most supportive things into the decline,” per statements by Kai Volatility’s Cem […]
[…] in equity implied volatility (IVOL), “one of the most supportive things into the decline,” per statements by Kai Volatility’s Cem […]