
The daily brief is a free glimpse into the prevailing fundamental and technical drivers of U.S. equity market products. Join the 300+ that read this report daily, below!
Fundamental
To start, thank you to the many new subscribers who joined in the past weeks. I’m honored.

Further, today we start broad (fundamental) and hone into specifics on how to act in the current trade environment (positioning), as well as potential inflection (technical) points.

I encourage you to read through to the technicals part, if possible. Have a great week!
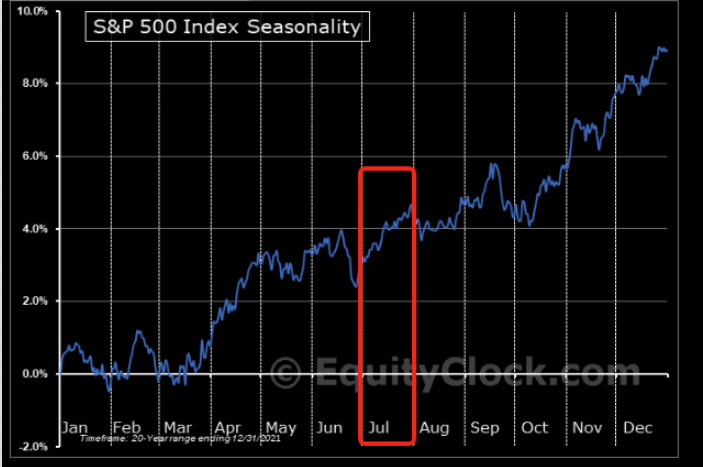
Seasonally speaking, the markets are in the midst of one of the most bullish periods of the year.
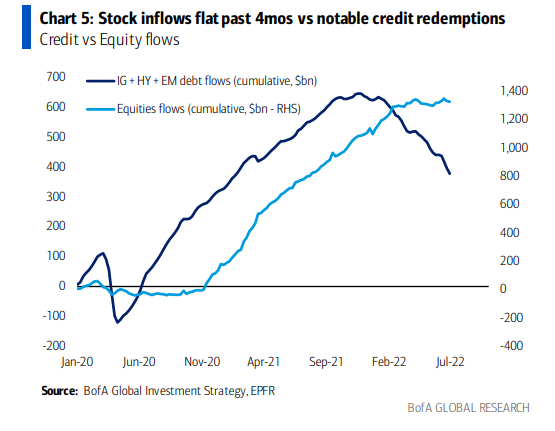
This is as stock market flows have yet to turn as they did for bonds months ago.
The cycle is as follows: typically bonds are the first to turn. Stocks and commodities follow.
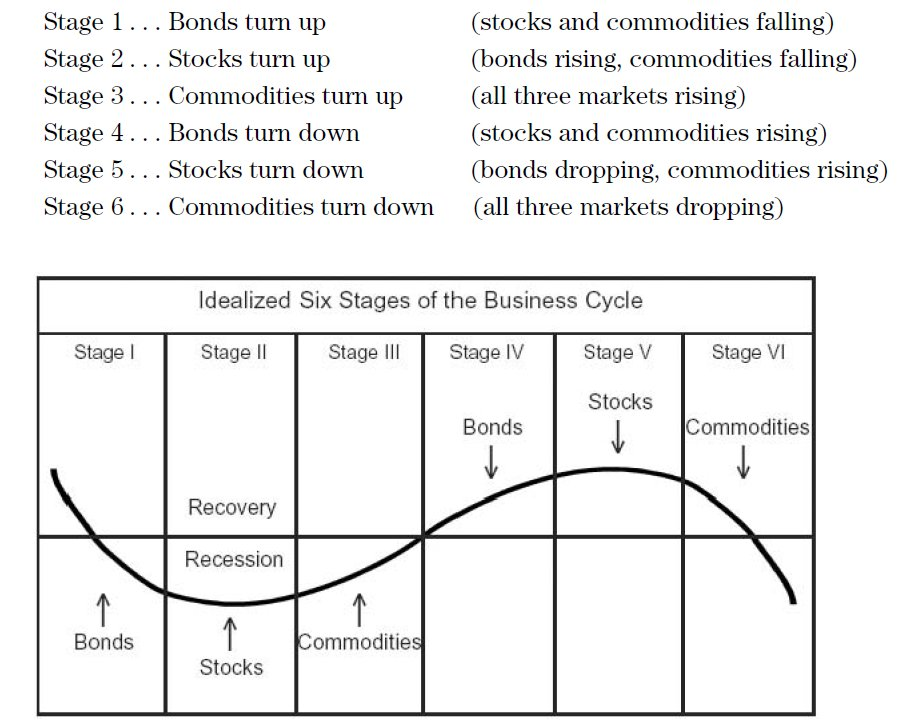
With bonds and equity products now off their swing lows and commodities off their highs (as inflation has, potentially, peaked), we have to question how much more?
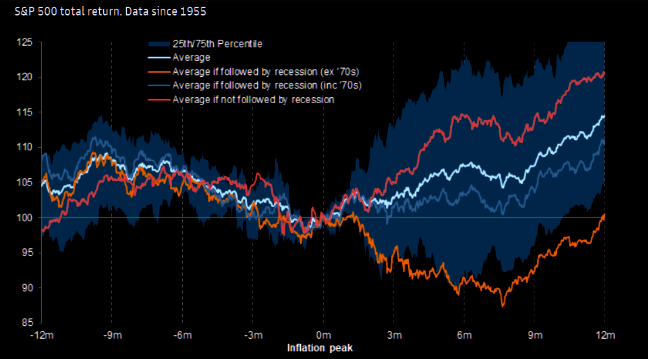
Well, thus far, and this is something we’ve talked about in the past, markets have suffered through compression in multiples. Does it stop or is there a looming earnings compression?
The earnings season shall shed clarity on the answer all the while – what is known – a strong dollar is sure to translate into a headwind for S&P 500 earnings growth.
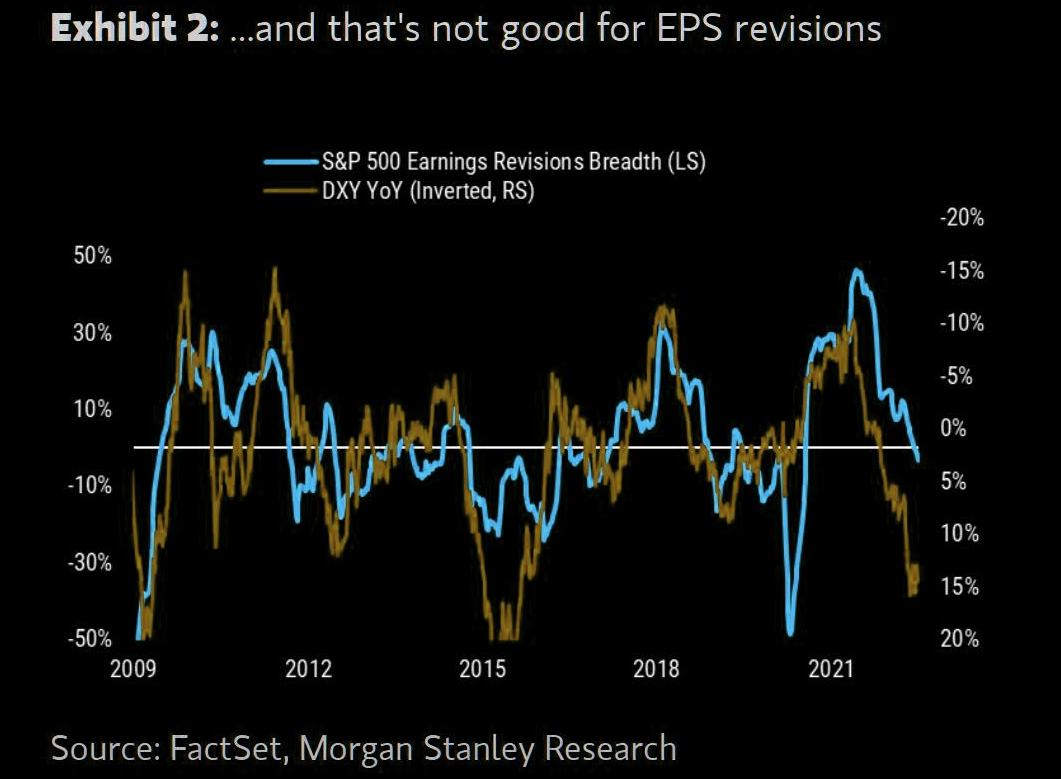
“The main point for equity investors is that this dollar strength is just another reason to think earnings revisions are coming down,” Morgan Stanley’s Mike Wilson explains.
“[T]he recent rally in stocks is likely to fizzle out before too long.”
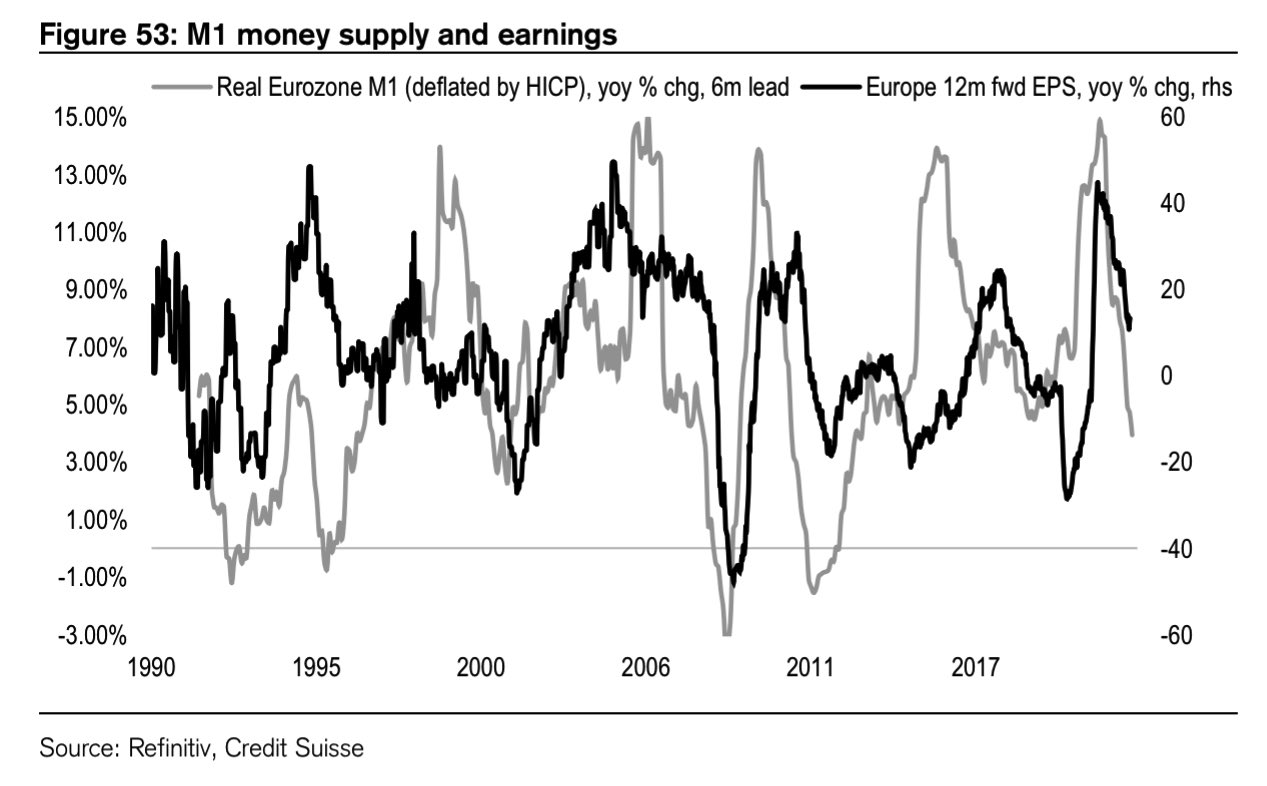
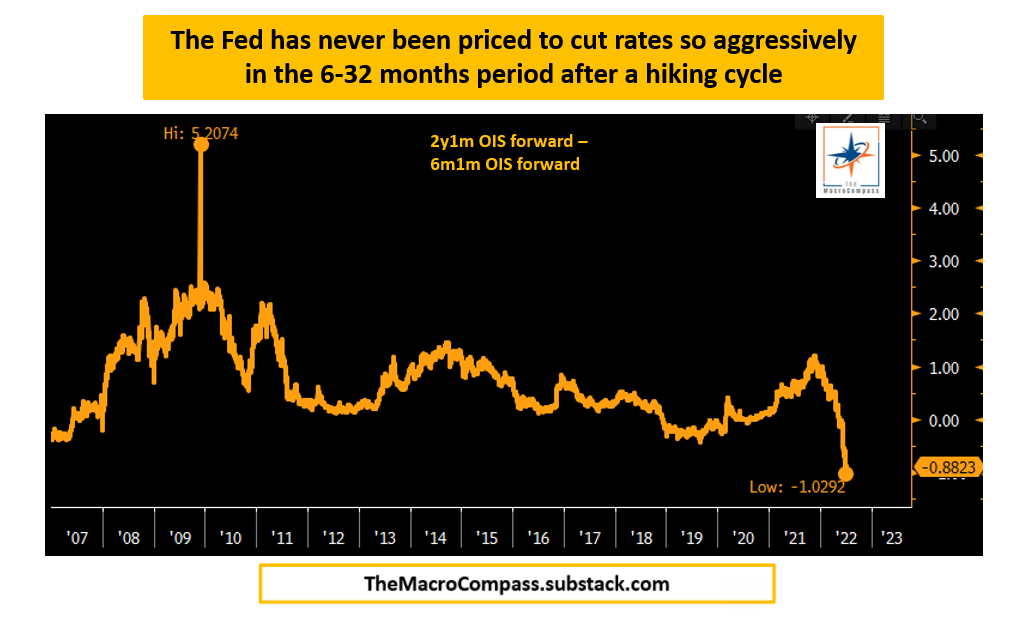
Moreover, with the impulse in credit falling, labor market showing preliminary signs of weakness, a drawdown in commodities (which is consistent with sharply lower economic growth), and bond market pricing rate cuts in early 2023, immediately following the hiking cycle, portfolios can “stay away from highly speculative assets, own USD cash and start allocating towards 5-10y+ government bonds,” as Alfonso Peccatiello explains well in his letter, The Macro Compass.
Positioning
Calmer trade alongside easing volatility and generally rising gamma exposures. Trade, at times, was responsive. Participants would add positive (negative) delta bets into weakness (strength).
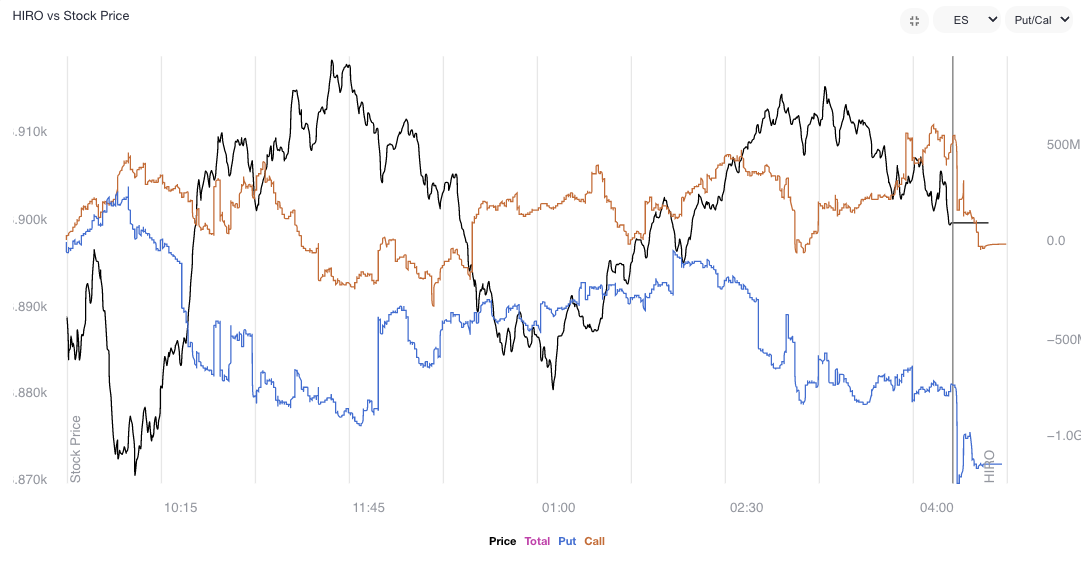
Noteworthy is the continued sale of volatility, particularly across shorter time horizons, as well as increased demand for call options, especially in some of the larger index weights. Volatility sale, on the part of customers, leaves liquidity providers warehousing long volatility (which is kind of a naive thing to say as we’re discounting customer trades being paired off with each other).
Nonetheless, these liquidity providers’ positions, all else equal, will maintain or increase in value if underlying(s) realize volatility (especially that far in excess of implied). To hedge, rips (dips) will be sold (bought) to offset the increasing positive (negative) delta.
Moreover, this trend in volatility supply is in part on the loss of interest in “leveraged long S&P” trades, as well as “marginal demand for puts,” as SqueezeMetrics has stated, before.
“Creeping into net selling territory is ‘smart’ bear market positioning. Short delta, short skew.”
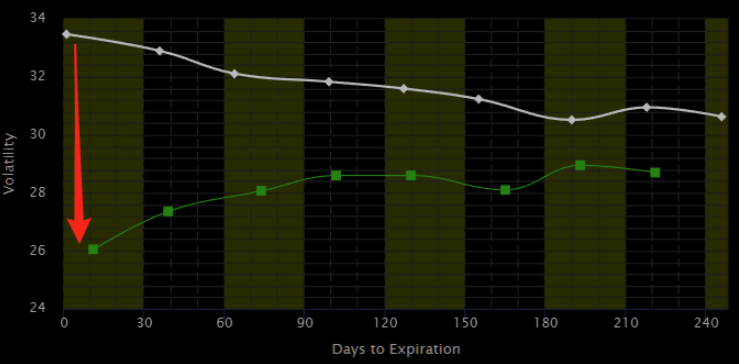
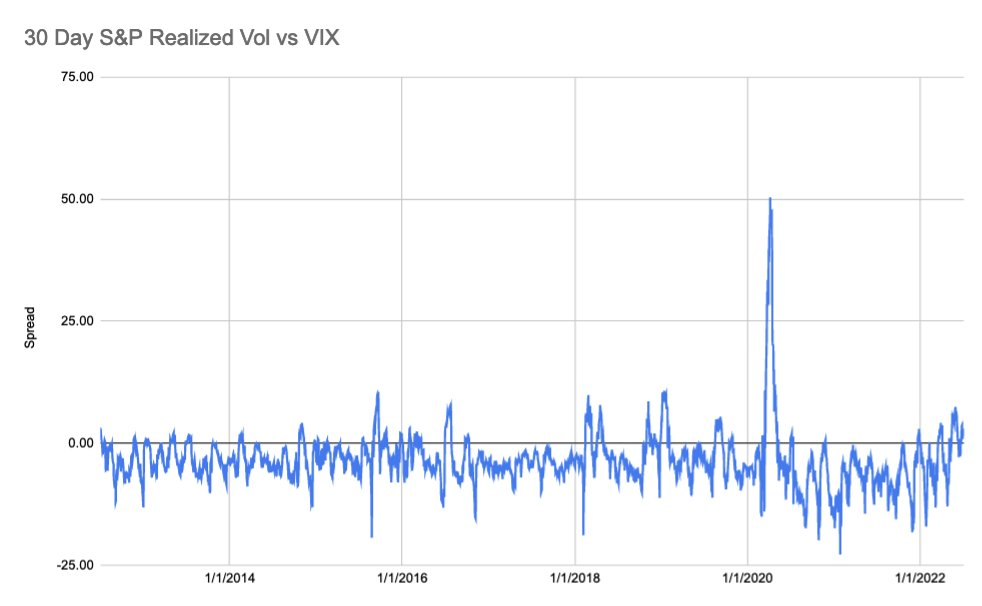
Accordingly, the volatility markets have realized (RVOL) has crept (and exceeded, at times) the volatility implied (IVOL).
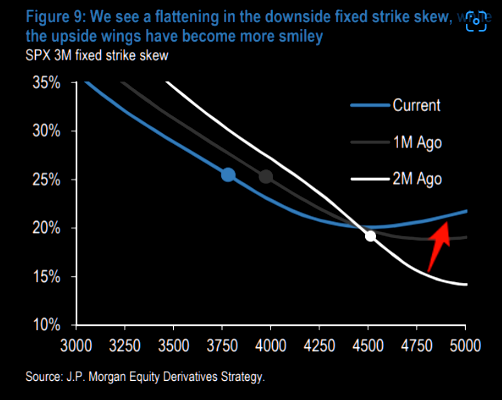
This, coupled with “a flattening in the downside fixed strike skew, while the upside wings [are] more smiley,” as described by JPMorgan Chase & Co (NYSE: JPM), has made for attractive low-cost spread opportunities, as talked about in the July 8, 2022 letter.
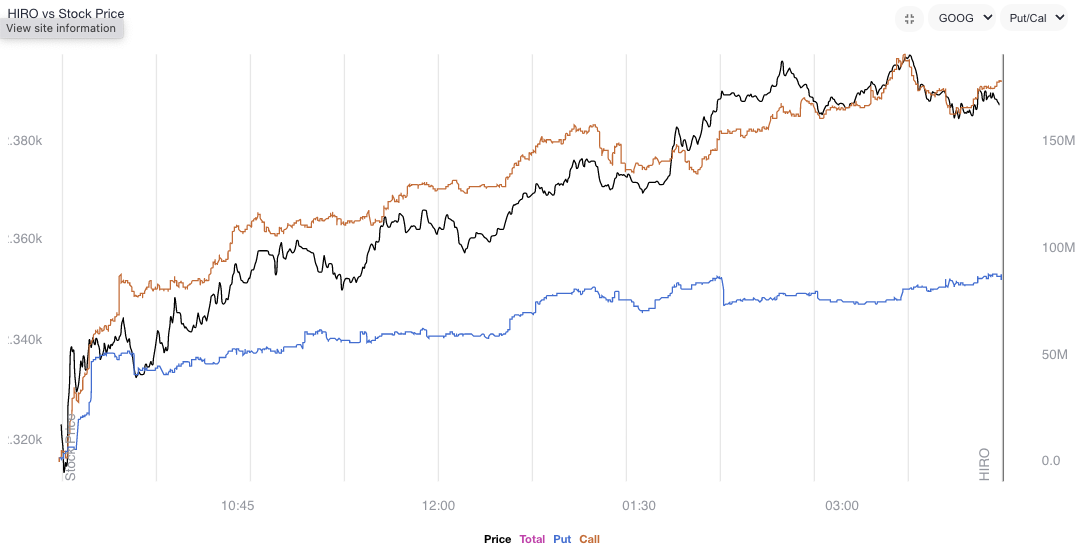
For instance, as discussed Friday, ratio spreads continue to work well for low- or no-cost exposure to the upside.
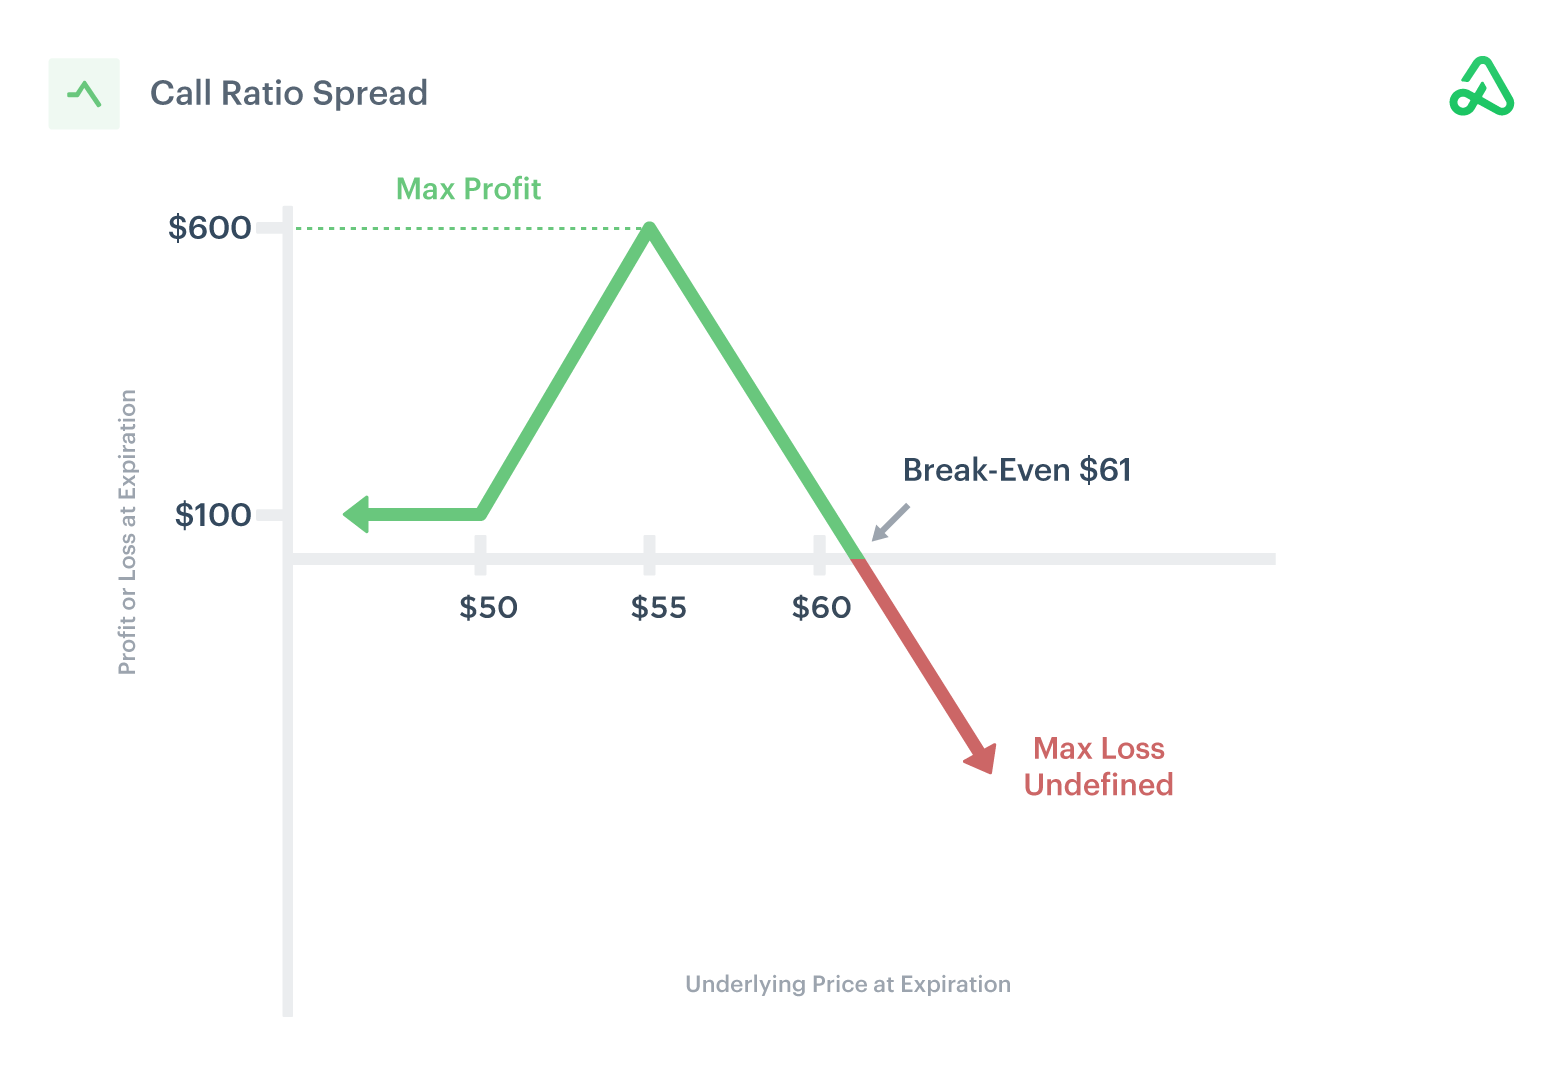
Pursuant to those remarks, no-cost spreads this letter’s writer has structured in Alphabet Inc (NASDAQ: GOOG) (NASDAQ: GOOGL) are pricing hundreds of dollars in credit to close.

Obviously, there’s no mention, here, of the risk management (e.g., sizing and width) involved. Again, this is as I’m trying to give actionable info without providing explicit recommendations.
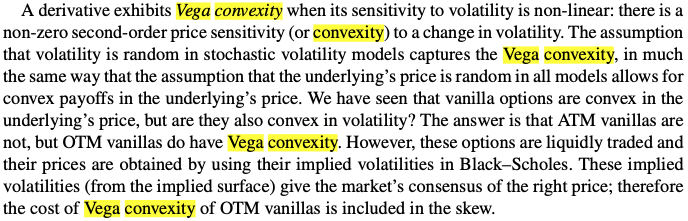
Similarly, if one thought volatility, though at a high starting point particularly at the money (ATM), was due for a repricing, they would look for exposure to the downside via something such as an inverse ratio (or back spread), as said last week.
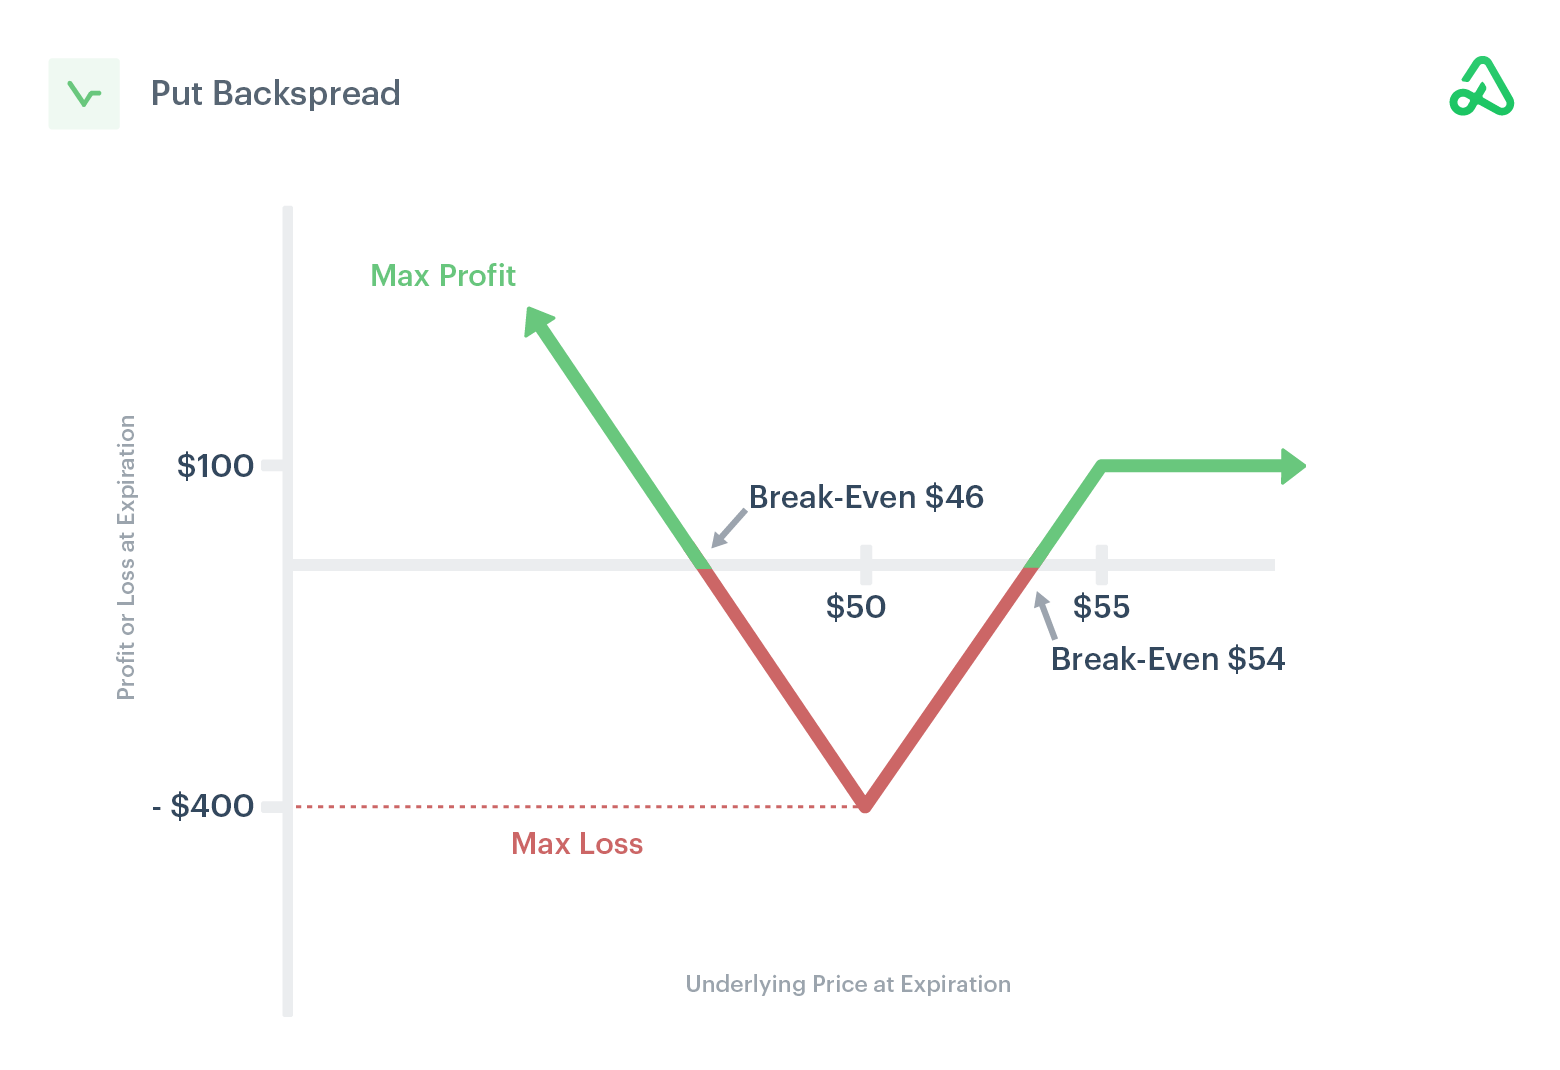
This is as the ATMs, unlike those further out of the money (OTM), are less convex in vega.
Technical
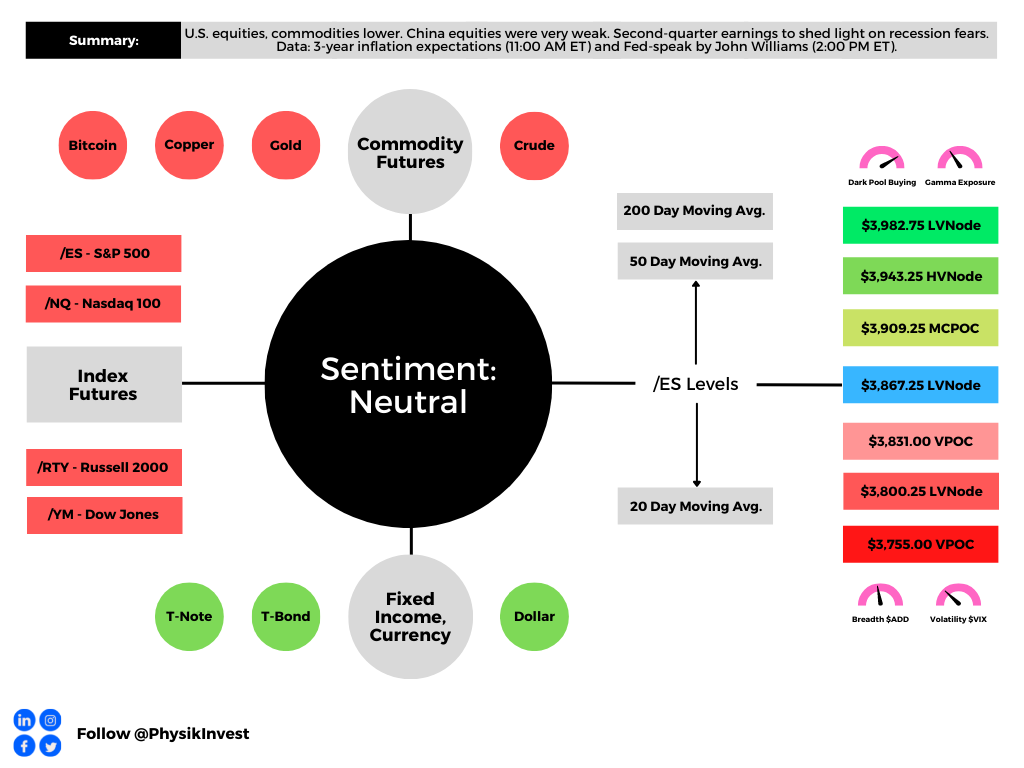
As of 7:00 AM ET, Monday’s regular session (9:30 AM – 4:00 PM ET), in the S&P 500, is likely to open in the middle-to-lower part of a negatively skewed overnight inventory, inside of prior-range and -value, suggesting a limited potential for immediate directional opportunity.
In the best case, the S&P 500 trades higher.
Any activity above the $3,867.25 LVNode puts into play the $3,909.25 MCPOC. Initiative trade beyond the MCPOC could reach as high as the $3,943.25 HVNode and $3,982.75 LVNode, or higher.
In the worst case, the S&P 500 trades lower.
Any activity below the $3,867.25 LVNode puts into play the $3,831.00 VPOC. Initiative trade beyond the VPOC could reach as low as the $3,800.25 LVNode and $3,755.00 VPOC, or lower.
Click here to load today’s key levels into the web-based TradingView charting platform. Note that all levels are derived using the 65-minute timeframe. New links are produced, daily.

Considerations: Responsiveness near key-technical areas (that are discernable visually on a chart), suggests technically-driven traders with short time horizons are very active.
Such traders often lack the wherewithal to defend retests and, additionally, the type of trade may be indicative of the other time frame participants waiting for more information to initiate trades.
Example: The below 65-minute S&P 500 chart with volume profiles was included in the July 8, 2022 edition of the newsletter. Prices were near an inflection (micro-composite point of control and two key volume-weighted average price levels). From thereon, selling surfaced.

This is what is meant by responsiveness near key-technical areas.

Definitions
Volume Areas: A structurally sound market will build on areas of high volume (HVNodes). Should the market trend for long periods of time, it will lack sound structure, identified as low volume areas (LVNodes). LVNodes denote directional conviction and ought to offer support on any test.
If participants were to auction and find acceptance into areas of prior low volume (LVNodes), then future discovery ought to be volatile and quick as participants look to HVNodes for favorable entry or exit.
POCs: POCs are valuable as they denote areas where two-sided trade was most prevalent in a prior day session. Participants will respond to future tests of value as they offer favorable entry and exit.
MCPOCs: POCs are valuable as they denote areas where two-sided trade was most prevalent over numerous day sessions. Participants will respond to future tests of value as they offer favorable entry and exit.
Volume-Weighted Average Prices (VWAPs): A metric highly regarded by chief investment officers, among other participants, for quality of trade. Additionally, liquidity algorithms are benchmarked and programmed to buy and sell around VWAPs.
About
After years of self-education, strategy development, mentorship, and trial-and-error, Renato Leonard Capelj began trading full-time and founded Physik Invest to detail his methods, research, and performance in the markets.
Capelj also develops insights around impactful options market dynamics at SpotGamma and is a Benzinga reporter.
Some of his works include conversations with ARK Invest’s Catherine Wood, investors Kevin O’Leary and John Chambers, FTX’s Sam Bankman-Fried, former Bridgewater Associate Andy Constan, Kai Volatility’s Cem Karsan, The Ambrus Group’s Kris Sidial, among many others.
Disclaimer
In no way should the materials herein be construed as advice. Derivatives carry a substantial risk of loss. All content is for informational purposes only.


4 replies on “Daily Brief For July 11, 2022”
[…] – and this is pursuant to the Daily Brief for Monday, July 11 – markets have only suffered through compression in multiples. Does it stop or is there a […]
[…] by JPMorgan Chase & Co (NYSE: JPM), has made for attractive low-cost spread opportunities, as talked about yesterday and in the July 8, 2022 […]
[…] spread opportunities still exist and remain […]
[…] options structures that we said may be good to take advantage of the “smiley” skew (e.g., zero- or low-cost call ratio spreads) are […]