
The daily brief is a free glimpse into the prevailing fundamental and technical drivers of U.S. equity market products. Join the 300+ that read this report daily, below!
Fundamental
An incredibly busy past few months with what it seems are back-to-back historic developments.
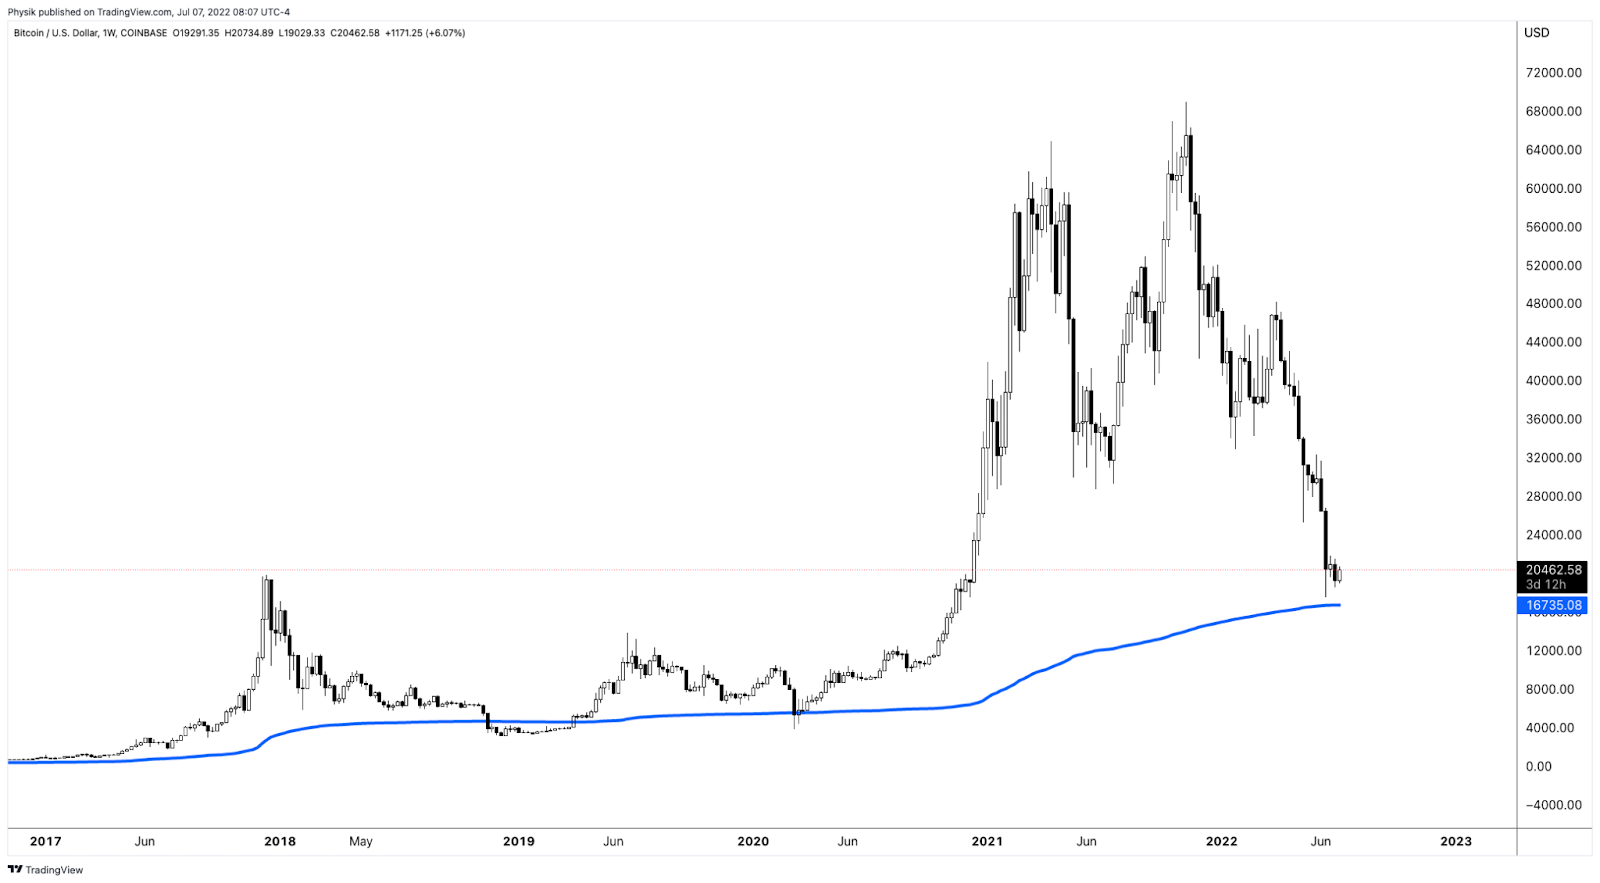
For instance, just this week, crypto broker Voyager Digital (OTC: VYGVF) filed for bankruptcy. “Impaired” will be account holders who likely won’t be “getting back exactly what they’re owed,” as reported by Bloomberg.
This is on the heels of crypto market volatility affecting some of Voyager’s largest borrowers like Three Arrows Capital, an embattled hedge fund. Voyager lent deposits to these parties at rates of interest that were ultra-high. Customers were then, accordingly, paid high rates.
However, this was done under the impression that the customer holdings were liquid, easy to access, and not subject to counterparty risks. That didn’t happen. Voyager, like others, was “making a lot of unsecured or undersecured loans.”
What’s the takeaway, here? Bloomberg’s Matt Levine explains well.
“If supposedly safe crypto brokerages keep failing and customers keep losing money, that is bad for the whole ecosystem; if your money isn’t safe with any crypto brokerage then you might just not buy crypto.”
Others in the ecosystem have continued to lever on the supposed successes of crypto. The failure of Voyager, among others, may have knock-on effects to be felt much later in the cycle.
Another historic development was the London Metal Exchange’s (LME) cancellation of billions of dollars in trades. This made whole large bettors in that ecosystem, all the while dinging liquidity providers, badly.
Some, including algorithmic fund Transtrend, left the LME as they could no longer trust it with client funds.
The question is what now? What’s the next big thing and, more importantly, will it have an impact on the traditional markets we watch?
As talked about in past analyses, it is over the last four decades that monetary policies were a go-to for supporting the economy. From that, created was “a disinterest and unimportance to cash flows.”
The commitment to reducing liquidity and credit has consequences on the real economy and asset prices, accordingly, which rose and kept the deflationary pressures of policies at bay.
It is elevated volatility, persistent declines, slower tightening processes abroad, among other things, that are to prompt investors to lower their selling prices in risk(ier) assets (e.g., options bets, metals, cryptocurrency and stablecoins, equities, bonds) and compete for cash.
This all is to continue bolstering the dollar’s surge to some of its strongest levels in years.

As well as further douse inflation (which is likely to peak on inventories bloat and a “supply gut”) and, eventually, prompt the Federal Reserve to reverse its aggressive rate hike and quantitative tightening (QT) path.
“It is starting,” Nassim Nicholas Taleb said online. “I’ve seen gluts not followed by shortages, but I’ve never seen a shortage not followed by a glut.”
ARK Invest’s Catherine Wood, who was very early to call the peak inflation, puts forth that “If inventories and stock prices are leading indicators for employment and wages, … then fears of cost-push inflation a la 1970’s should disappear during the next six months.”
Positioning
Thus far, we’re far into a dot-com type collapse, albeit one that has happened “underneath the surface of the indices,” per Simplify Asset Management’s Mike Green, as those largest stocks still are recipients of strong passive flows.
The upcoming earnings season is likely to shed clarity with respect to corporates’ ability to weather or pass on higher costs. It is possible, as some put forth, that there is a broad “earnings compression,” deepening the de-rate in the face of what has been a “multiple compression.”
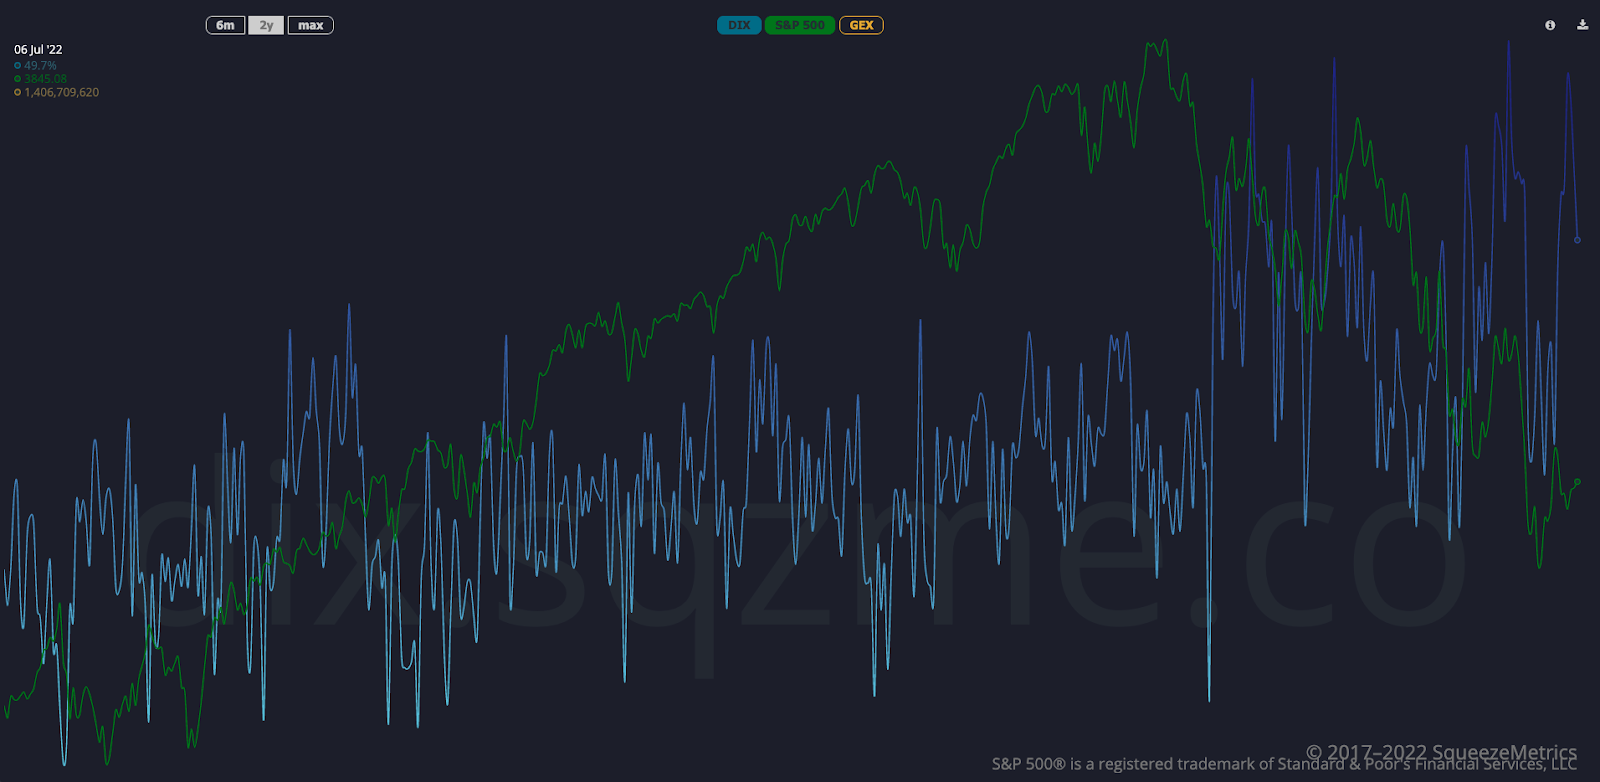
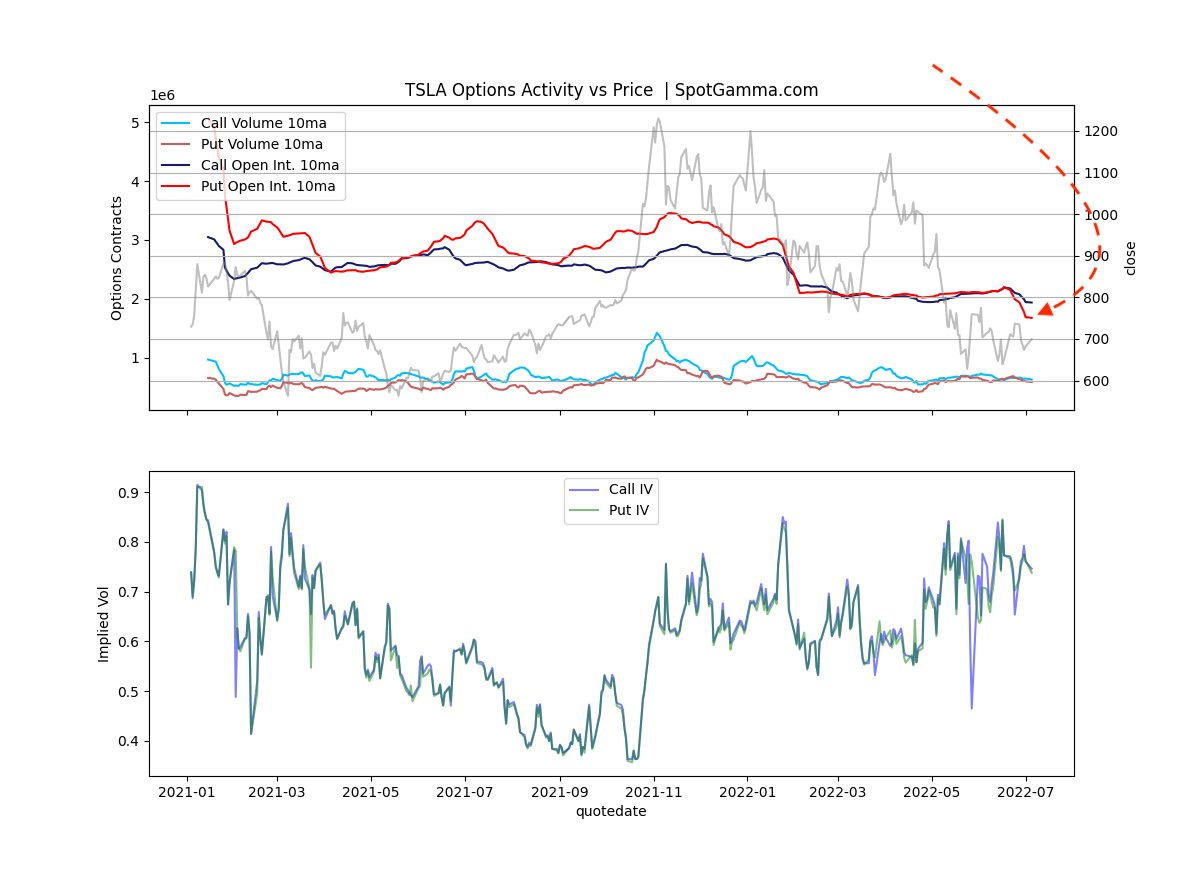
From a positioning perspective, so awing is the absence of heightened demand for downside skew, all the while that, on the upside, is bid probably due to the reach for bets on a ferocious bear market rally.
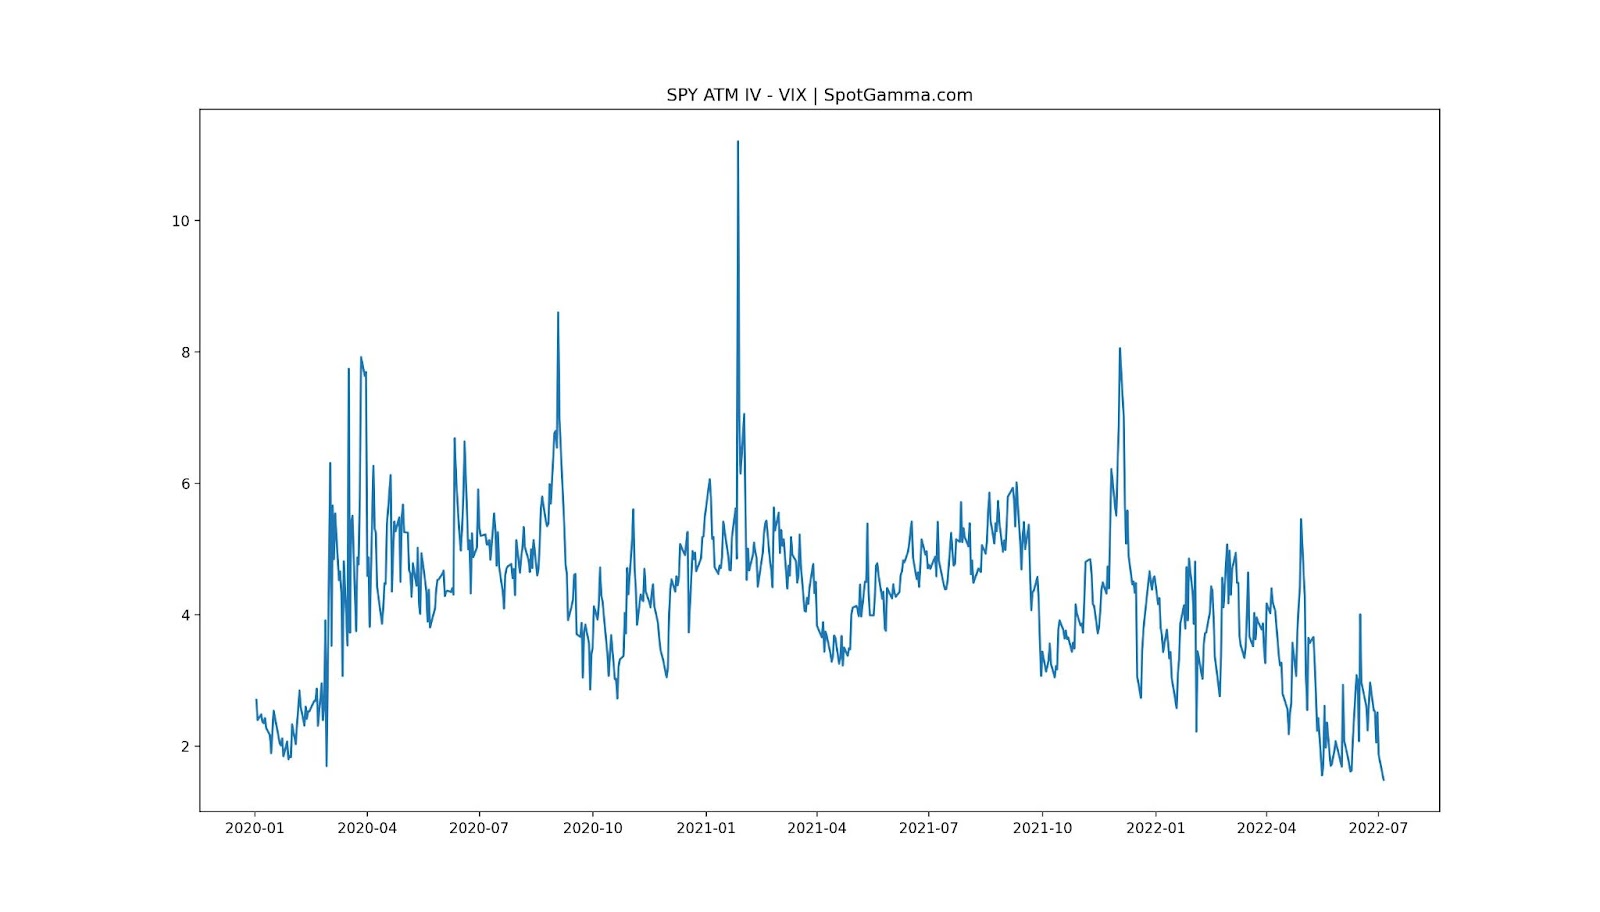
As explained yesterday, it makes sense to be a buyer of volatility, albeit via complex structures.
For instance, buying volatility on the upside that is closer to current prices and selling that which is farther out (if bullish). And (if bearish), opting for calendars (as it is volatility in the shortest of maturities being sold heavily), back spreads, and the like.
Read: Trading Volatility, Correlation, Term Structure and Skew by Colin Bennett.
On a more granular level, after the release of the Federal Open Market Committee (FOMC) meeting minutes, participants added to their put sales and call buys, at the index level. The hedging of this does more to take from potential realized volatility.
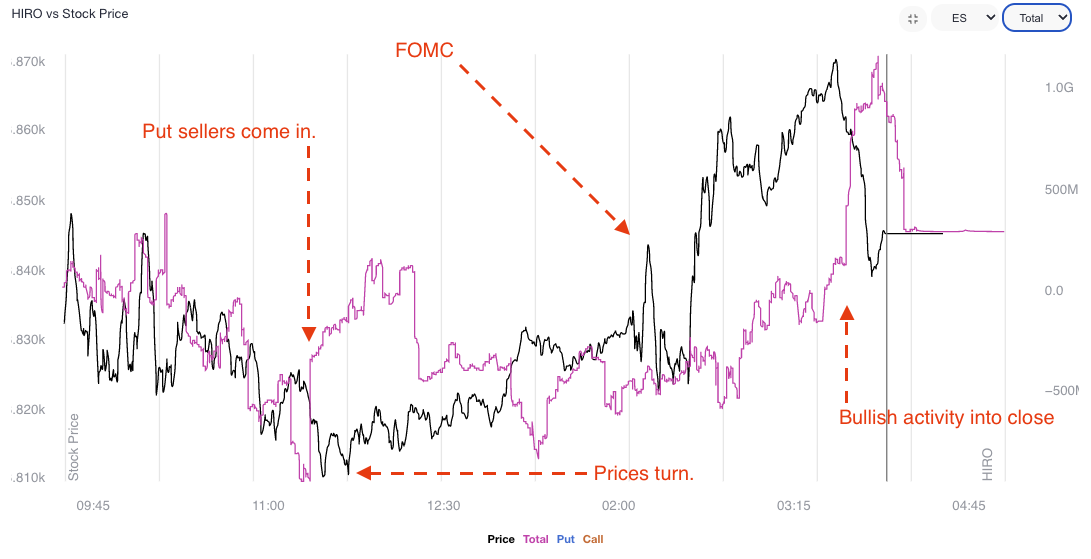
At its core, though, the market is at a pivot and losing the $3,800.00 S&P 500 area likely does more to bolster the creep in realized (RVOL) volatility, versus that which is implied (IVOL), all else equal.
Technical
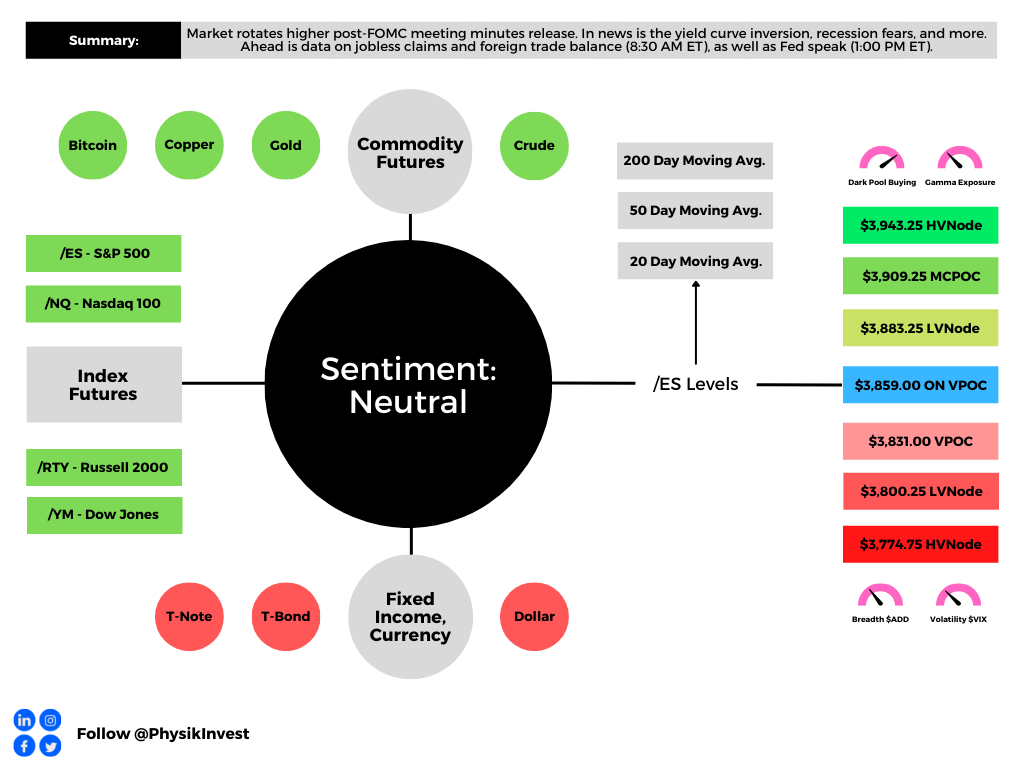
As of 6:45 AM ET, Thursday’s regular session (9:30 AM – 4:00 PM ET), in the S&P 500, is likely to open in the middle part of a balanced overnight inventory, inside of prior-range and -value, suggesting a limited potential for immediate directional opportunity.
In the best case, the S&P 500 trades higher.
Any activity above the $3,859.00 overnight POC puts into play the $3,883.25 LVNode. Initiative trade beyond the LVNode could reach as high as the $3,909.25 MCPOC and $3,943.25 HVNode, or higher.
In the worst case, the S&P 500 trades lower.
Any activity below the $3,859.00 overnight POC puts into play the $3,831.00 VPOC. Initiative trade beyond the VPOC could reach as low as the $3,800.25 LVNode and $3,774.75 HVNode, or lower.
Click here to load today’s key levels into the web-based TradingView charting platform. Note that all levels are derived using the 65-minute timeframe. New links are produced, daily.

Definitions
Volume Areas: A structurally sound market will build on areas of high volume (HVNodes). Should the market trend for long periods of time, it will lack sound structure, identified as low volume areas (LVNodes). LVNodes denote directional conviction and ought to offer support on any test.
If participants were to auction and find acceptance into areas of prior low volume (LVNodes), then future discovery ought to be volatile and quick as participants look to HVNodes for favorable entry or exit.
POCs: POCs are valuable as they denote areas where two-sided trade was most prevalent in a prior day session. Participants will respond to future tests of value as they offer favorable entry and exit.
MCPOCs: POCs are valuable as they denote areas where two-sided trade was most prevalent over numerous day sessions. Participants will respond to future tests of value as they offer favorable entry and exit.
Volume-Weighted Average Prices (VWAPs): A metric highly regarded by chief investment officers, among other participants, for quality of trade. Additionally, liquidity algorithms are benchmarked and programmed to buy and sell around VWAPs.
About
After years of self-education, strategy development, mentorship, and trial-and-error, Renato Leonard Capelj began trading full-time and founded Physik Invest to detail his methods, research, and performance in the markets.
Capelj also develops insights around impactful options market dynamics at SpotGamma and is a Benzinga reporter.
Some of his works include conversations with ARK Invest’s Catherine Wood, investors Kevin O’Leary and John Chambers, FTX’s Sam Bankman-Fried, former Bridgewater Associate Andy Constan, Kai Volatility’s Cem Karsan, The Ambrus Group’s Kris Sidial, among many others.
Disclaimer
In no way should the materials herein be construed as advice. Derivatives carry a substantial risk of loss. All content is for informational purposes only.


One reply on “Daily Brief For July 7, 2022”
[…] as talked about yesterday, inflation may have peaked. Inventories are pointing to a looming supply […]