
The daily brief is a free glimpse into the prevailing fundamental and technical drivers of U.S. equity market products. Join the 300+ that read this report daily, below!
What Happened
Overnight, equity index futures took back the post-Federal Open Market Committee (FOMC) bump. Bonds and most commodity products (less gold) followed suit.
The Federal Reserve (Fed) admitted to run-away prices and committed to slaying inflation via tougher action. Accordingly, the central bank upped interest rates by 75 basis points. This was the largest increase since 1994 and, as the Fed commented, another 75 basis point hike may be in store at the next meeting in July.
In other news, the Celsius Network (CRYPTO: CEL), a crypto favorite that amassed in excess of $20 billion in assets, froze withdrawals to stop what some say was a potential bank run. Private equity is facing a so-called “crisis of value” given over inflated prices in that market.
We shall unpack the latter, below, a bit.
Also, U.S. retail sales posted their first drop in five months, the Bank of England raised its rates along with the Swiss central bank which surprised with its first hike since 2007.
This is all the while Goldman Sachs Group Inc’s (NYSE: GS) buyback desk was flooded with volumes about 3 times last year’s daily average. This could be construed as companies viewing the latest selloff as an “opportunity to repurchase shares rather than retrenching.”
Ahead is data on jobless claims, building permits, housing starts, as well as the Philadelphia Fed’s manufacturing index (8:30 AM ET).
What To Expect
Fundamental: Fed funds rate upped 75 basis points.
Now, it appears the rate will surpass 3% after the FOMC affirmed its commitment “to returning inflation to its 2% objective.” Participants reacted, pricing in the potential for a rate peak in the range of 4.00-4.75% early-to-mid 2023, after which the easing cycle is to likely take place.
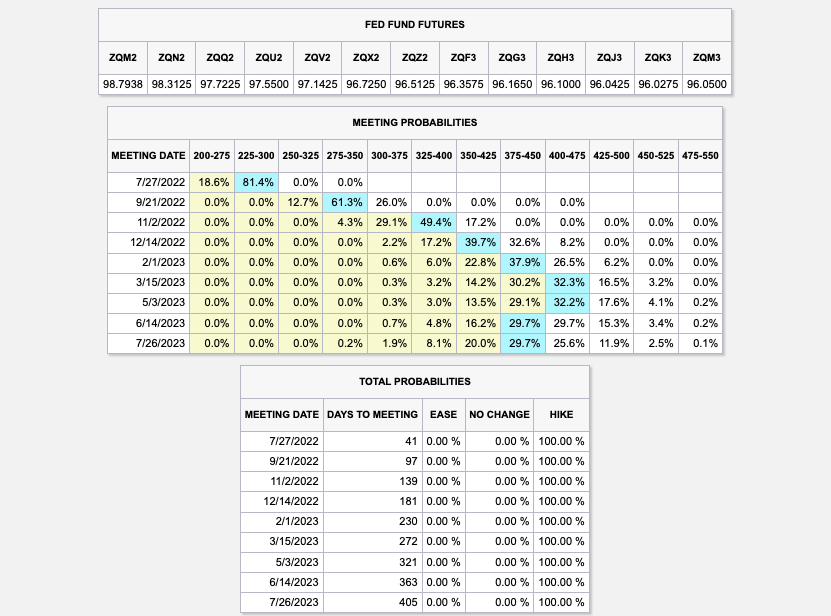
The overnight rate is expected to peak near 4.23% by mid-2023. This is a given via a quick check of the Eurodollar (FUTURE: /GE) futures curve, a reflection of participants’ outlook on interest rates. The peak of the Fed-rate-hike cycle – terminal rate – is around March 2023 (previously it was June).
For context, the price of /GE reflects the interest offered on U.S. dollar-denominated deposits at banks outside of the U.S. With that, they’re “expressed numerically using 100 minus the implied 3-month U.S. dollar LIBOR interest rate,” per Investopedia. This means that at current March 2023 prices (95.775), this reflects an implied interest rate settlement rate of 4.225%.
Read: The shift from the Eurodollar to SOFR is accelerating as “SOFR adoption cracked 50%.”
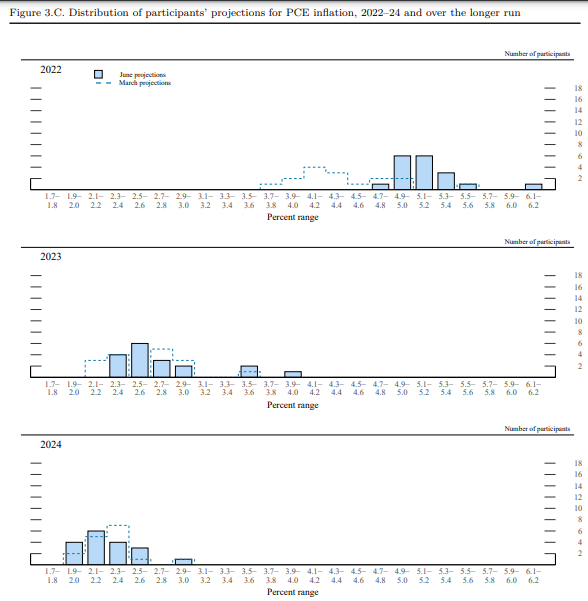
Moreover, the FOMC’s forecasts for inflation have moved all the while predictions for 2023 and 2024 have not.
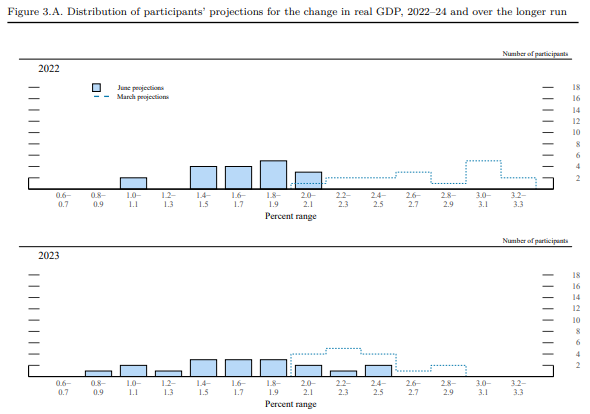
GDP growth estimates, too, have shifted but with the expectation there still will be growth.
As stated in this morning’s introduction (above), these policy adjustments are inflicting damage on some inflated areas of the market like crypto and private equity.
Recall that prevailing monetary policies made it easier to borrow and make longer-duration bets on ideas with a lot of promise in the future. Central banks, too, underwrote losses of this regime and encouraged continued growth. This had consequences on the real economy and asset prices which rose and kept deflationary pressures at bay.
As well put forth in our May 18, 2022 commentary, the recent market rout is a recession and the direct reflection of the unwind of carry. Capital was “misallocated” and the Fed’s move to control price stability is “completely unreasonable” as they’re not in a position to do it “without bringing down the markets,” per Kai Volatility’s Cem Karsan.
Read: Kris Abdelmessih’s Moontower #148 on prevailing macroeconomic perspectives.
As Lyn Alden of Lyn Alden Investment Strategy put forth, “unfortunately for the Fed, the U.S. economic growth rate is already decelerating” and, to cut inflation, it must reduce demand for goods. Indeed, this is recessionary and is already reflected by slowing retail sales.
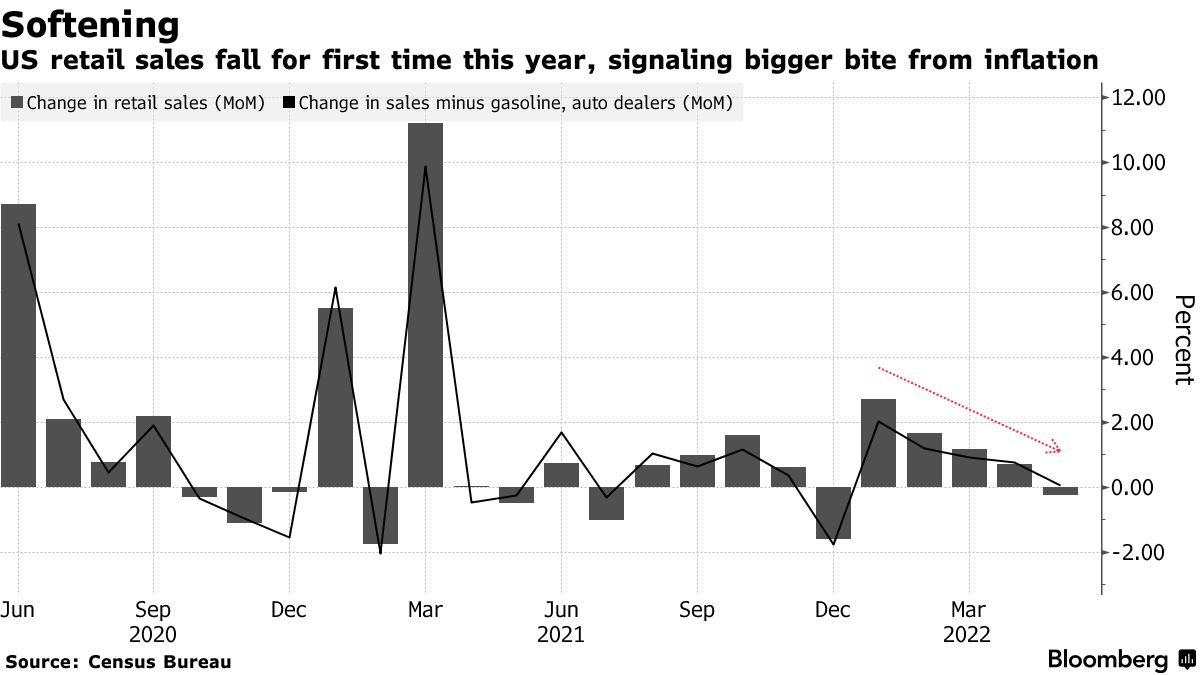
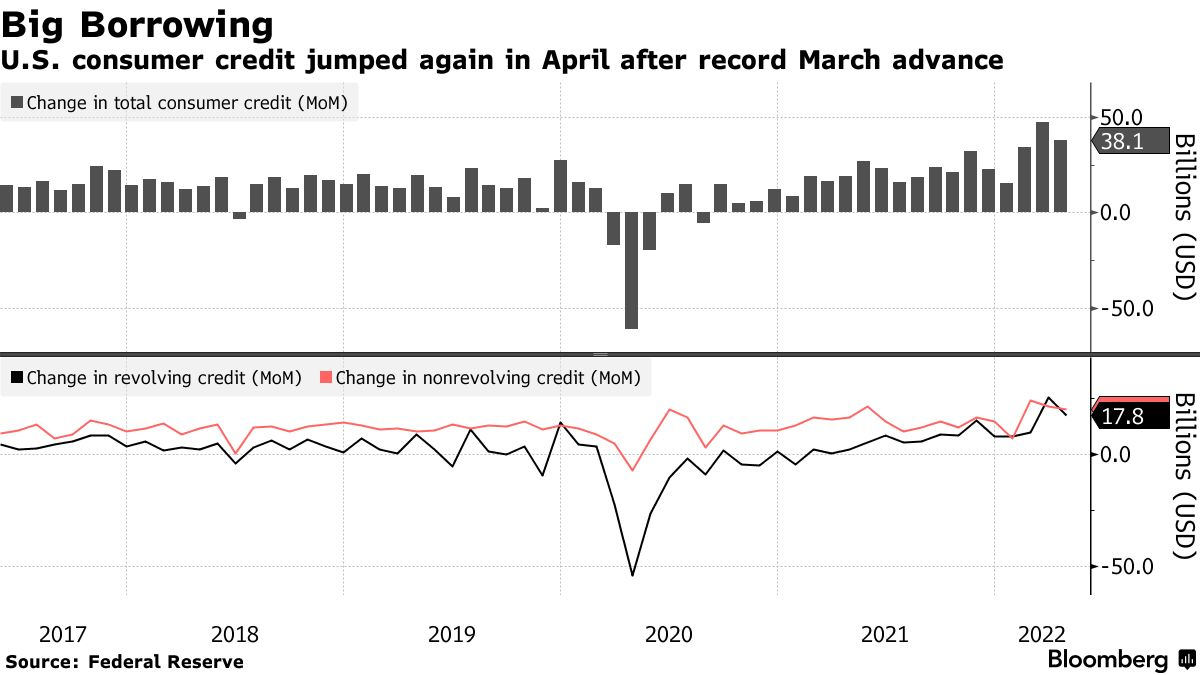
As Bloomberg explains, spending has shifted and is supported by consumers spending down their savings and leveraging credit cards.
Read: Klarna’s debt costs rise as buy-now-pay-later sector suffers.
“If this credit bubble ever pops, it’s going to be the most catastrophic market failure that anyone has ever read about — but let’s hope that doesn’t happen,” Mark Spitznagel, Miami-based Universa’s CIO, said in early June. “We’ve gotten ourselves into a tough spot.”
Perspectives: “The move in markets prices in more than enough recession risk, and we believe a near-term recession will ultimately be avoided thanks to consumer strength, Covid reopening/recovery, and policy stimulus in China,” JPMorgan Chase & Co’s (NYSE: JPM) Marko Kolanovic and his team said.
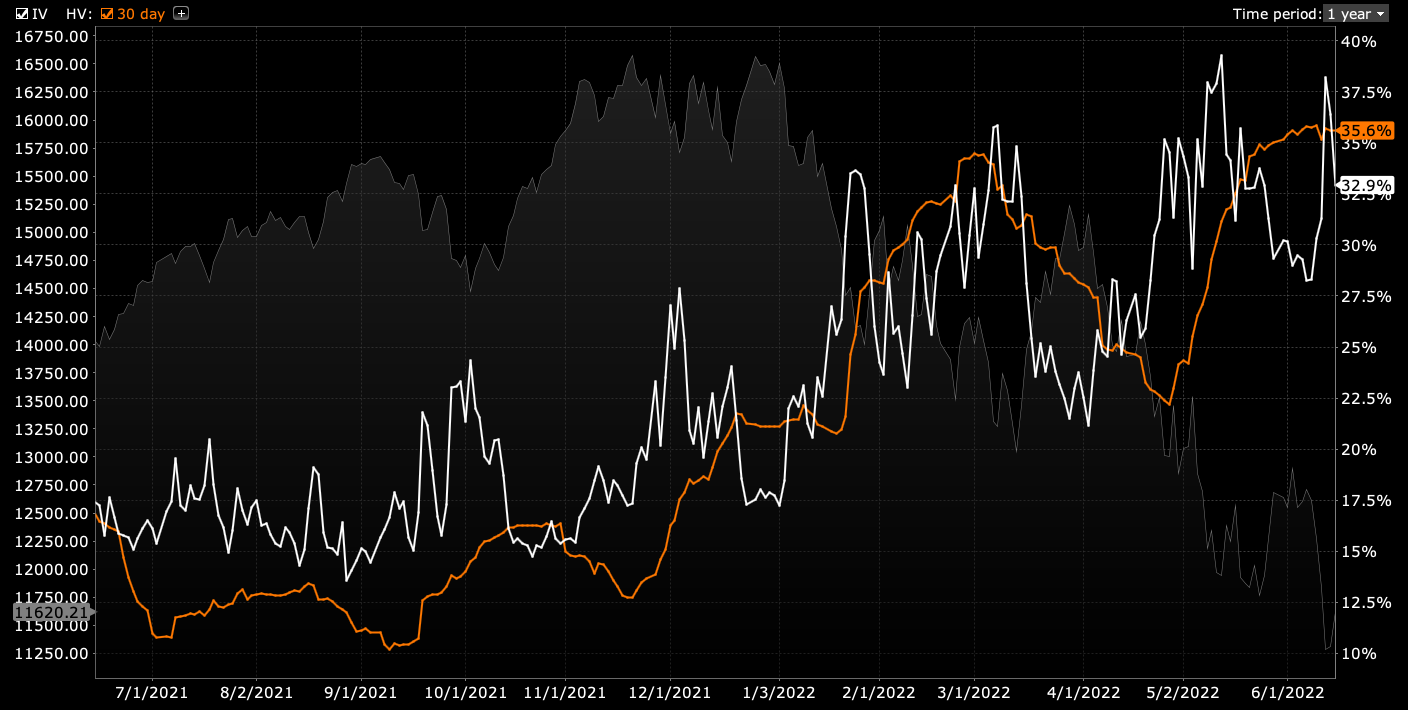
Positioning: Measures of implied volatility had come in, yesterday, and that was significant in that participants have a lot of exposure to put options.
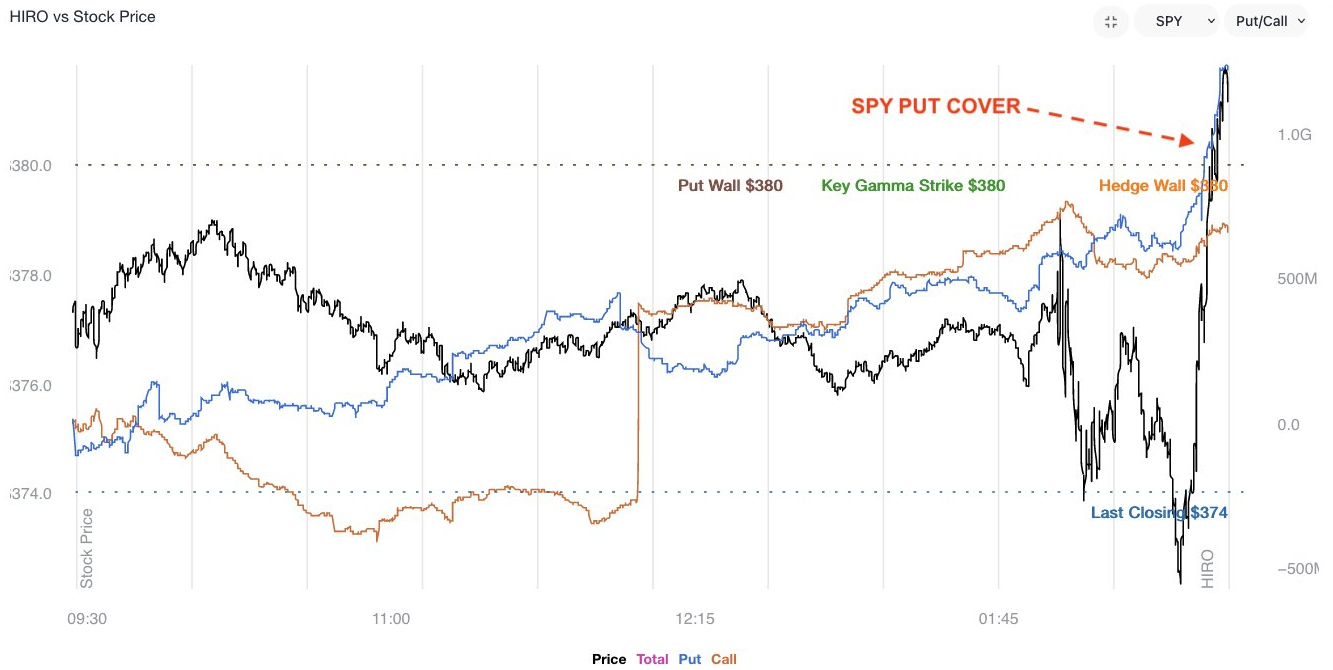
Further, (naively) we see it as liquidity providers being short those puts. As volatility continues to come in, the exposure of those options to direction (delta) compresses.
As a result, liquidity providers cut some of their negative (static) delta hedges to that positive delta put position.
This means that the potential options expiration (OPEX) related bullishness, so to speak, was pulled forward and, now, markets, being markedly lower than they were immediately after the FOMC event, are at risk of trading into (and below) the sizeable interest down below.
Read: Daily Brief for June 15, 2022.
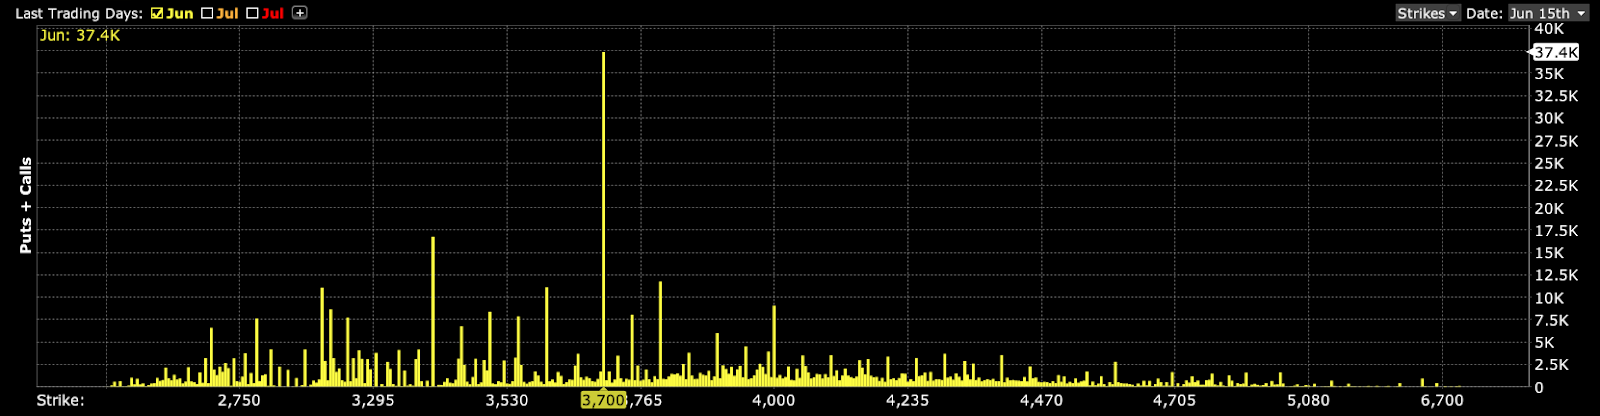
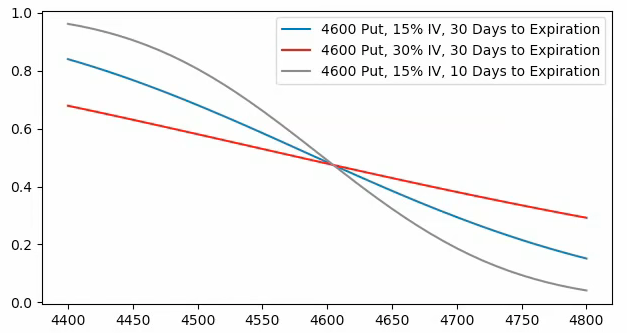
As stated, yesterday, these options, down below, have little time to expiry and, thus, their gamma (options sensitivity to direction) grows rather large, at near-the-money strikes.
As the time to expiry narrows, above the strike in question delta decays, and counterparts buy back their static delta hedges.
As the time to expiry narrows, below the strike in question delta expands and counterparts sell more static delta to hedge.
This means that if below these high-interest strikes, associated hedging, less any new reach for protection would pressure markets lower. If above, hedging, less new sales of protection, would bolster markets higher.
Ultimately, if lower, all else equal, the June 17 OPEX will coincide with the removal of the in-the-money options exposures in question. This opens a window during which markets may have less pressure to rally against.
Bonus: As SpotGamma explains, “[g]iven the supply and demand of volatility, as well as divergences in the volatility that the market realizes and implies from options activity, there’s a case to be made for maintaining positive exposure to direction via long volatility.”
Read: Trading Volatility, Correlation, Term Structure and Skew by Colin Bennett et al. Originally sourced via Academia.edu.
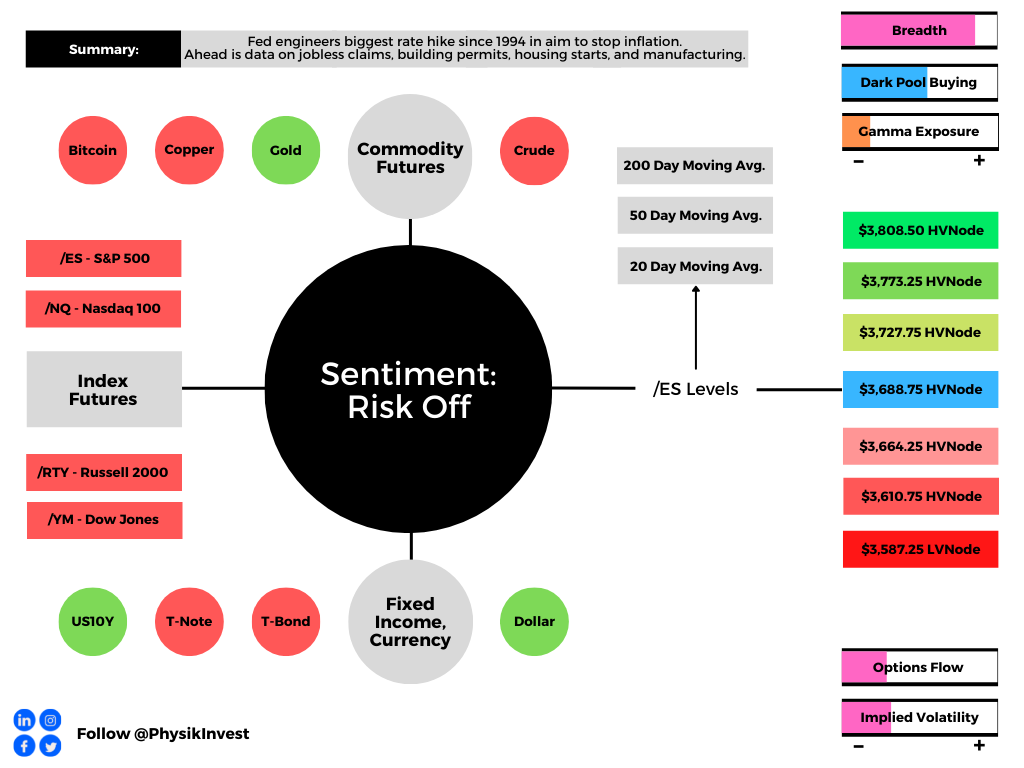
Technical: As of 6:30 AM ET, Thursday’s regular session (9:30 AM – 4:00 PM ET), in the S&P 500, will likely open in the lower part of a negatively skewed overnight inventory, outside of prior-range and -value, suggesting a potential for immediate directional opportunity.
In the best case, the S&P 500 trades higher; activity above the $3,688.75 HVNode puts in play the $3,727.75 HVNode. Initiative trade beyond the $3,727.75 HVNode could reach as high as the $3,773.25 HVNode and $3,808.50 HVNode, or higher.
In the worst case, the S&P 500 trades lower; activity below the $3,688.75 HVNode puts in play the $3,664.25 HVNode. Initiative trade beyond the $3,664.25 HVNode could reach as low as the $3,610.75 HVNode and $3,587.25 LVNode, or lower.
Click here to load today’s key levels into the web-based TradingView charting platform. Note that all levels are derived using the 65-minute timeframe. New links are produced, daily.

What People Are Saying
Definitions
Should the market trend for long periods of time, it will lack sound structure, identified as low volume areas (LVNodes). LVNodes denote directional conviction and ought to offer support on any test.
If participants were to auction and find acceptance into areas of prior low volume (LVNodes), then future discovery ought to be volatile and quick as participants look to HVNodes for favorable entry or exit.
About
After years of self-education, strategy development, mentorship, and trial-and-error, Renato Leonard Capelj began trading full-time and founded Physik Invest to detail his methods, research, and performance in the markets.
Capelj also develops insights around impactful options market dynamics at SpotGamma and is a Benzinga reporter.
Some of his works include conversations with ARK Invest’s Catherine Wood, investors Kevin O’Leary and John Chambers, FTX’s Sam Bankman-Fried, Kai Volatility’s Cem Karsan, The Ambrus Group’s Kris Sidial, among many others.
Disclaimer
In no way should the materials herein be construed as advice. Derivatives carry a substantial risk of loss. All content is for informational purposes only.


2 replies on “Daily Brief For June 16, 2022”
[…] distinction between the economy and the market is blurred and the drop is the recession. The equity markets are a mechanism pricing the implications of all the points we talk about, in […]
[…] Read: Daily Brief for June 16, 2022. […]