
Notice: Physik Invest’s daily market commentaries will be suspended until further notice.
Please accept our apologies for the inconvenience, thank you for the support, and see you next week!
Key Takeaways:
- Banks will lose emergency relief.
- Federal Reserve upping forecast.
- Bond, equity volatility divergent.
- Market is positioned for upside.
What Happened: U.S. stock index futures closed lower, last week.
What Does It Mean: Heading into last week’s Federal Reserve policy update, stock index futures were in balanced, two-sided trade as participants looked for more information to base their next move.
Then, Federal Reserve Chairman Jerome Powell discussed his organization’s commitment to an inclusive recovery. At the same time, the central bank announced it expects real GDP to grow 6.5% and inflation to rise as high as 2.4% this year.
The comments were immediately followed by a vertical price rise.
Thereafter, participants that caused the vertical price rise traded out, evidenced by the index trading lower into Friday’s derivative expiry.
Important to note is that despite the attempted pricing in of rising debt levels and inflation, a divergence in bond and equity market volatility persists. Historically, fear across markets tends to move in tandem. That hasn’t been the case for a number of weeks, now (e.g., Graphic 1).

What To Expect: Directional resolve.
Why? The passage of a large derivative expiry, the resolve of the vertical price range that occurred in the face of Federal Reserve policy updates, as well as market liquidity metrics suggesting opportunistic buying or short covering into weakness, and increased buying pressure (as witnessed through measures like DIX and options activity).
More On DIX: For every buyer is a seller (usually a market maker). Using DIX — which is derived from short sales (i.e., liquidity provision on the market making side) — we can measure buying pressure.

More On Option Expiration (OPEX): Option expiries mark an end to pinning (i.e, the theory that market makers and institutions short options move stocks to the point where the greatest dollar value of contracts will expire worthless) and the reduction dealer gamma exposure.


What To Do: In the coming sessions, participants will want to pay attention to the VWAP anchored from the $3,978.50 overnight rally-high, as well as the high-volume area (HVNode) near $3,900.00.
Volume-Weighted Average Prices (VWAPs): Metrics highly regarded by chief investment officers, among other participants, for quality of trade. Additionally, liquidity algorithms are benchmarked and programmed to buy and sell around VWAPs.

More On Volume Areas: A structurally sound market will build on past areas of high-volume (HVNode). Should the market trend for long periods of time, it will lack sound structure (identified as a low-volume area (LVNode) which denotes directional conviction and ought to offer support on any test).

If participants were to auction and find acceptance into areas of prior low-volume, then future discovery ought to be volatile and quick as participants look to areas of high-volume for favorable entry or exit.

More On Overnight Rally Highs (Lows): Typically, there is a low historical probability associated with overnight rally-highs (lows) ending the upside (downside) discovery process.
In the best case, the S&P 500 remains above the $3,900.00 volume area, and VWAP anchored from the $3,978.50 peak, taking out Friday’s minimal excess high. This would suggest buyers, on average, are in control and winning since the March 17 rally-high.
More On Excess: A proper end to price discovery; the market travels too far while advertising prices. Responsive, other-timeframe (OTF) participants aggressively enter the market, leaving tails or gaps which denote unfair prices.
Any activity below the VWAP anchored from the $3,978.50 peak may (1) leave the $3,900.00 HVNode as an area of supply, offering initiative sellers favorable entry and responsive buyers favorable exit.
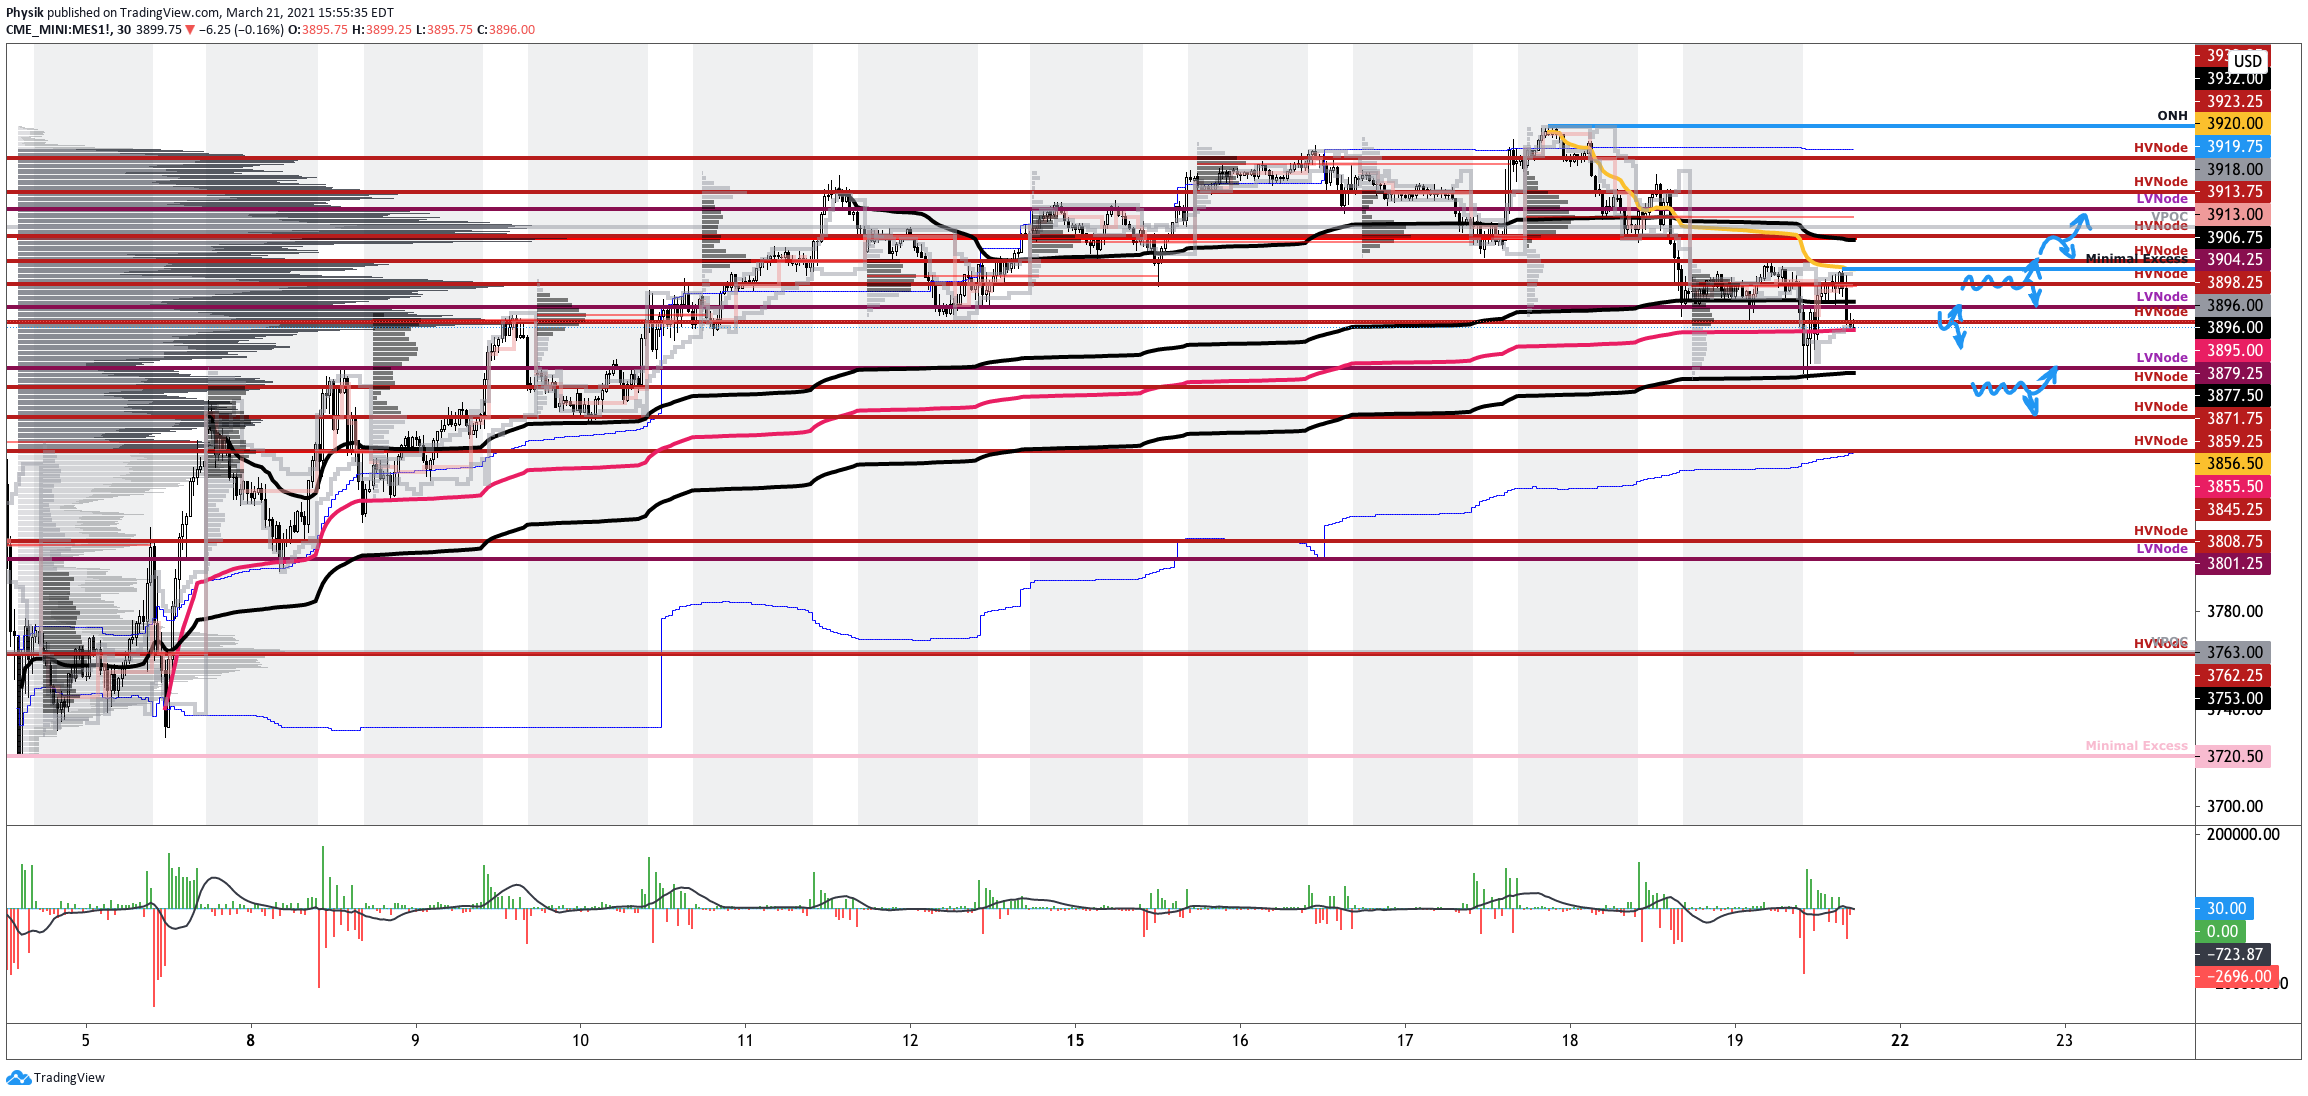

Conclusions: The go/no-go level for next week’s trade is $3,900.00.
Any activity at this level suggests market participants are looking for more information to base their next move. Anything above (below) this level increases the potential for higher (lower).
Levels Of Interest: $3,900.00 HVNode.
Photo by Ylanite Koppens from Pexels.