
Quote Of The Week: “Excessive determinism is almost always the biggest enemy of stability. This seeming contradiction is behind the concept of metastability which captures the mode of market functioning in the last years. Metastability is what seems stable, but is not — a stable waiting for something to happen. [An] avalanche is a good example of metastability to keep in mind — a totally innocuous event can trigger a cataclysmic event (e.g., a skier’s scream, or simply continued snowfall until the snow cover is so massive that its own weight triggers an avalanche).”
Quote by Aleksandar Kocic, Managing Director at Deutsche Bank AG (NYSE: DB), from Heisenberg Report.
Key Takeaways:
- V-pattern recovery suggests higher prices.
- Risks offset and funds looking to re-gross.
- Dip presented a favorable buy opportunity.
What Happened: In light of a v-pattern recovery, after a quick de-risking event, U.S. stock indexes are positioned for further upside, as high as the 100% price projection, which happens to be above $4,000.00, a primary target in the S&P 500.
More On The V-Pattern: A pattern that forms after a market establishes a high, retests some support, and then breaks above said high. In most cases, this pattern portends continuation.
What Does It Mean: This positive price action is happening in the context of bearish undercurrents, as evidenced by non-participatory speculative flows and delta, as well as a divergence in the DIX.
More On Volume Delta: Buying and selling power as calculated by the difference in volume traded at the bid and offer.
More On DIX: For every buyer is a seller (usually a market maker). Using DIX — which is derived from short sales (i.e., liquidity provision on the market making side) — we can measure buying pressure.
More On Speculative Flows: Participants looking to capitalize on either upside or downside through the purchase and sale of options, the right to buy or sell an asset at a later date and agreed upon price.
Adding, according to The Market Ear, similar risk rallies have happened after hedge fund de-grossing events; now, “Equities are rising along higher yields, dollar and [volatility], and the magic word here is discounting inflation.”
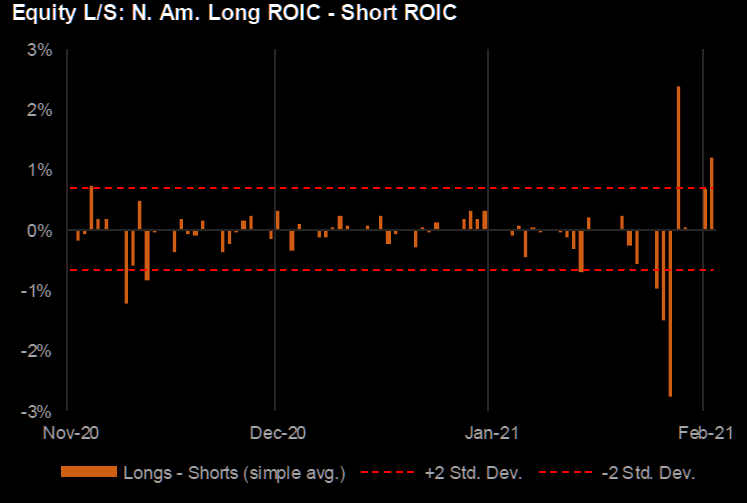
Further, since price pays, participants ought to discount the bearish undercurrents, and position themselves for upside. Hedge funds are doing so, as evidenced by an increase in gross exposures (Graphic 1), alongside other speculative participants that look to capitalize on their opinions through the options market (Graphic 2).

Last week, per Graphic 2, the SPDR S&P 500 ETF Trust, the largest ETF that tracks the S&P 500, saw a rise in purchases of short-dated call and put options. Given the tenor (i.e., the length of time remaining before contract expiration), there’s a lack of long-term commitment to direction.
Adding, early and late in the week, the purchase of put options dominated. This suggests participants were either looking to protect against or capitalize on downside. In the middle of the week, participants were looking to protect against or capitalize on upside.
More On Options: If an option buyer was short (long) stock, he or she would buy a call (put) to hedge upside (downside) exposure. Option buyers can also use options as an efficient way to gain directional exposure.
The above, alongside the market’s re-entry into long-gamma (Graphic 3) and a normalization of the VIX futures term structure (see Graphic 4) in which longer-dated VIX expiries are more expensive, suggests the potential for less risk and volatility in equity markets.
More On Gamma: Gamma is the sensitivity of an option to changes in underlying price. Dealers that take the other side of option trades hedge their exposure to risk by buying and selling the underlying.
When dealers are short-gamma, they hedge by buying into strength and selling into weakness. When dealers are long-gamma, they hedge by selling into strength and buying into weakness. The former exacerbates volatility. The latter calms volatility.


What To Expect: U.S. stock indexes are best positioned for further balance or upside discovery.
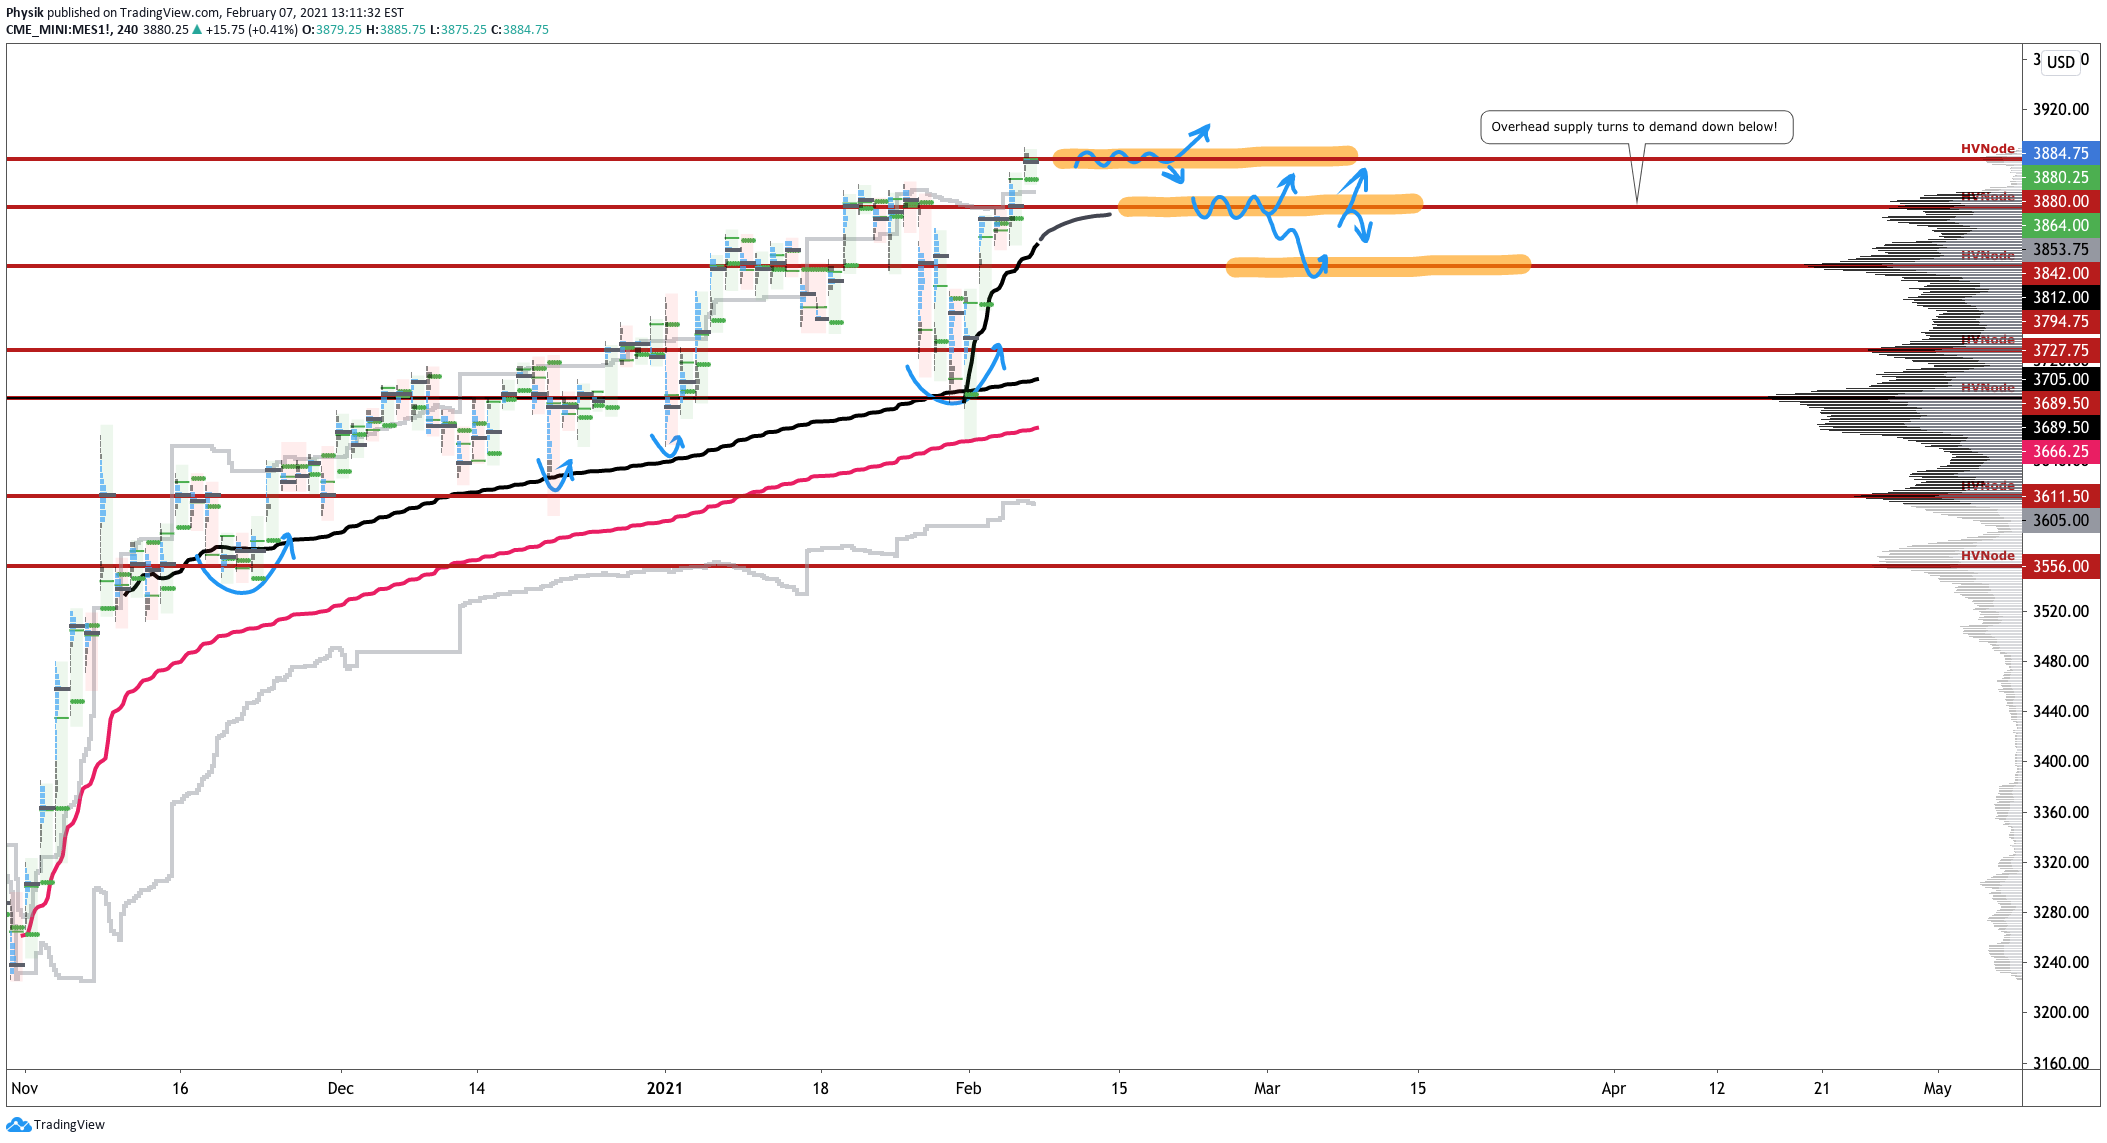
In Graphic 5, the highlighted zones denote high-volume areas (HVNodes), or valuable areas to transact.
More On Volume Areas: A structurally sound market will build on past areas of high-volume. Should the market trend for long periods of time, it will lack sound structure (identified as a low-volume area which denotes directional conviction and ought to offer support on any test).
If participants were to auction and find acceptance into areas of prior low-volume, then future discovery ought to be volatile and quick as participants look to areas of high-volume for favorable entry or exit.
Last Monday, participants found acceptance in prior low-volume. Thereafter, discovery was volatile and quick as participants looked to areas of high-volume for favorable entry and exit (e.g., where the market spent the majority of its time Tuesday through Thursday).
On Friday, the S&P 500 left the HVNode near $3,840.00. As stated, HVNodes can be thought of as building blocks — they also denote areas of supply and demand. In this case, $3,840.00 can now be thought of as an area of demand. The primary strategy is to respond to probes into these supply (i.e., selling responsively) and demand (i.e., buying responsively) areas as they offer favorable entry and exit.
What To Do: Participants will want to pay attention to last Thursday’s $3,855.00 Virgin Point Of Control, or VPOC (i.e., the fairest price to do business in a prior session), and end-of-day spike, as well as the $3,840.00 HVNode.
More On POCs: POCs (like HVNodes described above) are valuable as they denote areas where two-sided trade was most prevalent. Participants will respond to future tests of value as they offer favorable entry and exit.
More On Spikes: Spike’s mark the beginning of a break from value. Spikes higher (lower) are validated by trade at or above (below) the spike base (i.e., the origin of the spike).
Given the above references, the following frameworks ought to be applied.
In the best case, the S&P 500 does some backfilling to repair aforementioned poor structures. In such a case, participants would look for responsive buying to surface at or above the $3,840.00 HVNode.
In the worst case, any break that finds increased involvement (i.e., supportive flows and delta) below the $3,840.00 HVNode, would favor continuation as low as the $3,794.75 and $3,727.75 HVNodes.
Note that the $3,727.75 HVNode corresponds with the $372 SPY put concentration, which may serve as a near-term target, or bottom, for a sell-off.

Conclusions: Simplicity is key here.
Participants ought to look for favorable areas to transact, such as those high-volume areas in the S&P 500 featured in Graphic 5.
Levels Of Interest: $3,840.00 HVNode.
Photo by Josh Sorenson from Pexels.
5 replies on “Market Commentary For The Week Ahead: ‘Ping-Pong’”
[…] Notice: To view this week’s big picture outlook, click here. […]
[…] Notice: To view this week’s big picture outlook, click here. […]
[…] Notice: To view this week’s big picture outlook, click here. […]
[…] Notice: To view this week’s big picture outlook, click here. […]
[…] Notice: To view this week’s big picture outlook, click here. […]