
The daily brief is a free glimpse into the prevailing fundamental and technical drivers of U.S. equity market products. Join the 300+ that read this report daily, below!
What To Expect
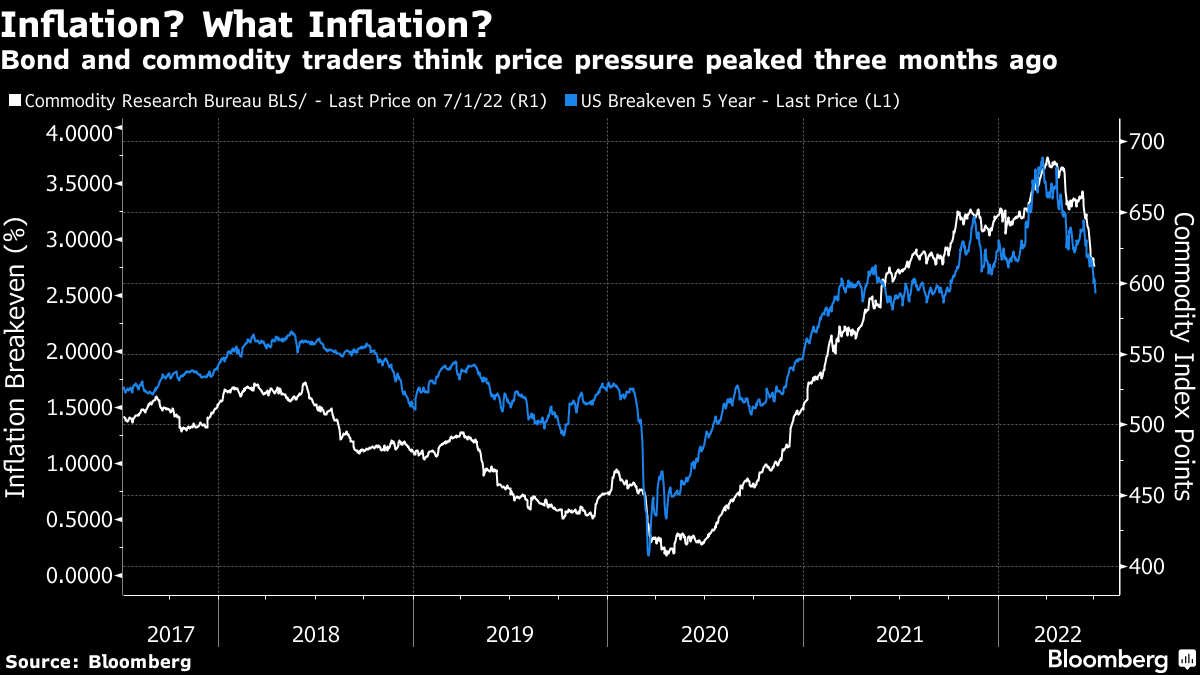
Fundamental: Impressive was the strength of the Nasdaq 100 (INDEX: NDX), relative to the S&P 500 (INDEX: SPX), yesterday.

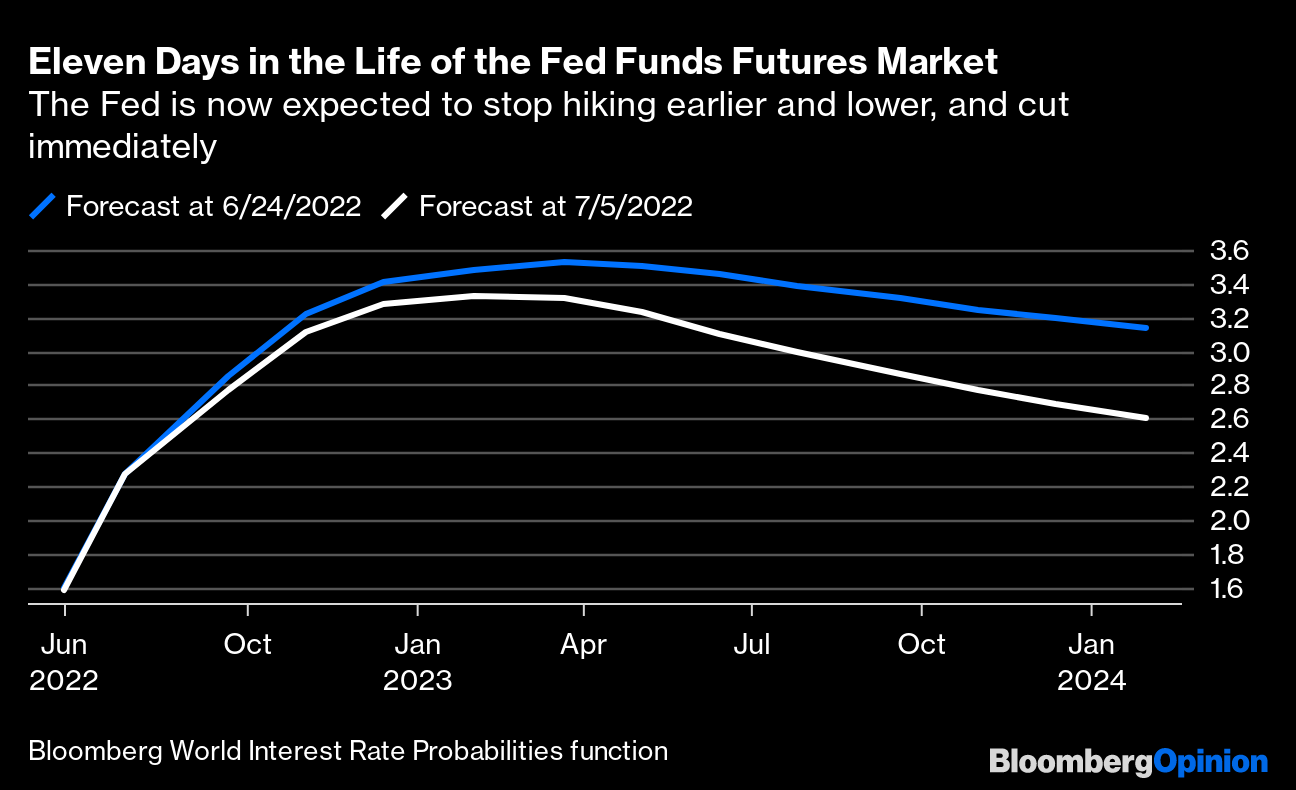
This is as traders are now paring back their bets on monetary tightening, given the deterioration in the U.S. economic outlook. The NDX, which has been most sensitive to changes in monetary policies, accordingly, responded best as that index is comprised of assets that have the most to lose in a high-rate, aggressive quantitative tightening (QT) environment.
For context, QT is the central banking authorities’ removal of balance sheet assets via sales or the non-reinvestment of the principal sum of maturing securities. Accordingly, if bonds are sold, their values fall and yields rise. This pushes yield-hungry investors into less risky categories.
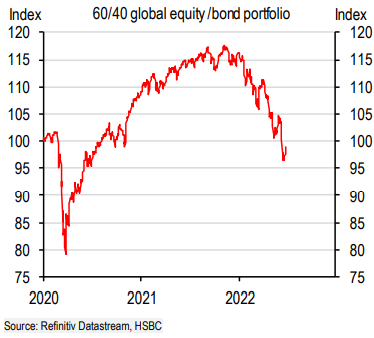
“As you look at where to park your cash for the next six months, you could do worse than to look at a mix of oversold treasuries and stocks – offering both compelling yield and a good degree of value protection,” explains Toggle CEO Jan Szilagyi in a note.
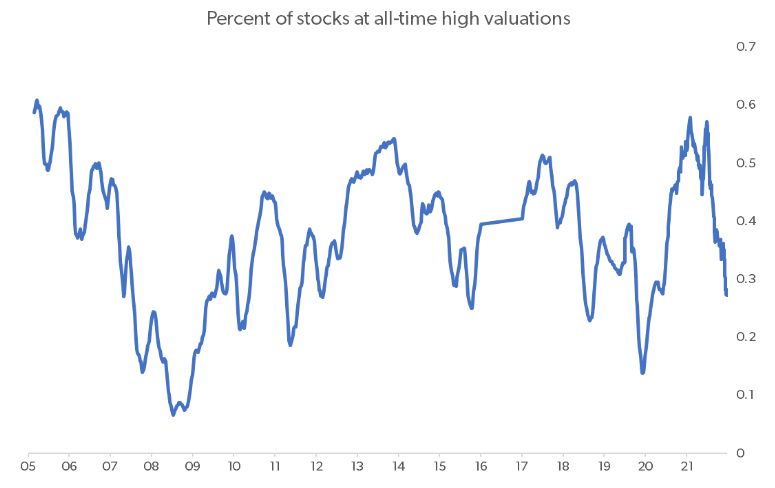
These are comments, however, in the face of what has been a “multiple compression,” as we talked about last week. The upcoming earnings season is likely to shed clarity with respect to corporates’ ability to weather or pass on higher costs, among other things.
In the case of a so-called “earnings compression,” some commentators suggest the market is not priced correctly and another leg lower may be initiated.
Adding, expected are the Federal Open Market Committee (FOMC) meeting minutes, today.
They are likely to “indicate that policymakers were worried about the un-anchoring of inflation expectations, … justifying the Fed’s shift in placing more focus on headline inflation measures rather than just core measures,” according to Bloomberg’s chief U.S. economist Anna Wong.
Positioning: Data shows net gamma exposure increasing which may increasingly feed into smaller ranges if prices continue to rise.
Further, continued are gaps between volatility measures for the rates and equity markets. This is, in part, due to the supply of volatility, as we’ve talked about in past commentaries.
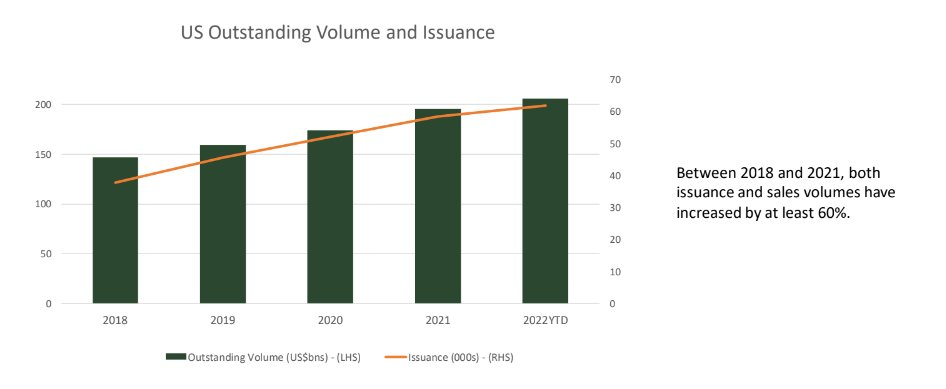
The Ambrus Group’s Kris Sidial adds: “Another reason why equity vol on the index level has been so well offered is due to the structured products market continuing its dominance.”
“Investors are turning to alternatives in this market & these solutions continue to gain attention which leads to index level vol selling.”
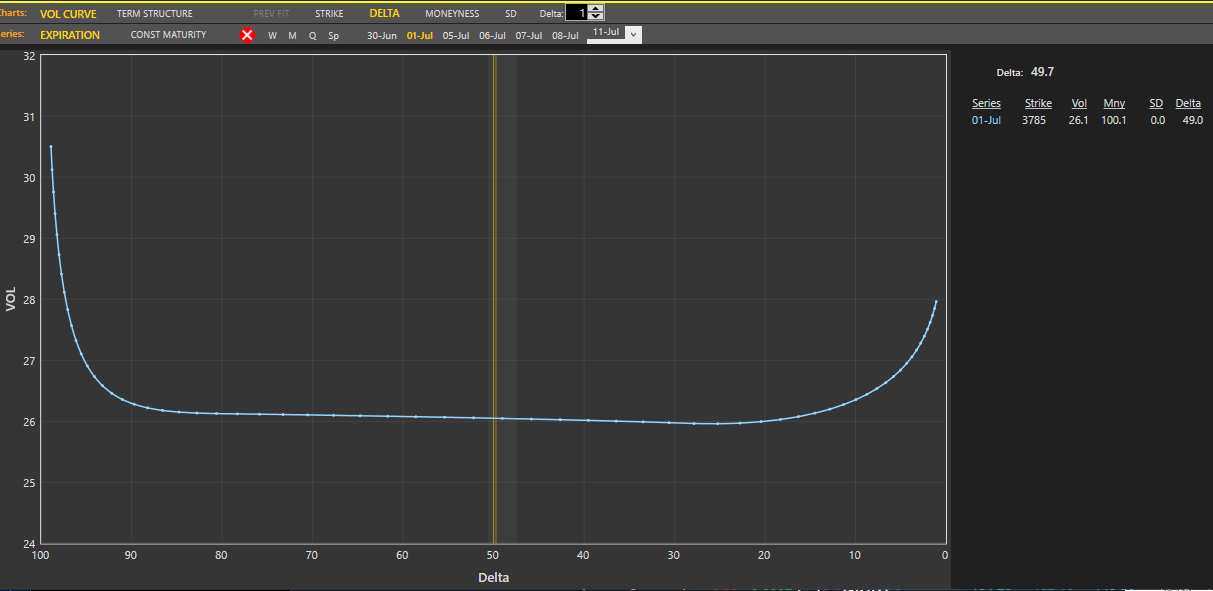
Given this, the relationship between realized volatility (RVOL) has crept and, at times, exceeded that which the market has implied (IVOL). This, coupled with naive metrics for skew, suggests to us that it still makes sense to be a buyer of volatility, albeit via more complex structures.
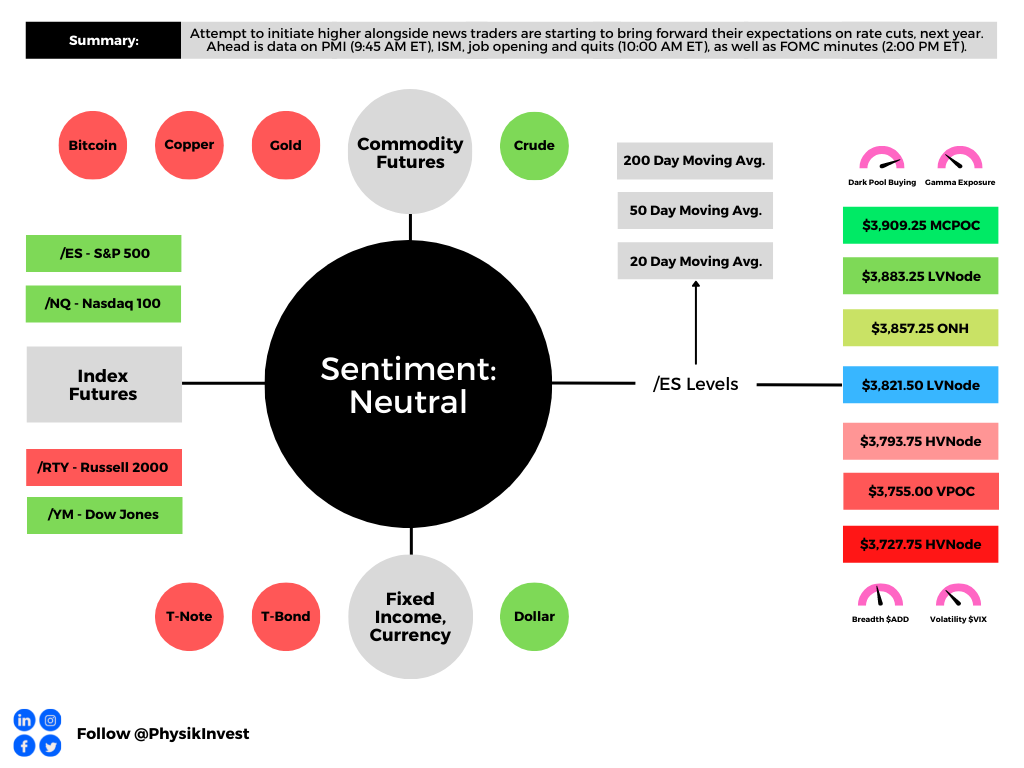
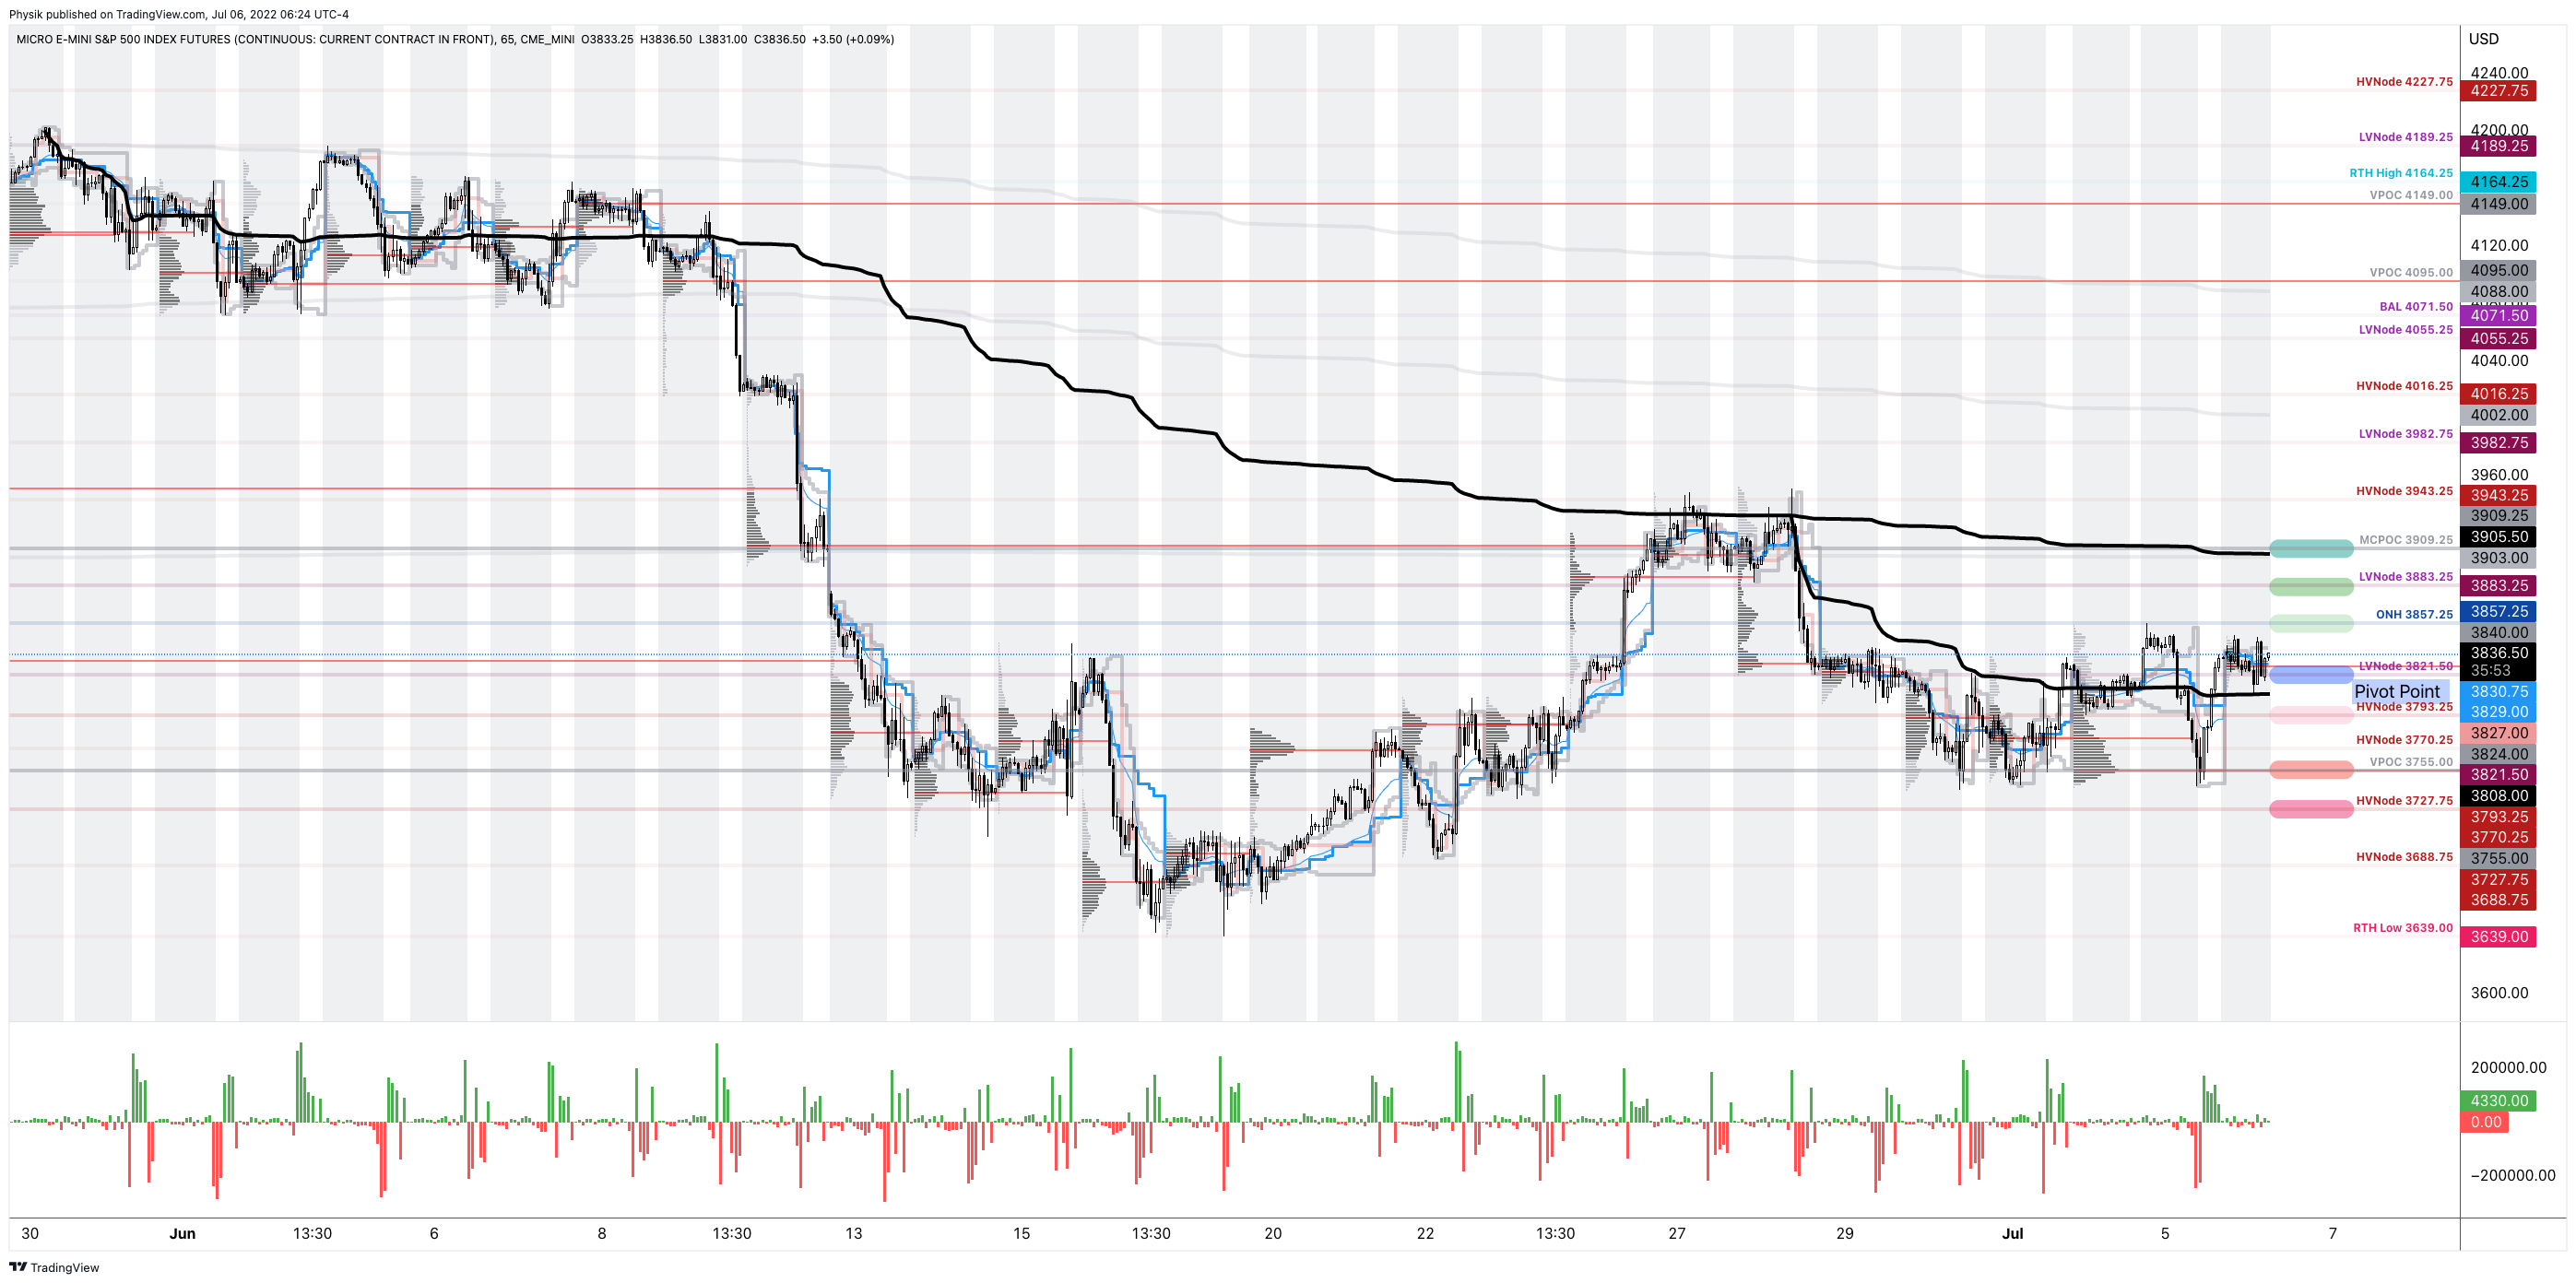
Technical: As of 6:30 AM ET, Wednesday’s regular session (9:30 AM – 4:00 PM ET), in the S&P 500, is likely to open in the mid-to-upper part of a balanced overnight inventory, inside of prior-range and -value, suggesting a potential for immediate directional opportunity.
In the best case, the S&P 500 trades higher.
Any activity above the $3,821.50 LVNode puts into play the $3,857.25 ONH. Initiative trade beyond the ONH could reach as high as the $3,883.25 LVNode and $3,909.25 MCPOC, or higher.
In the worst case, the S&P 500 trades lower.
Any activity below the $3,821.50 LVNode puts into play the $3,793.25 HVNode. Initiative trade beyond the HVNode could reach as low as the $3,755.00 VPOC and $3,727.75 HVNode, or lower.
Click here to load today’s key levels into the web-based TradingView charting platform. Note that all levels are derived using the 65-minute timeframe. New links are produced, daily.
Definitions
Overnight Rally Highs (Lows): Typically, there is a low historical probability associated with overnight rally-highs (lows) ending the upside (downside) discovery process.
Volume Areas: A structurally sound market will build on areas of high volume (HVNodes). Should the market trend for long periods of time, it will lack sound structure, identified as low volume areas (LVNodes). LVNodes denote directional conviction and ought to offer support on any test.
If participants were to auction and find acceptance into areas of prior low volume (LVNodes), then future discovery ought to be volatile and quick as participants look to HVNodes for favorable entry or exit.
POCs: POCs are valuable as they denote areas where two-sided trade was most prevalent in a prior day session. Participants will respond to future tests of value as they offer favorable entry and exit.
About
After years of self-education, strategy development, mentorship, and trial-and-error, Renato Leonard Capelj began trading full-time and founded Physik Invest to detail his methods, research, and performance in the markets.
Capelj also develops insights around impactful options market dynamics at SpotGamma and is a Benzinga reporter.
Some of his works include conversations with ARK Invest’s Catherine Wood, investors Kevin O’Leary and John Chambers, FTX’s Sam Bankman-Fried, former Bridgewater Associate Andy Constan, Kai Volatility’s Cem Karsan, The Ambrus Group’s Kris Sidial, among many others.
Disclaimer
In no way should the materials herein be construed as advice. Derivatives carry a substantial risk of loss. All content is for informational purposes only.


One reply on “Daily Brief For July 6, 2022”
[…] explained yesterday, it makes sense to be a buyer of volatility, albeit via complex […]